Infrastructure Monitoring Basics: Getting Started with Telegraf, InfluxDB, and Grafana
By
Jason Myers
Developer
Apr 05, 2024
Navigate to:
Ensuring the reliability and performance of applications and systems is vital to a healthy infrastructure. With the exponential growth of data, traditional monitoring approaches fall short of providing real-time insights and proactive problem-solving. That’s where InfluxDB comes into play, offering a robust and scalable solution for all your monitoring needs.
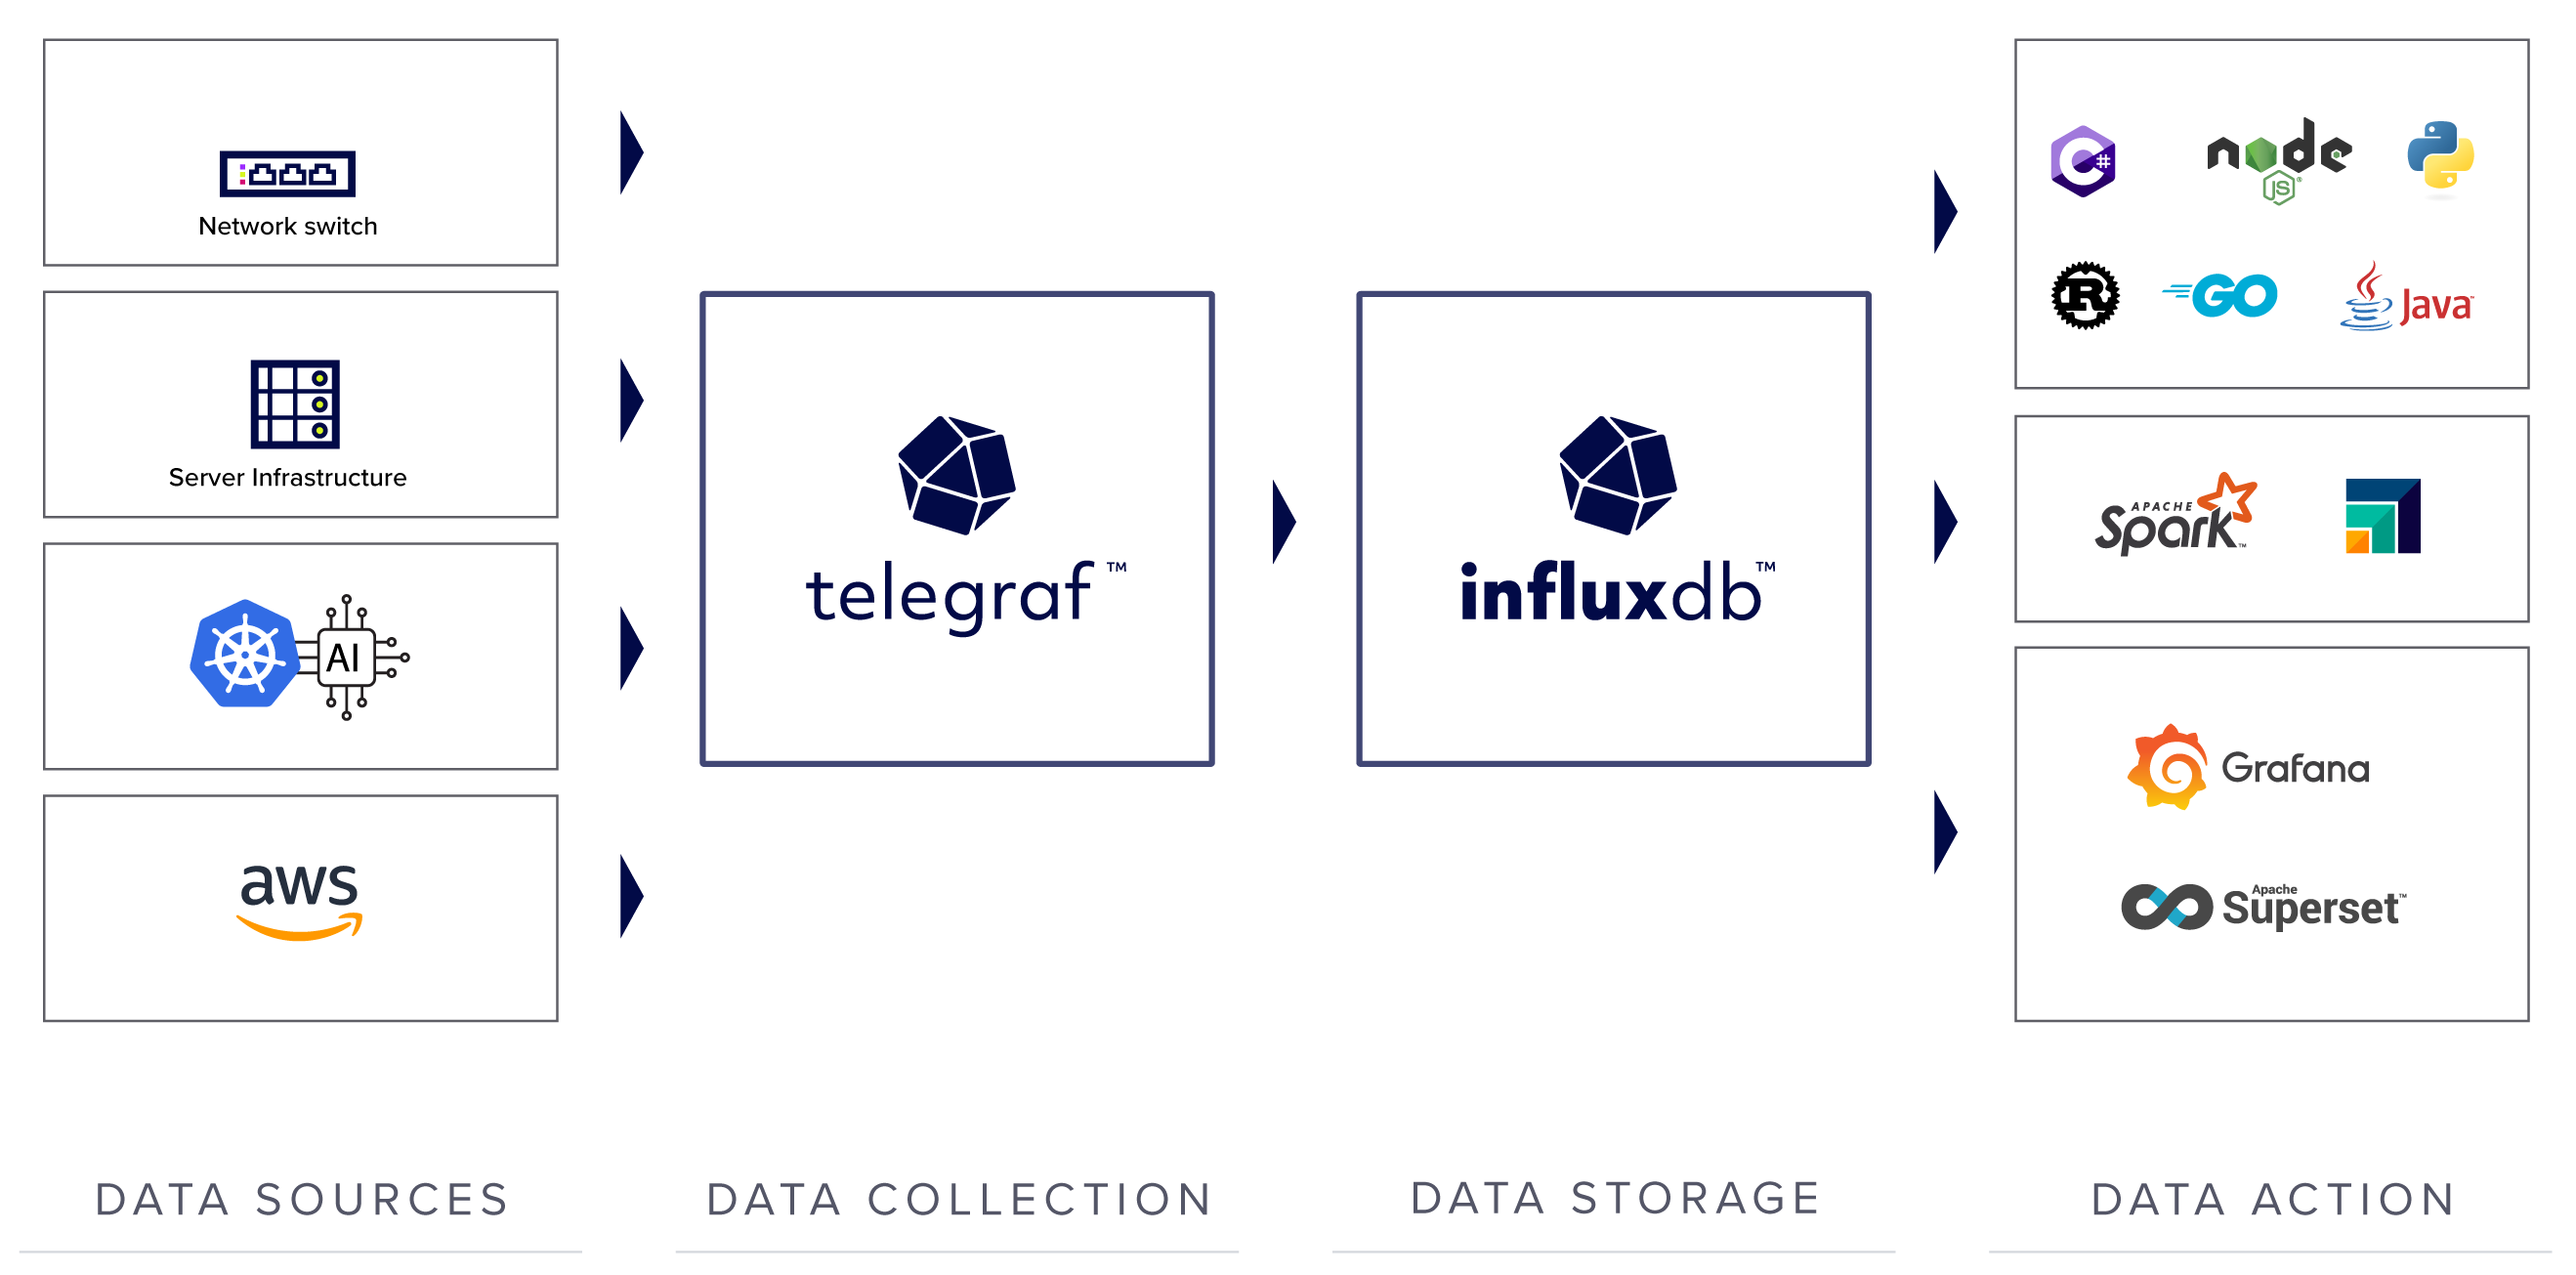
The webinar covers the basics of infrastructure monitoring using the TIG stack, Telegraf, InfluxDB, and Grafana. The session covers a range of topics, including the difference between monitoring and observability, using Telegraf for data collection, InfluxDB for data storage, and Grafana for visualizing and acting on data. To illustrate these concepts, Developer Advocate Anais Dotis-Georgiou presents hypothetical problems and demonstrates how to use the mentioned tools to solve them.
Highlights
1. The combination of Telegraf, InfluxDB, and Grafana enables comprehensive infrastructure monitoring
Anais discussed how to use these three tools for effective infrastructure monitoring. Telegraf, an open source agent, is used for data collection. “Telegraf is our open source plug-in, open source agent for collecting metrics and events. It’s plug-in-driven and has over 12,000 stars on GitHub,” she noted.
InfluxDB, a time series database, is the storage component. InfluxDB 3 is built on the FDAP stack, which includes Apache Flight, DataFusion, Arrow, and Parquet, enabling it to handle high volumes of time series data. These open source technologies also make it easy to extend and integrate InfluxDB with other tools and systems. As a result, InfluxDB 3 offers more interoperability, allowing developers to use a variety of Python libraries and other tools for ETL.
The final tool is Grafana, primarily used for data visualization and alerting. “We use Grafana as the observability hub… and we can use both the Flight SQL plugin or the official InfluxDB v3 plugin and the Jaeger data source to query data from InfluxDB 3, where we consolidated all of our logs, traces, and events and metrics,” she elaborated. “Grafana and InfluxDB have a really great and longstanding relationship. It’s the main visualization tool that we expect our users to use with InfluxDB.”
2. InfluxDB 3 brings significant improvements for handling time series data
InfluxDB is designed to handle time series data, and the new version, InfluxDB 3, brings notable improvements. Enhanced storage and compression allow users to work with and store large volumes of data using less space. It also ingests data faster than previous versions and allows users to query that data in real-time using SQL.
Anais further highlighted how InfluxDB 3 allows developers to ingest logs, traces, and events in addition to metrics. Flexibility and the database’s ability to handle high volumes of data makes it an ideal solution for IoT, analytics, and cloud-native services.
“We have both cloud and edge-based offerings for InfluxDB. And so, there might be some use cases where a user wants to keep their data closer to their source. So what they might do is downsample and aggregate their data before writing their data to a more globally visible store,” she noted.
3. The versatility of Telegraf makes it a valuable tool for data collection
Telegraf, an open source data collection agent, is highly versatile due to its plug-in-driven nature. Anais described how it supports over 300 plugins for ingesting and outputting data, making it one of the most adaptable ingest agents for time series data.
“Telegraf is our open source agent for collecting metrics and events. It’s plug-in-driven and has over 12,000 stars on GitHub,” she stated. Anais emphasized how community-driven Telegraf is, with the majority of the plugins contributed by the community.
She also explained how Telegraf could be configured through a single file and used a variety of flags to test configurations before committing to them. This ease of configuration and testing makes Telegraf a user-friendly tool for data collection.
The example in the webinar bore this out. As Anais explained, “We used Telegraf as our collection backbone. We deployed it on all our servers and cloud infrastructure to collect OpenTelemetry data, Prometheus, and CloudWatch data, as well as raw server-based metrics.”
Next steps
When it comes to infrastructure monitoring, time series data is critical. And when it comes to time series data, InfluxDB is the solution that gives you total control over your data and lets you do more with it.
To try out InfluxDB for yourself, sign up for a free account today.
