Intelligent Monitoring: Automating Dashboard Annotations in Chronograf
By
Sam Dillard
updated December 14, 2025
Use Cases
Developer
Product
Navigate to:
In its latest release, we announced that Chronograf added support for annotating dashboard cells with interesting time-events. This is useful for noting when certain events have occurred; i.e., abnormally high resource utilization, when changes were made to infrastructure, autoscaling events, etc.
Annotations are replicated across all dashboards and their respective cells to allow for the correlation of events in root cause analysis. This is possible because they are stored in InfluxDB by default.
Chronograf also exposes an annotations endpoint via its API. Through this, Kapacitor can be used to automatically annotate dashboards based on rules you’ve set for any metric or event. This is done through the HTTPpost Alert endpoint.
This is a step-by-step guide on how to do that:
- Start InfluxDB as normal (pointing to your Chronograf instance). For this, we'll be using localhost. For getting started with InfluxDB and Chronograf, see InfluxDB and Chronograf docs. Download them here.
- Start Chronograf. Note: auth must be disabled.
- Make note of the source your Chronograf instance is using: 'http://localhost:8888/sources/3/status' means we're using source 3
- In Kapacitor, you'll need to manually edit the HTTPpost section of its configuration file like this (remember to include the appropriate source from the third step in the URL):
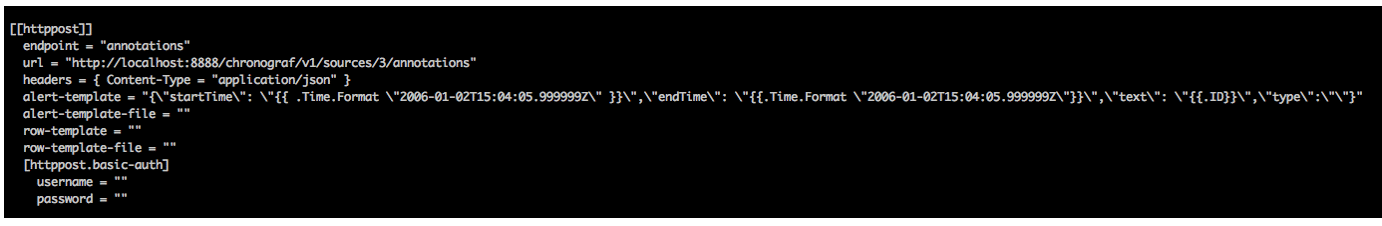
Kapacitor has the ability to POST to any HTTP endpoint with a custom payload. This is being leveraged in the “alert-template” parameter. View the docs for Getting Started with Kapacitor.
- Save and start
kapacitordusing that configuration:kapacitord -config <path/to/config>. - Now you're ready to start using your new endpoint.
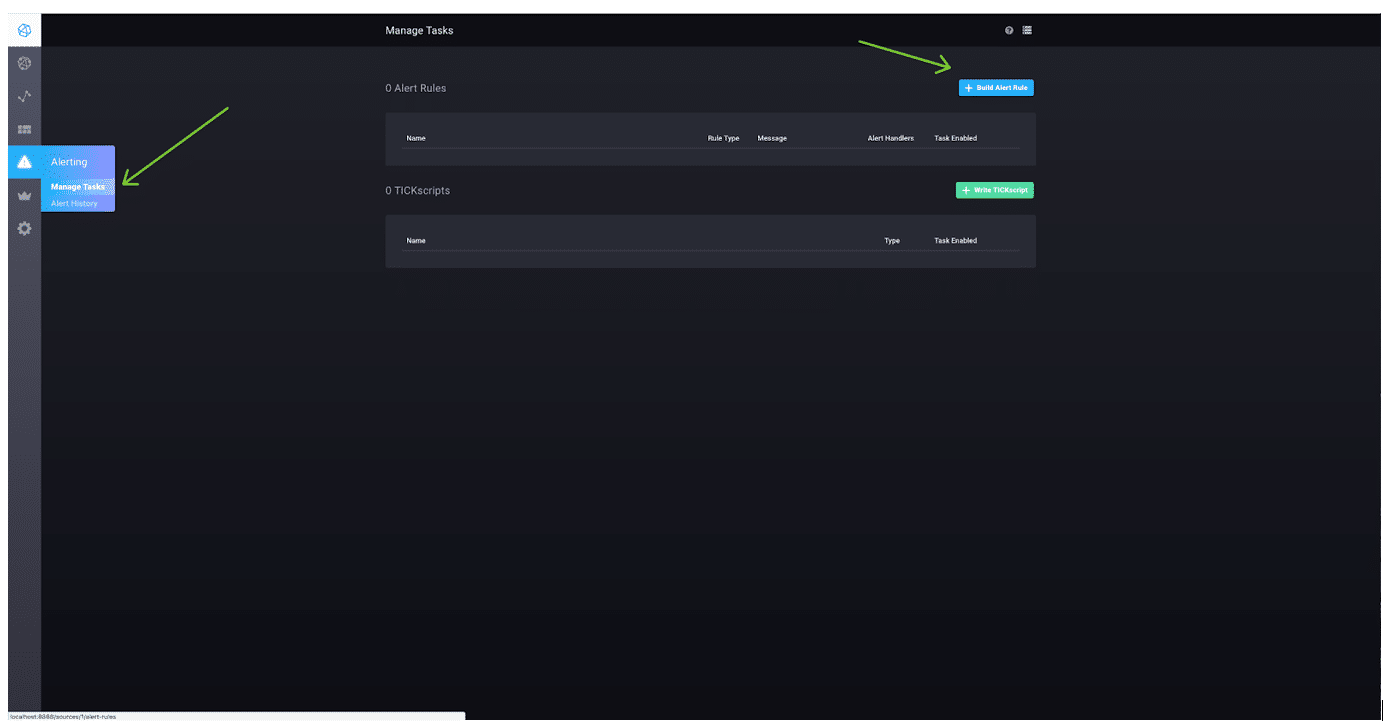
- In Chronograf (http://localhost:8888), create a new alert rule and ignore the alert handlers:
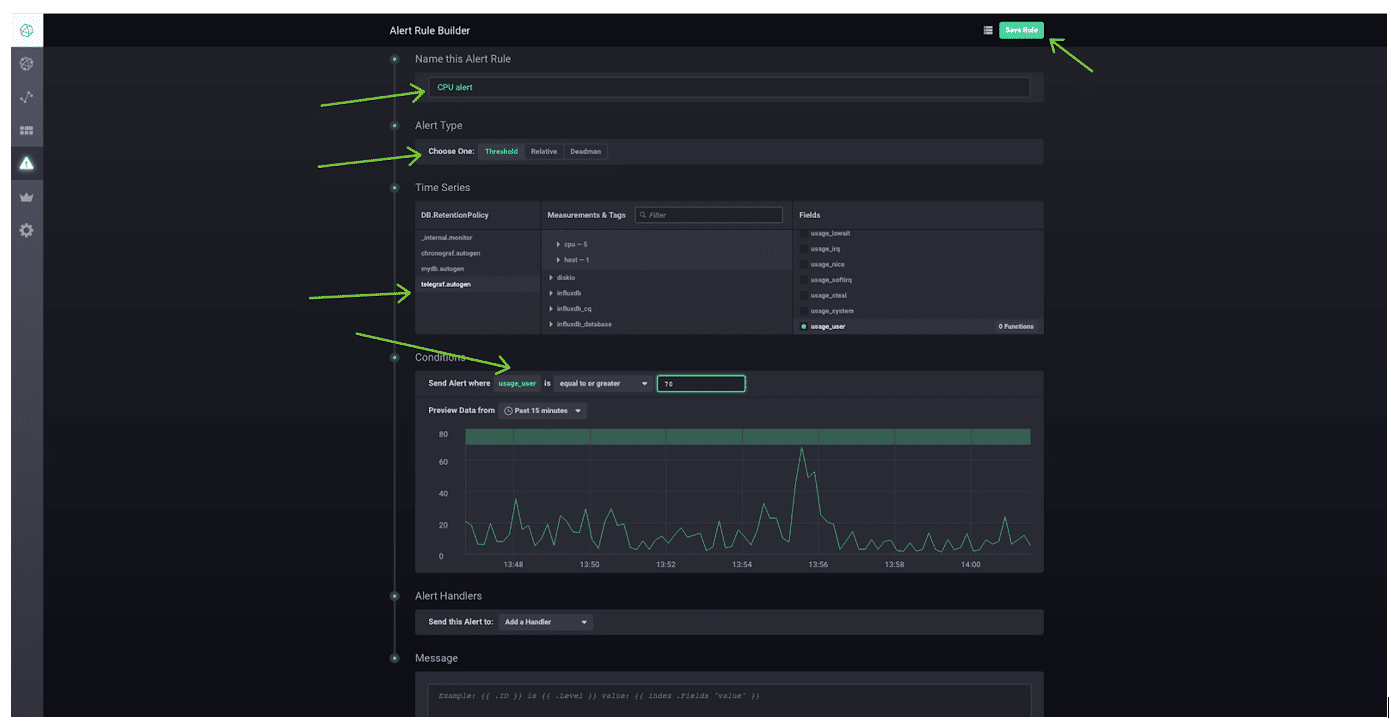
- Save the Alert Rule in the upper right-hand corner.
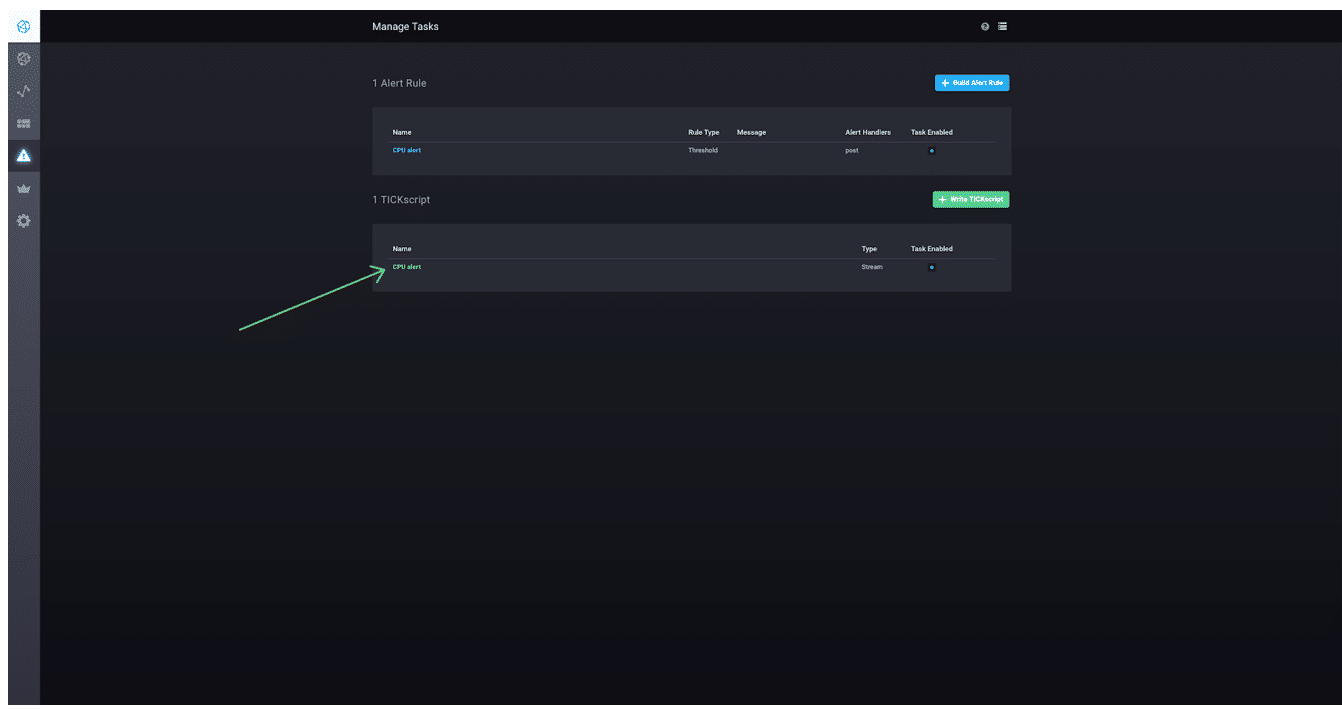
- In the Task Manager page, you can view the actual TICKscript used to generate the alert rule you made with the GUI (it will show up under rules and TICKscripts). Click the rule you just created under the TICKscripts section of the Manage Tasks page.
- In the TICKscript, find the part that reads:
var trigger = data. - Add the following lines to the bottom of that stanza:
.post()and.endpoint('annotations').
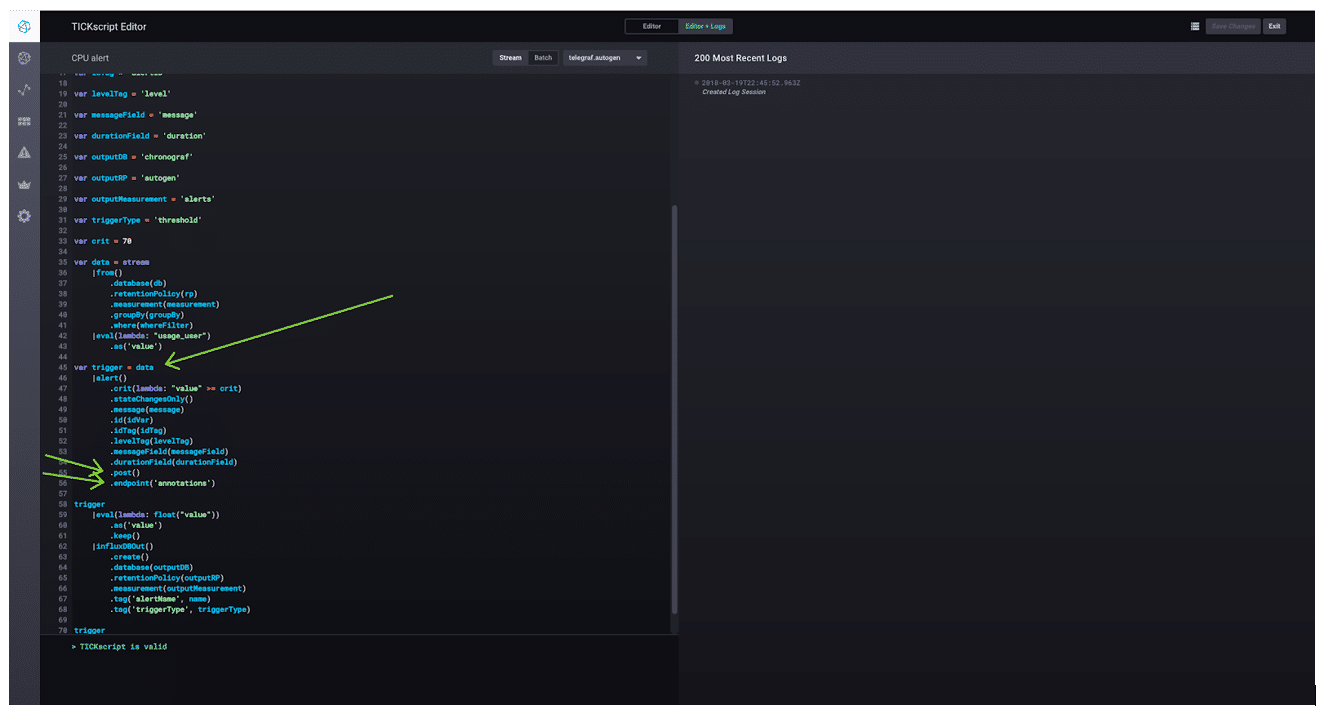
We named the HTTPpost ‘annotations’ in our Kapacitor configuration. This is where the Kapacitor task references that.
Let's test this!
- To test alerts like this, I typically use this tool on my Mac. Feel free to use whatever tool you like.
- Commands:
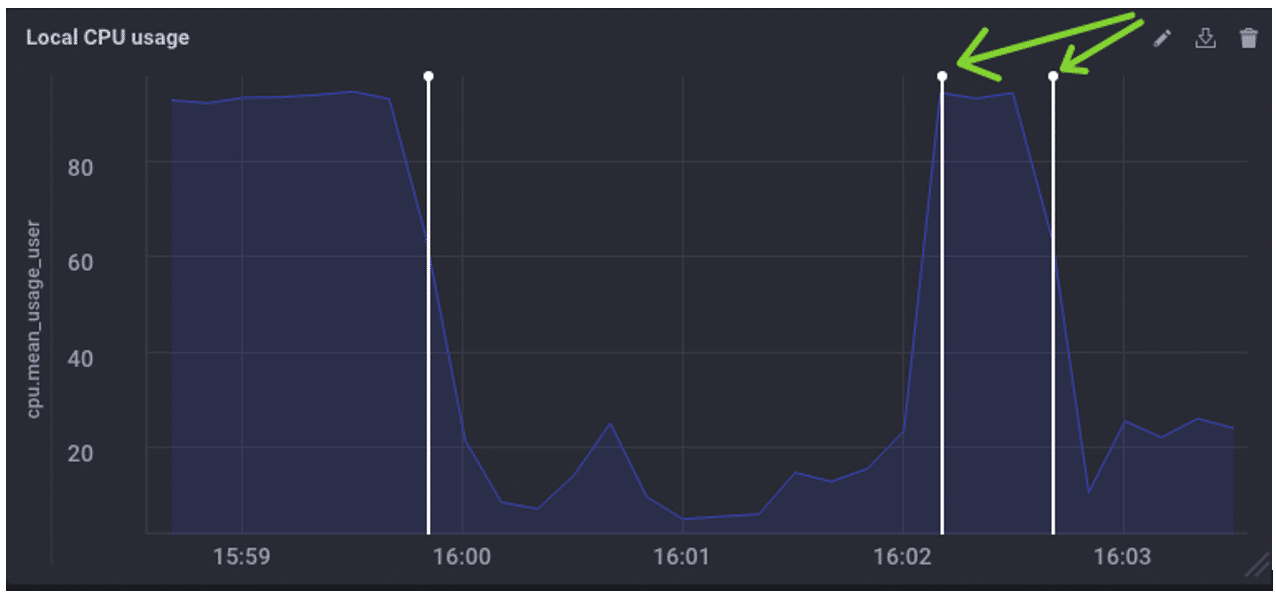
brew install stressandstress -c 4. - Go to a dashboard you've created that monitors the same telemetry your new alert rule does.
- Kill your stress process and refresh the dashboard. You should see something like this:
Even Better...
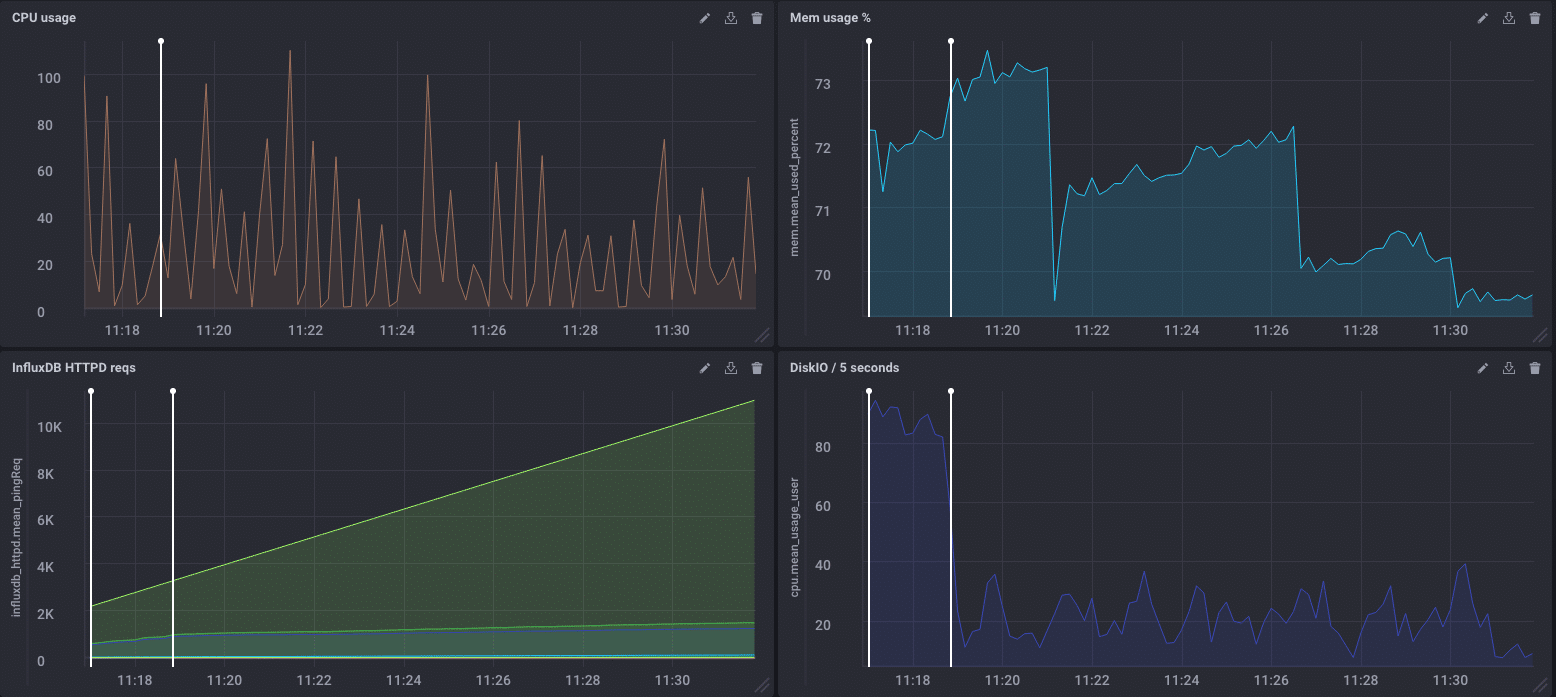
The replication of the annotations across all dashboards and their respective cells…which allows you to look for correlations:
Happy annotating and automating!
