Getting Started with Metrics in Rails
By
Katy Farmer /
Product, Developer, Getting Started
Dec 08, 2017
Navigate to:
If you’re anything like me, you’re new to the metrics scene. You hear its siren call and you want to find out more, but you don’t know where to start. Every time you start a tutorial, you get sidetracked googling the words they’re using in the tutorial (maybe that part is just me). It can be a steep learning curve.
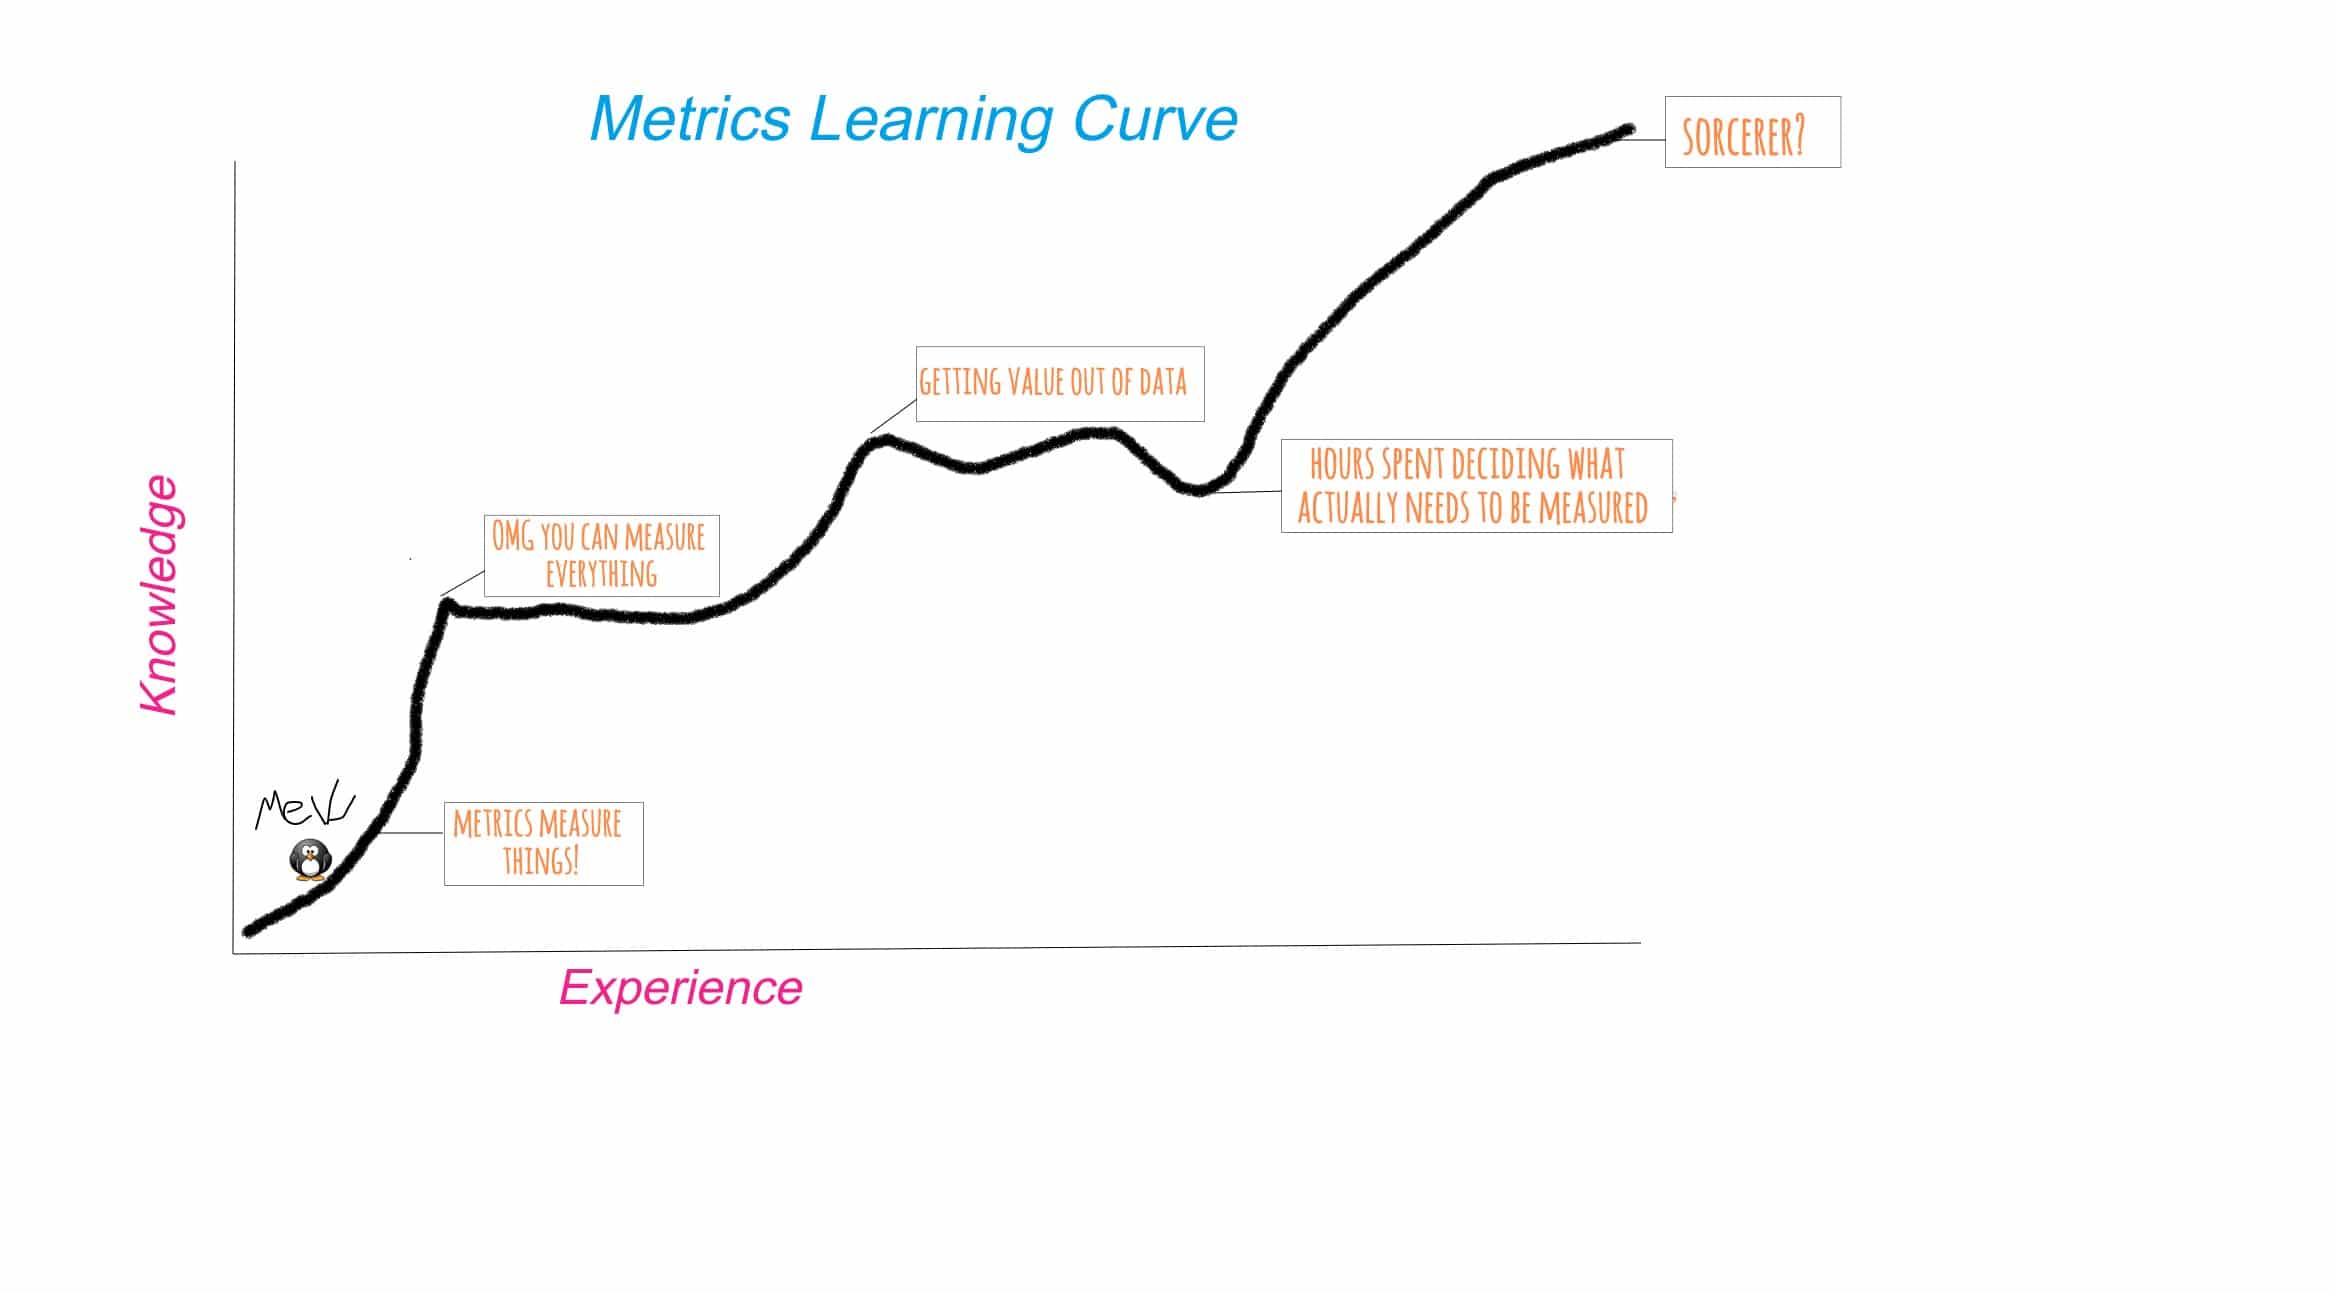 <figcaption> I will be a sorcerer someday</figcaption>
Metrics in Rails
I decided to start with something I do know how to do and try adding a small amount of metrics tools to see what I could learn about a simple Rails app. Rails was a good choice for two reasons: (1) I know how to write Ruby and use Rails, so I can focus on metrics, and (2) Rails often goes unmeasured because we use robust test suites and other tools to tell us what’s going on.
I pulled a Frankenstein and brought an old app back to life, piecing it together until it lurched awake. It’s unstyled, the delete action seems to be broken, and it’s the perfect candidate for measuring. Meet Blogger (you can find the source code on my Github).
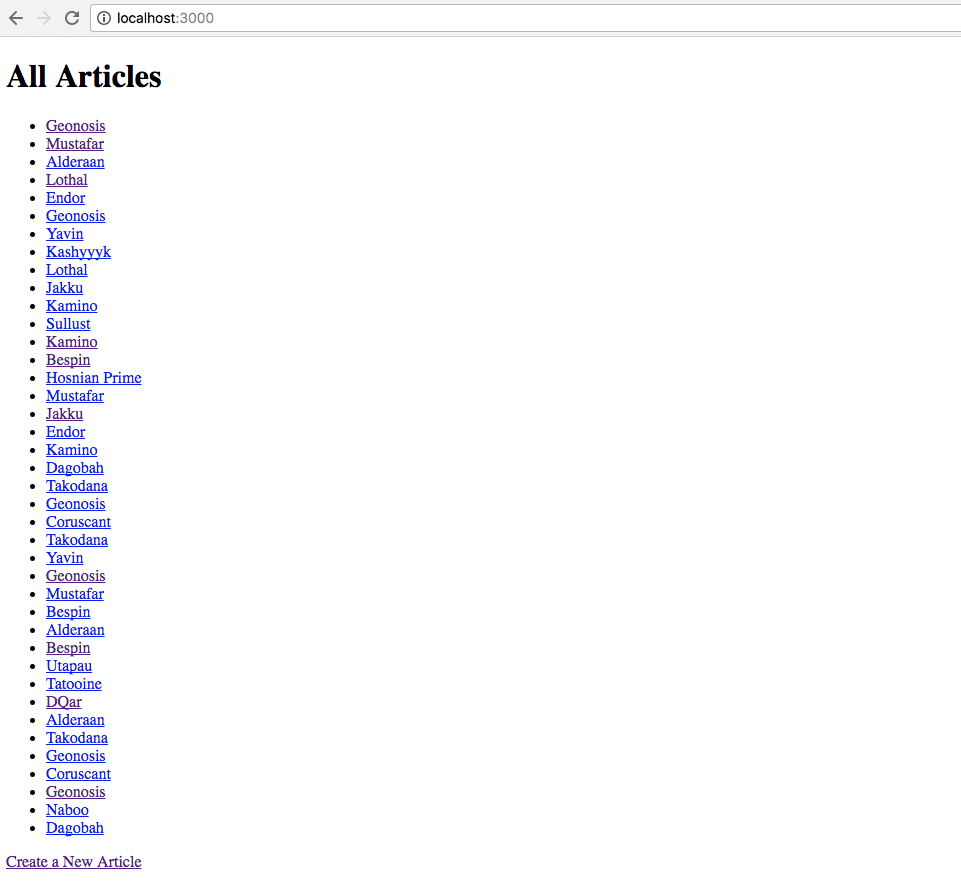 <figcaption> Behold!</figcaption>
What do we want to know about this app? Generally, we’d like to know if it’s failing in unexpected ways, how many requests it’s handling, and whether, like Frankenstein, it has misbehaved badly, gone on a rampage, and is serving only 404s. Request data may not be the most sophisticated metric, but its value is straightforward; existing and serving 200s is the least we expect of Blogger, so that’s a good start point.
There are lots of tools out there to collect metrics, and each of them has a use case that suits it. Knowing where to start is the hardest part, so I took the advice of a friend and watched the talk “Metrics, Metrics, Everywhere” by Coda Hale. He does a brilliant job explaining the value of instrumentation (in summary, we measure things because it helps us form an accurate mental map of their cost). It certainly helped me overcome the vocabulary/knowledge gap I was trying to jump.
Coda’s talk led me to the Ruby metrics library, ruby-metrics by John Ewart, which is based on Coda’s metrics library, metrics (+1 for clear naming). Ruby-metrics has a good README, so it’s the perfect candidate for beginners.
 <figcaption> Me soaking up knowledge</figcaption>
After putting ‘ruby-metrics’ in my Gemfile and bundling, here is what I added into my Rails app.
config.middleware.use(
  Metrics::Integration::Rack::Middleware, :agent => Metrics::Agent.new, :show => '/stats'
)
That’s it. This Rack middleware lives in application.rb, and it creates an endpoint ‘/stats’ that delivers a JSON payload. There are other options for getting the metrics via ruby-metrics, but a ‘/stats’ path is familiar in Rails-land and easy to understand.
{
  "_requests": {
    "count": 6,
    "rates": {
      "one_minute_rate": 0.062685889170148,
      "five_minute_rate": 0.013168198374952,
      "fifteen_minute_rate": 0.0044259829392568,
      "unit": "seconds"
    },
    "durations": {
      "min": 7.6055526733398e-5,
      "max": 0.38426399230957,
      "mean": 0.070876717567444,
      "percentiles": {
        "0.25": 0.0034220218658447,
        "0.5": 0.010805130004883,
        "0.75": 0.016463041305542,
        "0.95": 0.29253399372101,
        "0.97": 0.32922599315643,
        "0.98": 0.34757199287415,
        "0.99": 0.36591799259186
      },
      "unit": "seconds"
    }
  },
  "_uncaught_exceptions": 0,
  "_status_1xx": 0,
  "_status_2xx": 4,
  "_status_3xx": 0,
  "_status_4xx": 2,
  "_status_5xx": 0
}
Look at all these numbers!
And Then JSON
Suddenly, data! I even know what some of it means. And while we can certainly parse this and make sense of the stats, wouldn’t a visualization be an easier way to get to the important details faster? Is everything okay? Is Frankenstein attacking the villagers?
To see how things are going, we need some help. Again, there are lots of tools available. If I can populate my blog app with random planets from the Star Wars universe, anything can happen and dreams do come true. My point is that if you have a visualization tool you love, use it. For this example, I’m going to use Chronograf because it’s easy to set up and I like the folks that make it.
This is also the point in the process where I slid back down the learning curve. Here’s what I knew: I had a JSON payload at the ‘/stats’ endpoint and I wanted to use Chronograf to view that data.
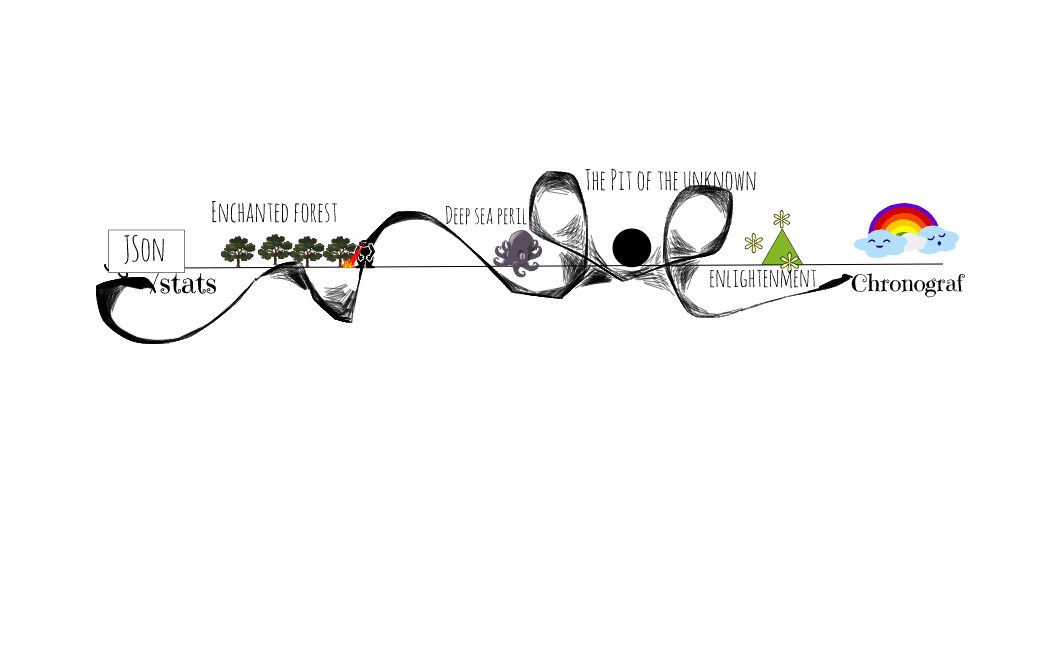 <figcaption> My thought process</figcaption>
If you’re following along and you haven’t installed the TICK Stack before, here is a quick, 5-minute guide to getting started.
Configuring Telegraf
As the internet and some of my coworkers soon informed me, part of the enchanted forest pictured above is Telegraf, which solely exists to collect data, and another part is a database that Chronograf can connect to. In order to view my stats in Chronograf, we need to set up a pipeline. Luckily, Telegraf is plugin-driven, and there were two types of plugins that sounded exactly right: input and output. One of the inputs stuck out right away: httpjson. Boomthat’s one end of the spectrum. I found my telegraf configuration file using the Telegraf Getting Started guide. It differs depending on your OS, but on MacOS, it’s at /usr/local/etc/telegraf.conf. You can generate a sample Telegraf config file, but too much information can be overwhelming (at least, for me).
[[inputs.httpjson]]
## Name for the service being polled. Will be appended to the name of the
## measurement e.g. "httpjson_webserver_stats".
##
## Deprecated (1.3.0): Use name_override, name_suffix, name_prefix instead.
name = "webserver_stats"
Name is left as the default, but if I decide to use more than one input plugin later on, I’d change it. Also, there’s a note here about deprecation, which I always want to pay attention to, but my attempts to use something other than name kept breaking. I want to follow up on this because I don’t want to keep deprecated code around (I’ll update Blogger when I figure it out).
## URL of each server in the service's cluster
servers = [
"http://localhost:3000/stats"
]
I replaced the boilerplate address with the location of Blogger’s stats.
## Set response_timeout (default 5 seconds)
response_timeout = "5s"
The docs suggest that reducing the response timeout probably isn’t a good idea. I believe them.
## HTTP method to use: GET or POST (case-sensitive)
method = "GET"
This defaults to GET, which is perfect for Blogger. One thought I had was how this might change if I needed authorization to hit the endpoint. For now, my vulnerable (but local) endpoint should work.
I hit another wall at this step. I had hooked up my input plugin. Probably. But I couldn’t be sureand I didn’t know how to be sure. After spending way too much time looking for a way to dig into Telegraf to see what’s happening (which I’m sure is possible and probably not all that complicated), I decided to jump to the output plugin. If I could hook up Telegraf to a database, I could check to see if the pipeline was working.
For my database, I almost chose Postgres because I’ve used it before and I know it well. However, when I thought about the structure of a relational database, it didn’t feel like a good fit. I didn’t want to have to do a lot of work to store the Blogger stats, so I needed something with a looser format. Another factor was that my Blogger stats seemed more valuable over time than they did individually. A single failure is fine with mebut a pattern of failure is sad, and probably no one will write their blogs on my sad Blogger app.
I chose InfluxDB; as a Time Series Database, it can group data points by time periods, and it doesn’t require a predefined schema. Again, I referred to the README for the InfluxDB output plugin to set up the config file. Contrary to my early efforts, input and output plugins can go in the SAME file.
[[outputs.influxdb]]
## The full HTTP or UDP URL for your InfluxDB instance.
##
## Multiple urls can be specified as part of the same cluster,
## this means that only ONE of the urls will be written to each interval.
# urls = ["udp://127.0.0.1:8089"] # UDP endpoint example
urls = ["http://127.0.0.1:8086"] # required
The default port for InfluxDB is 8086, which is where we want the data to end up.
## The target database for metrics (telegraf will create it if not exists).
database = "metrics" # required
As always, I could name this anything I want, which is tempting, but if I call it gravy_train, I will expect it to be full of gravy, not metrics.
## Write timeout (for the InfluxDB client), formatted as a string.
## If not provided, will default to 5s. 0s means no timeout (not recommended).
timeout = "5s"
Let’s be honest, at some point I’m going to change this to zero to see what happens. Today is not that day.
Visualizing My Metrics
At this point, I was sweaty, hungry, and I needed this to work. It was time to run Blogger and Telegraf. Keep in mind that the path to your config file is relative.
rails stelegraf --config telegraf.confI clicked around on Blogger, wistfully watching it succeed and fail. I checked the ‘/stats’ endpoint. The numbers were there.
 <figcaption> Don’t throw up, don’t throw up</figcaption>
The best way to check if the stats made it through the pipeline was the Influx CLI.
$influxYou should see confirmation that you have connected to InfluxDB.
>SHOW DATABASESHopefully, you see at least _internal and metrics (or the name of your DB).
>USE metricsThis is how we tell InfluxDB which database we want to query.
>SHOW measurementsIf the stars are in alignment (also, the pipeline), we should see the httpjson data listed here.
Now that the stats were in the database (squee!), I could see the good news in Chronograf. I went to the Dashboards tab in Chronograf, created a new Dashboard and selected my database from the list. This is a graph I made of the total number of requests per minute for the previous five minutes.
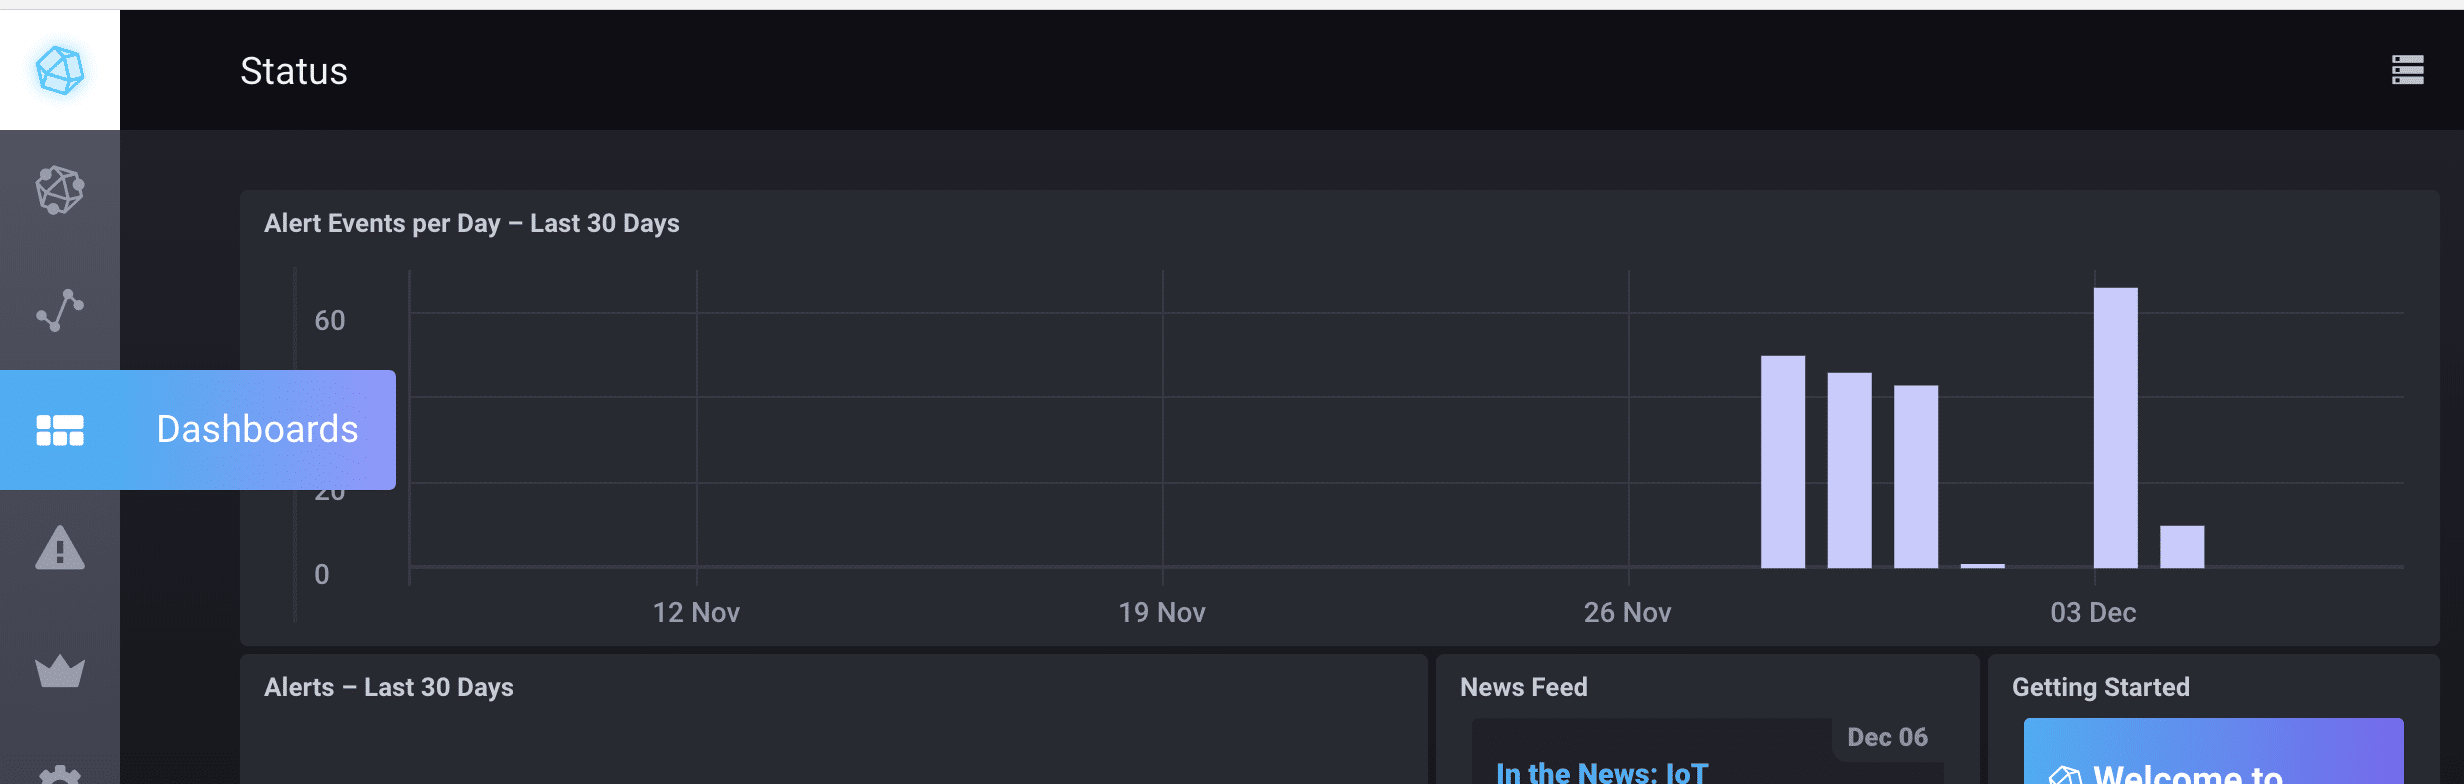 <figcaption> Select the Dashboards tab.</figcaption>
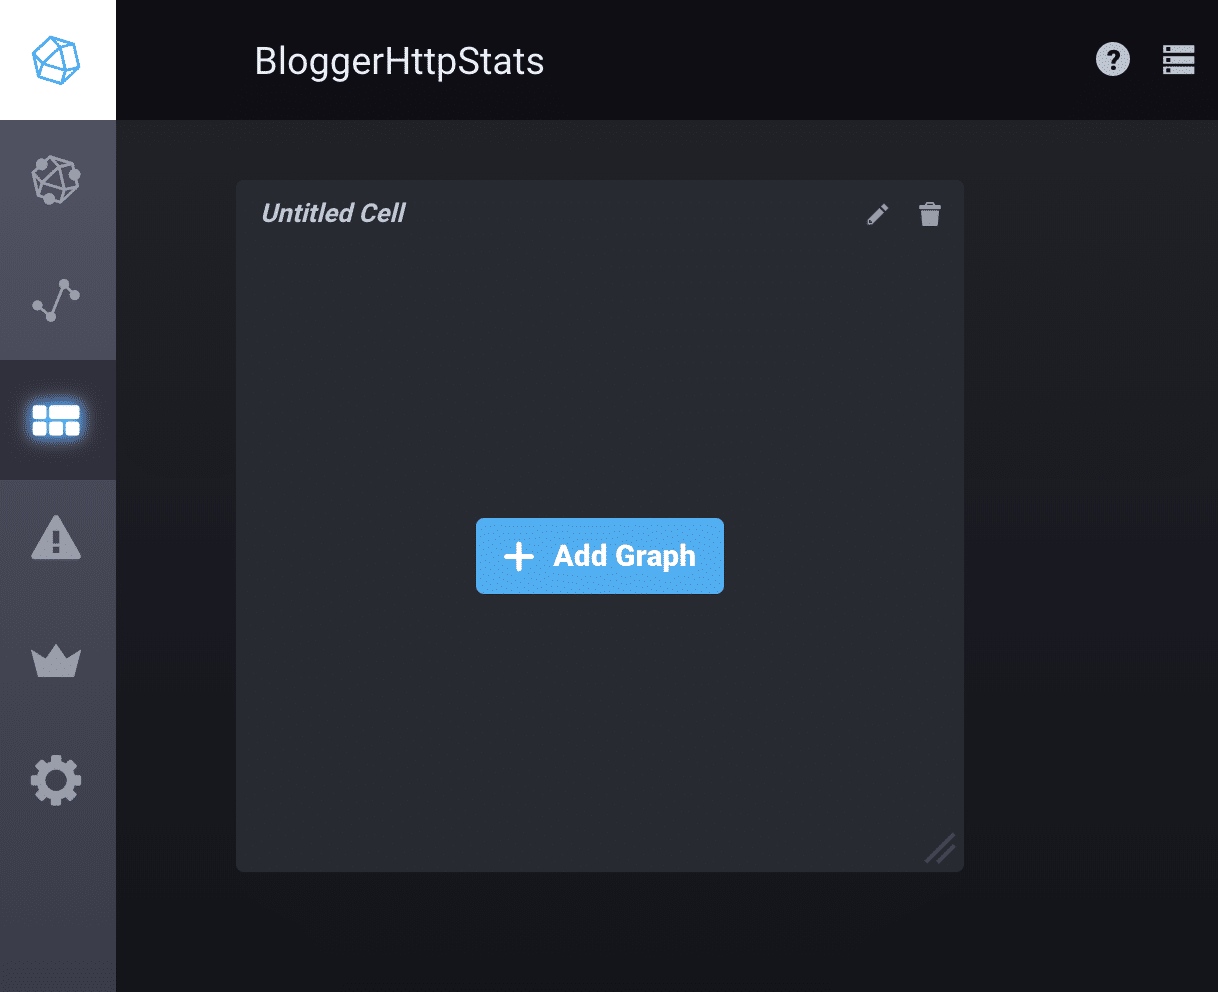 <figcaption> Select Create New Dashboard and then Add Graph.</figcaption>
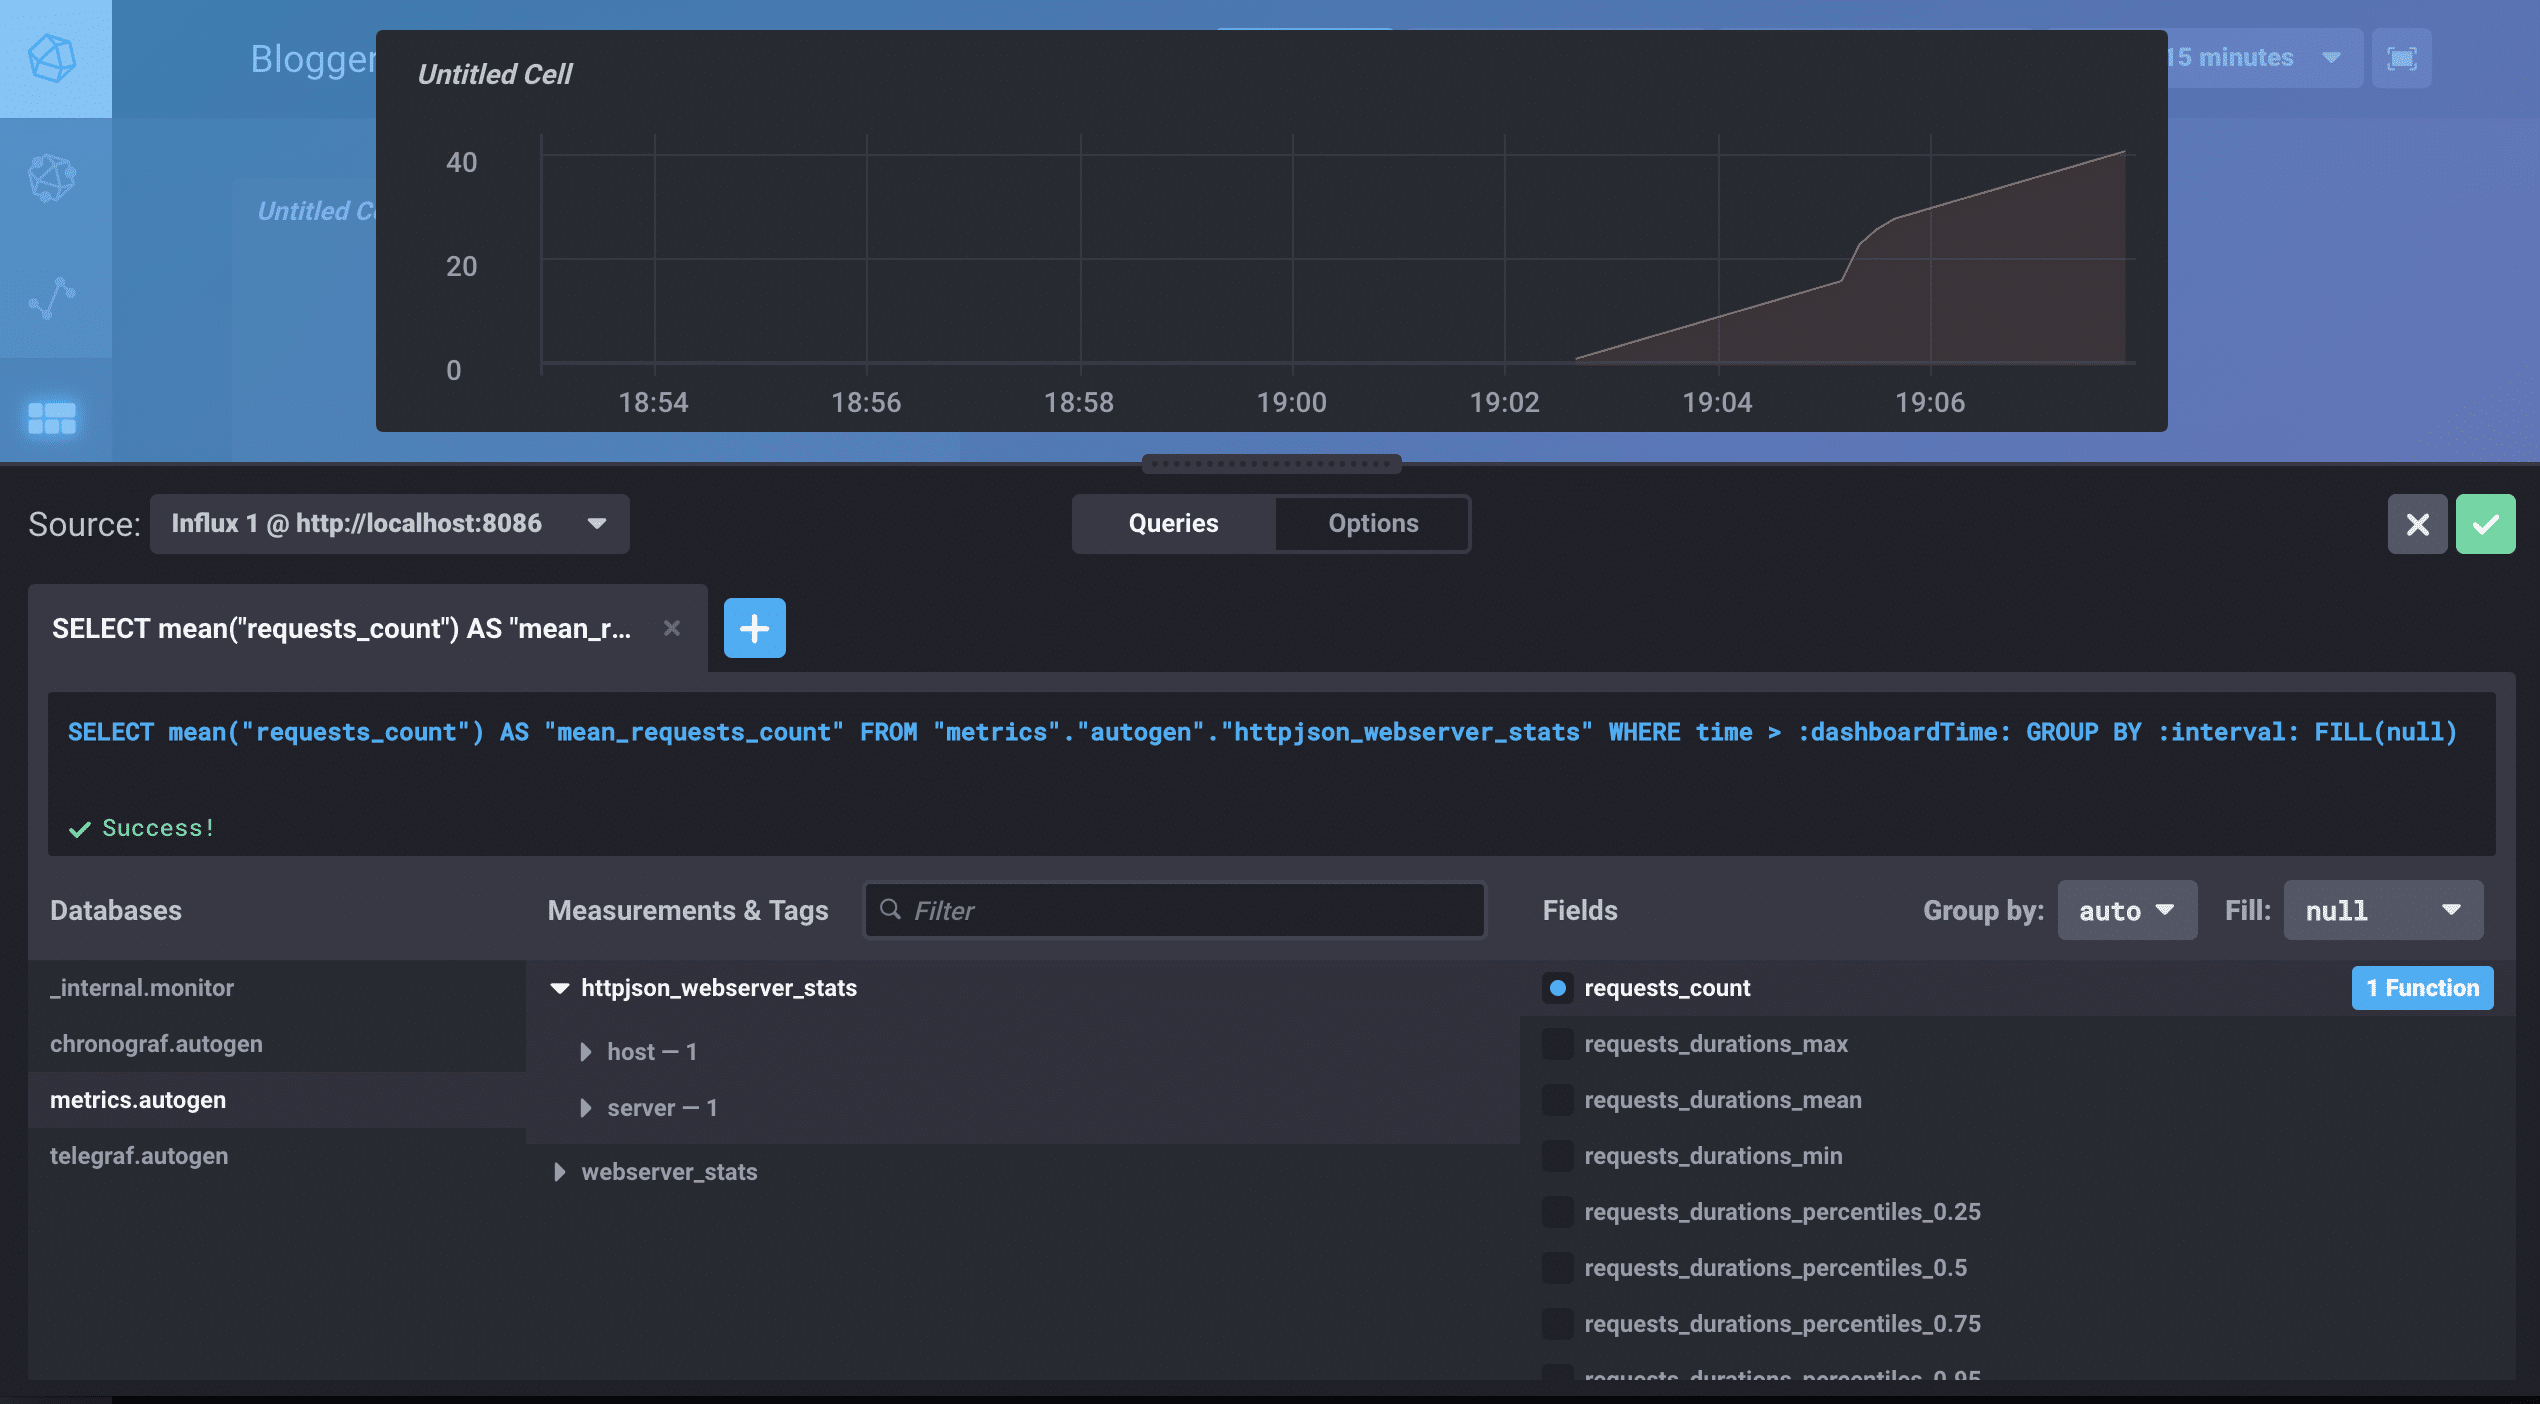 <figcaption> Select Add A Query. Choose your DB, your measurement, and your fields.</figcaption>
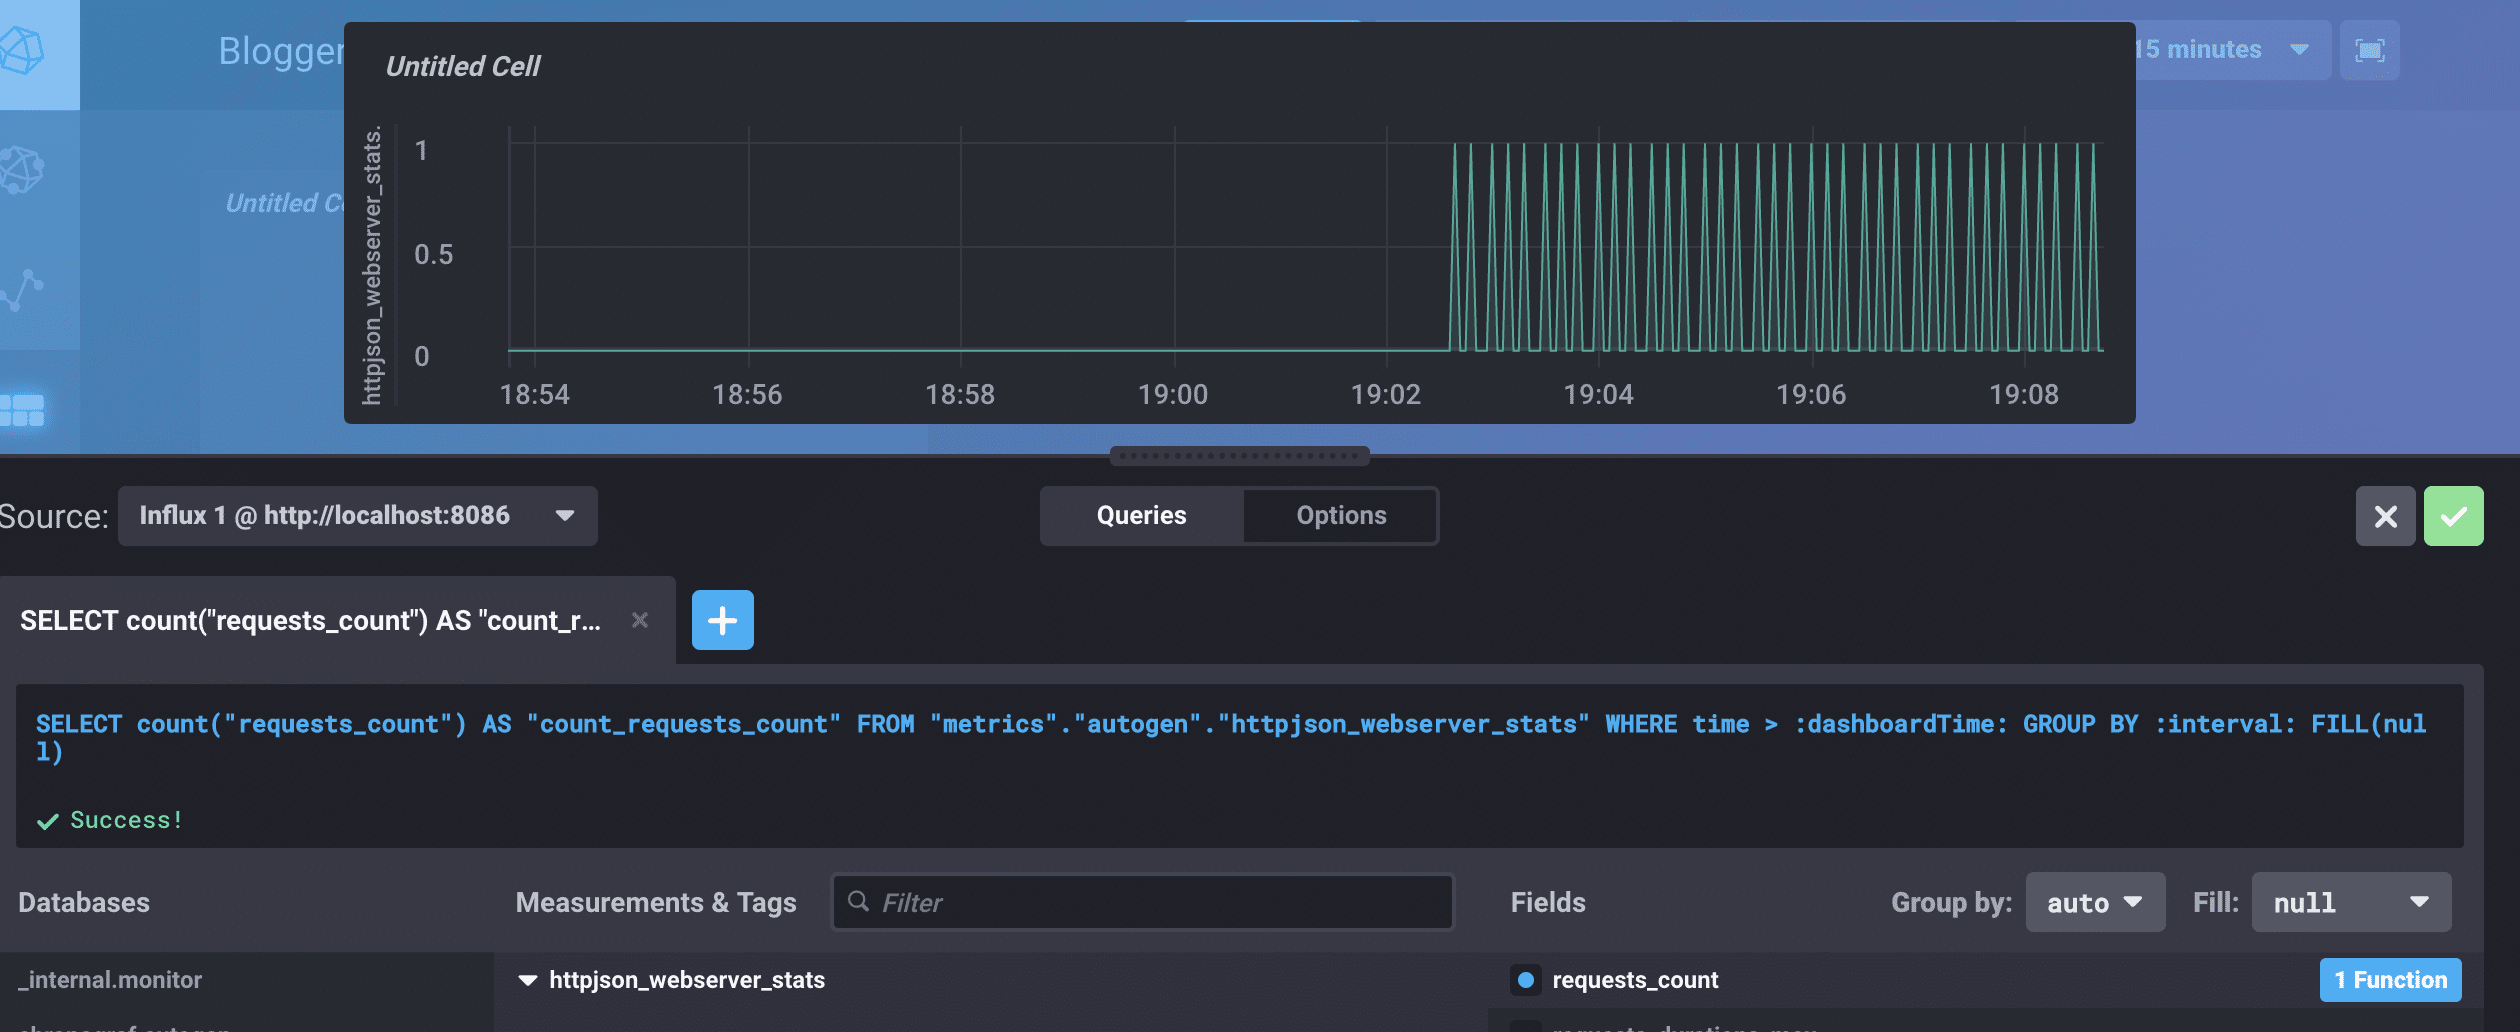 <figcaption> I changed the requests_count function to be the count instead of the mean so I could see each request. Click the green check!</figcaption>
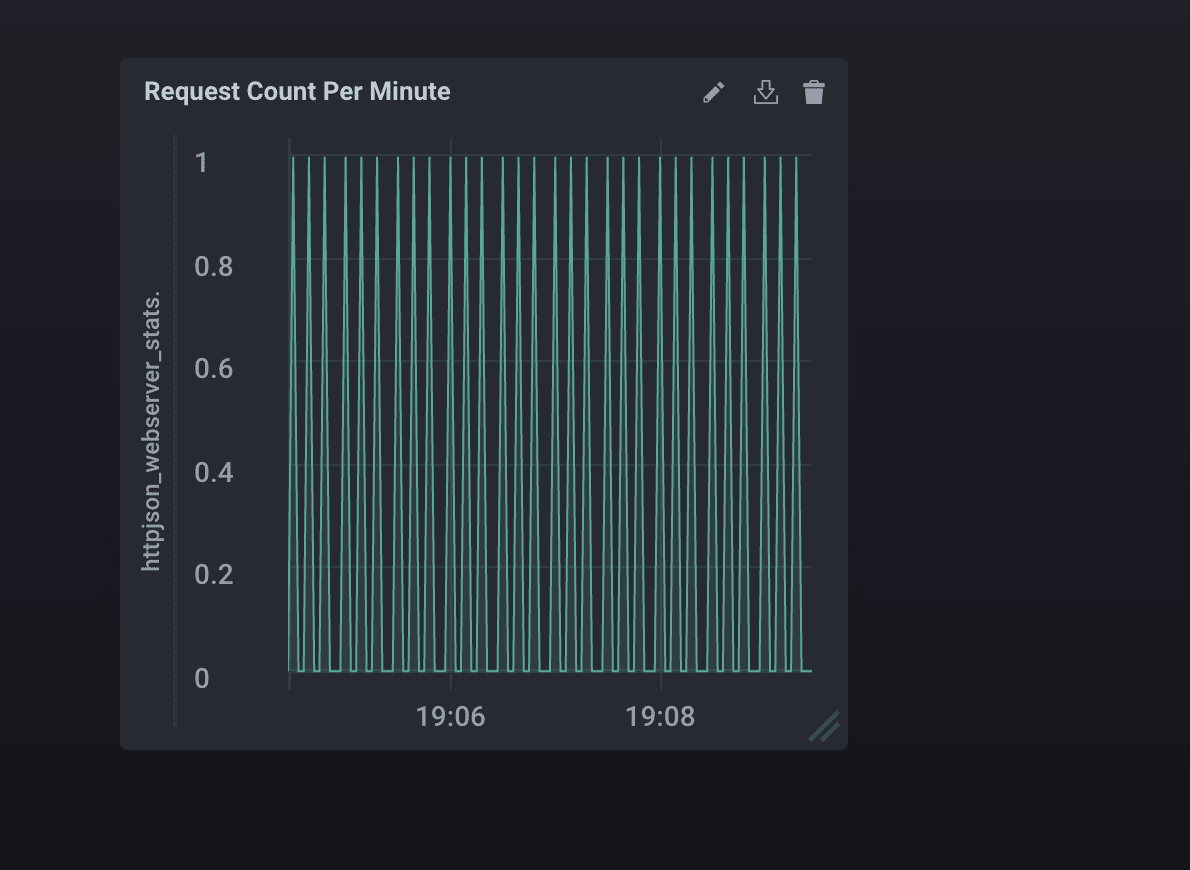 <figcaption> I changed the time window to the last five minutes. IT’S SO BEAUTIFUL.</figcaption>
I’m not crying. You’re crying.
One dance party and several bags of Skittles later, I came down from the high of successfully seeing my stats. My solution felt good during the discovery process, but it’s got some problems. One problem is that it’s only running locally, and production is what really matters for an app like this. And honestly, there are lots of tools available to see site traffic. I want to know how well (or not) my app is performing - this doesn’t do that. Still, these are realizations I could only have after having gone through this exploratory phase with ruby-metrics and Telegraf.
There’s more I want to know: How is the database going to perform when the number of blogs grows and requests happen more often? How will Blogger perform if it’s moved into a container or a virtual environment? Should I monitor the container or the app? Or both? I’m beginning to see how metrics can improve my apps as a whole, and even me as a developer.
For now, I’m going to smooth out Blogger’s kinksmaybe add some CSS. I’m going to move it into production to make sure my pipeline holds up. Then I’m going to try to break the whole thing againand measure its failures and successes.
