Monitoring Air Quality with InfluxDB and Telegraf
By
Anais Dotis-Georgiou
updated October 20, 2023
Product
Navigate to:
This article was originally published in The New Stack and is reposted here with permission.
If you live in the Northern Hemisphere, you’re probably happy to be experiencing summer. However, with summer comes fire season, so it’s important to remember what you can do to reduce the risk of wildfires. If you live in an area susceptible to wildfires, it’s prudent to monitor air quality to protect yourself from the harm of smoke.
Today we’ll use the time series platform InfluxDB to monitor air quality and set up an alert so we can be informed when smoke reaches dangerous levels. Specifically, we’ll use the Air Quality Template to easily get started with InfluxDB.
InfluxDB templates are prepackaged configurations that set up a bunch of resources in the platform. The Air Quality Template includes a dashboard to easily visualize your air quality data and a Telegraf configuration to write air quality data to your InfluxDB instance. Telegraf is an open source collection agent for metrics and events. Our Telegraf configuration will use the http input plugin to write data from AirNow API.
Prerequisites
This post assumes that you have completed the following steps:
- First, get InfluxDB here. I recommend signing up for InfluxDB Cloud because it’s the easiest way to get started with InfluxDB.
- Install the Telegraf agent. Find your preferred download method here.
Install the Air Quality Template
To install the air quality template, navigate to the templates page under settings, which is found on the left navigation bar.

Copy and paste the following URL and click Lookup Template:
https://github.com/influxdata/community-templates/blob/master/airquality/airquality.yml
Next, click Install Template to add all the associated resources.

Setting up AirNow
As per the instructions in the Readme, first, go to https://docs.airnowapi.org/account/request/ to request account access for AirNow AP. Next, go to https://docs.airnowapi.org/forecastsbyzip/query, and build your URL as follows:
- Enter the ZIP code of interest.
- Select application/json from the Format dropdown.
- Click Build.
- Copy the URL string.
- Edit the URL string by removing the date (e.g. “&date=2022-06-14”).

Copy the generated URL from AirNow and remove “&date=2022-06-14” before adding it to your Telegraf configuration file.
Your URL should look like this after you’ve removed the date.
Setting up Telegraf
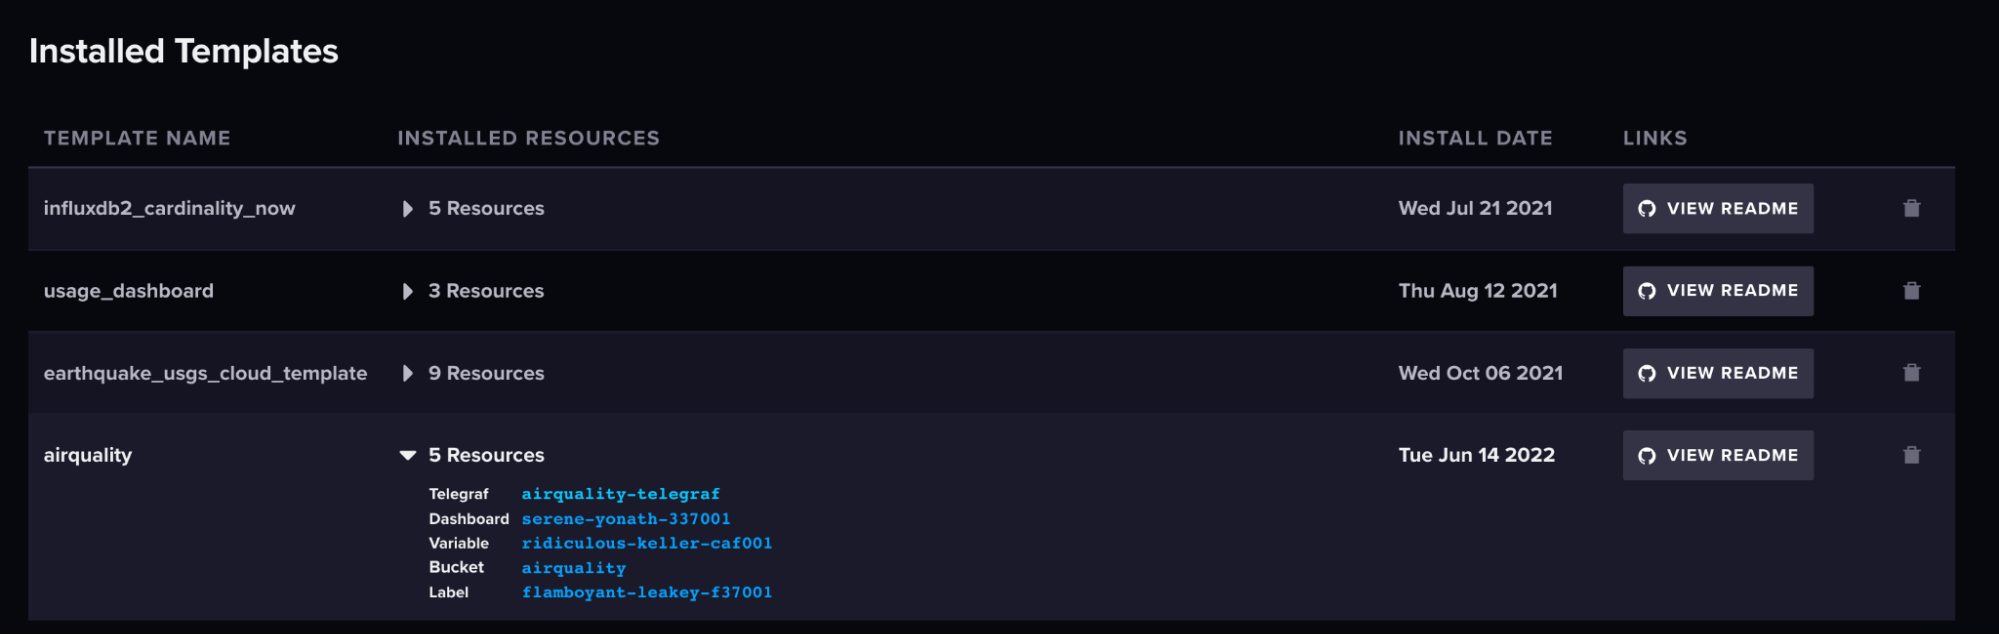
Next, you need to edit the Telegraf configuration file. You can easily navigate to the right Telegraf configuration file by clicking on airquality template after installing it, expanding the resources dropdown, and clicking on the airquality-telegraf config.
That takes you to the Load Data page. Here you can click on the configuration name to edit it.

Now we can paste our edited AirNow URL into line 17 and click Save Changes.
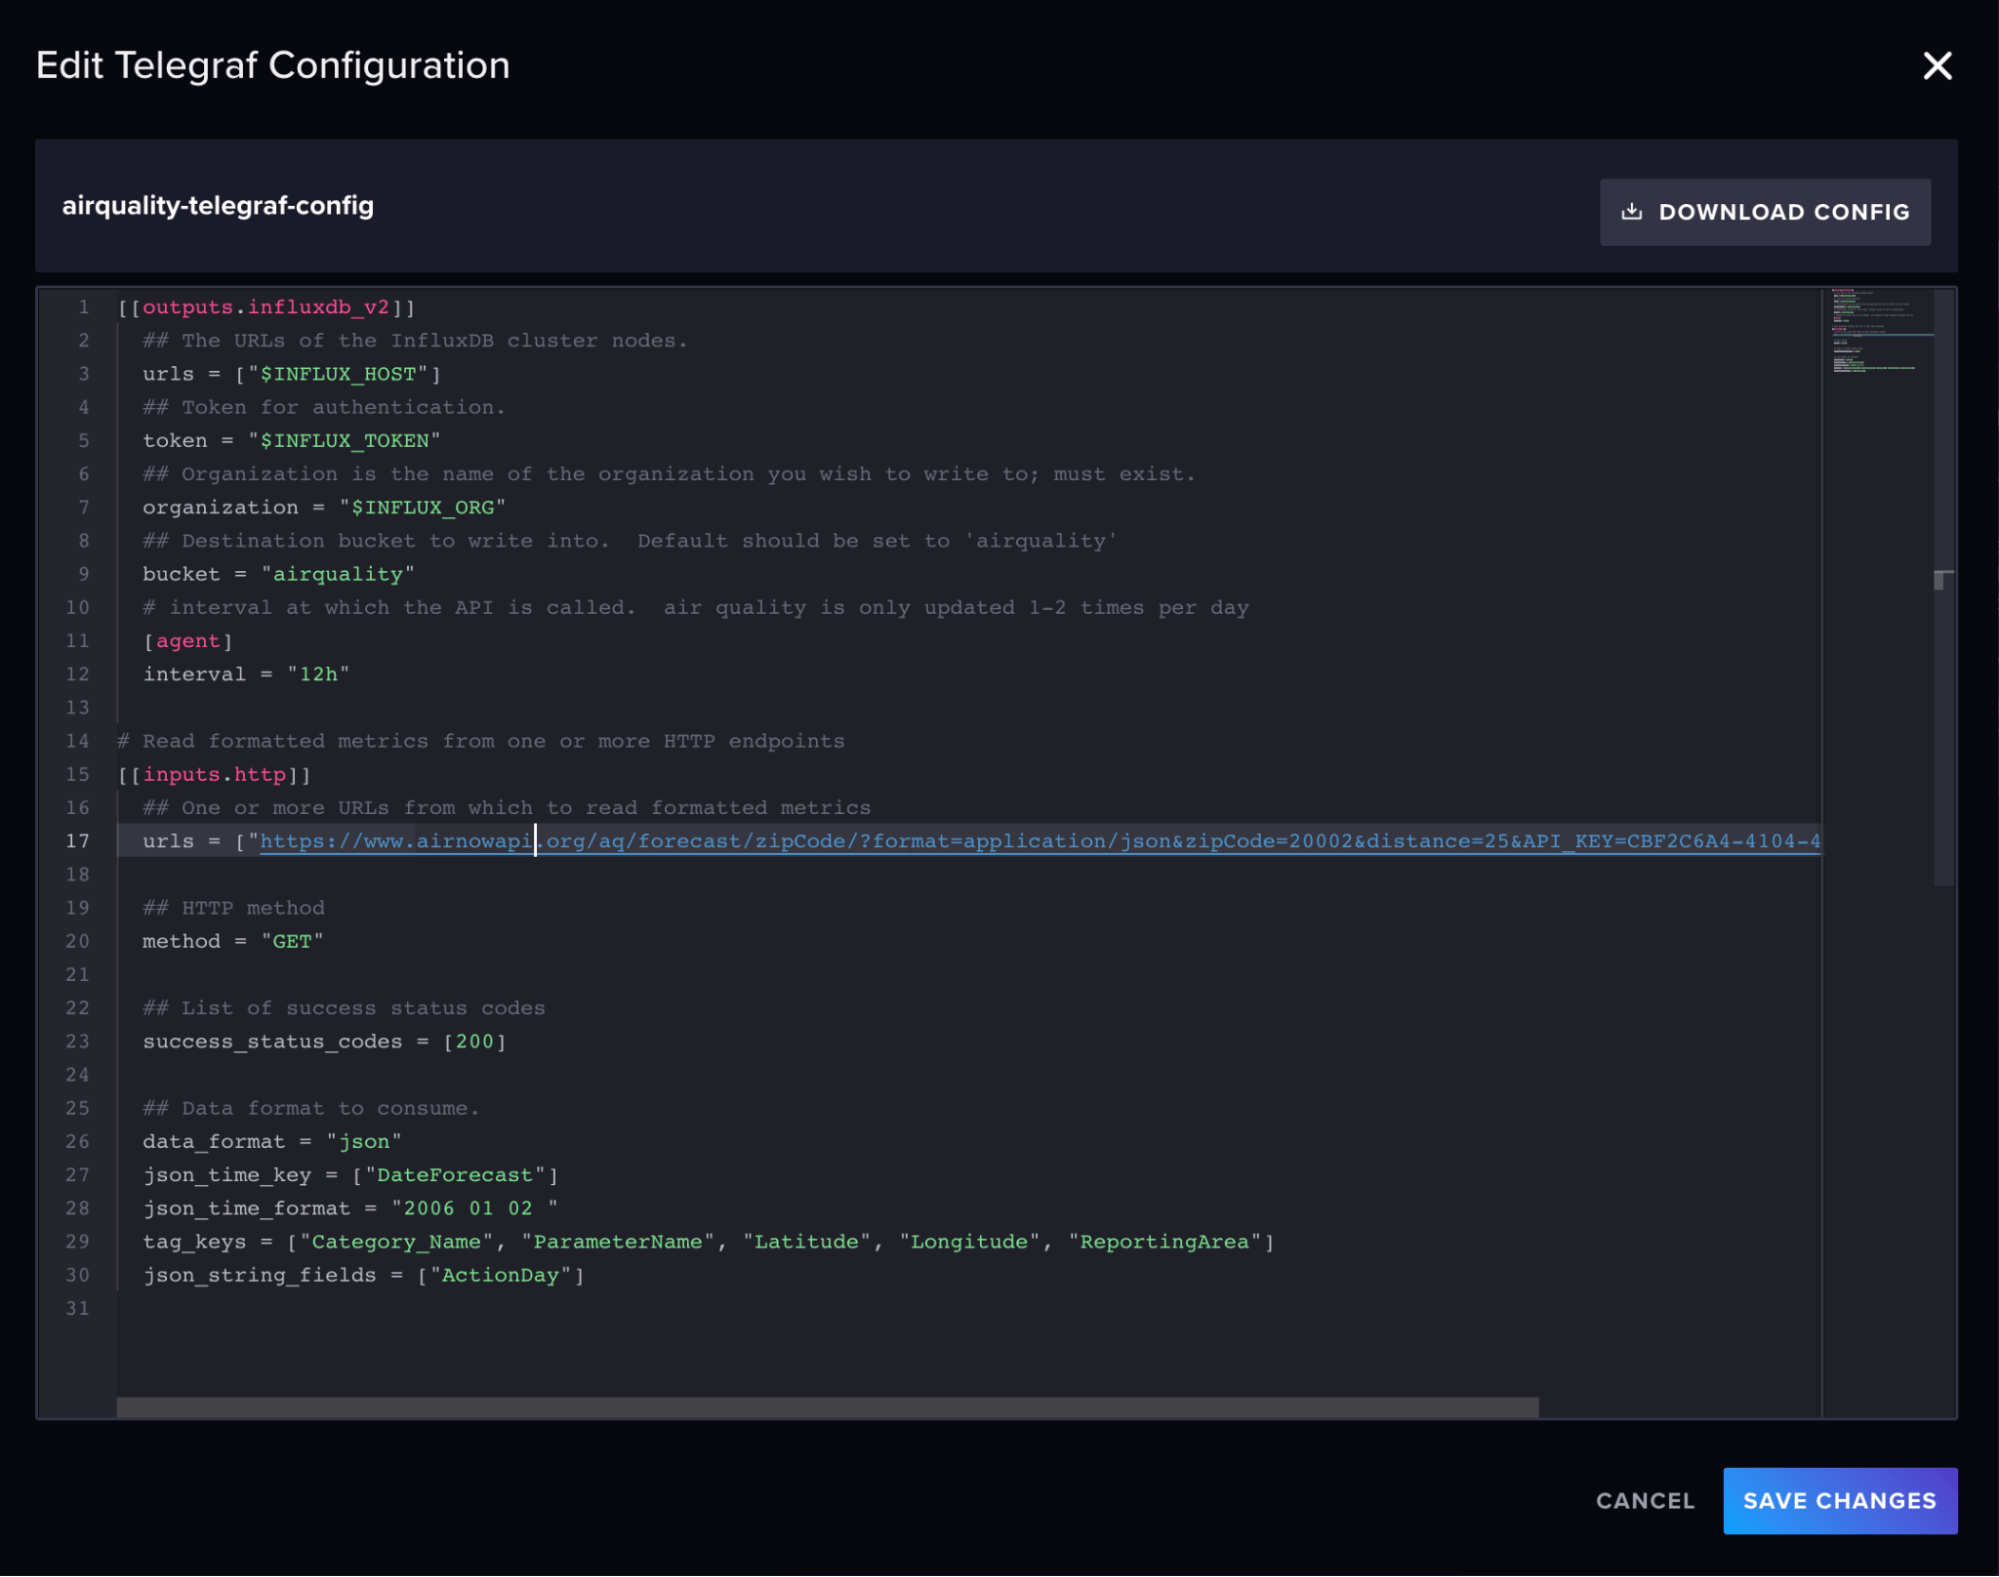
Now click Setup Instructions (next to the configuration name) to run our Telegraf agent with this configuration and write air quality metrics to InfluxDB.
Air Quality Dashboard
The Air Quality Dashboard is another resource that’s included with the Air Quality Template.
Let Telegraf run for a little while, and then visit the prebuilt dashboard, under the dashboard page. Navigate to the dashboard page from the left-hand navigation bar. Make sure to select the appropriate bucket, airquality, that we want to create the visualizations from. It includes two gauge visualizations:
- Current PM2.5: This gauge displays the most recent fine particulate matter (PM2.5) levels.
- Current Ozone Quality: This gauge displays the most recent ozone levels.
The graph displays the air quality index (AQI) separated by severity levels.

Adding an alert to the Air Quality Template
We can easily add an alert to the Air Quality Template to be notified when the AQI reaches dangerous levels. You can use InfluxDB to send alerts to a variety of different endpoints including Slack. Navigate to the Alerts page and click + Create to create a new check. Next, query for your data with the Query Builder. Set an interval to determine how often you want to check your data to see if it has exceeded a threshold. Finally, set up your notification endpoint. To learn about how to configure your Slack notification endpoint, follow this post.
An example of how to set up a threshold check to get notified on unsafe AQI with the InfluxDB UI.

Final thoughts
I hope this post inspires you to take advantage of InfluxDB to stay healthy this summer. I also encourage you to take a look at the Enviro+ Raspberry Pi air quality template to build your own air quality sensors.
