Monitoring Telegraf Plugins in Your Architecture
By
Chris Churilo
updated December 14, 2025
Product
Use Cases
Developer
Navigate to:
Monitoring Telegraf — the open source, plugin-driven server agent for collecting metrics from stacks, sensors and systems — is important because it allows you to track the health of Telegraf plugins in your stack. It’s for this purpose that the Telegraf Monitoring Template was developed. Before introducing the template, it’s helpful to recall how Telegraf works.
Telegraf in a nutshell
In case you’re not familiar with Telegraf or can benefit from a refresher, Telegraf is a great choice for metrics collection because it’s written entirely in Go; compiles into a single binary with no external dependencies; has a minimal memory footprint; and has 200+ plugins written by subject matter experts in the community.
Telegraf has plugins to source a variety of metrics directly from the system it’s running on, pull metrics from third party APIs, or even listen for metrics via statsd and Kafka consumer services. It also has output plugins to send metrics to other datastores, services and message queues, including InfluxDB, Graphite, OpenTSDB, Datadog, Librato, Kafka, MQTT, NSQ and others.
The template's Telegraf monitoring dashboard
The Telegraf Monitoring Template is an InfluxDB template that has a premade dashboard. Below is the template’s dashboard.
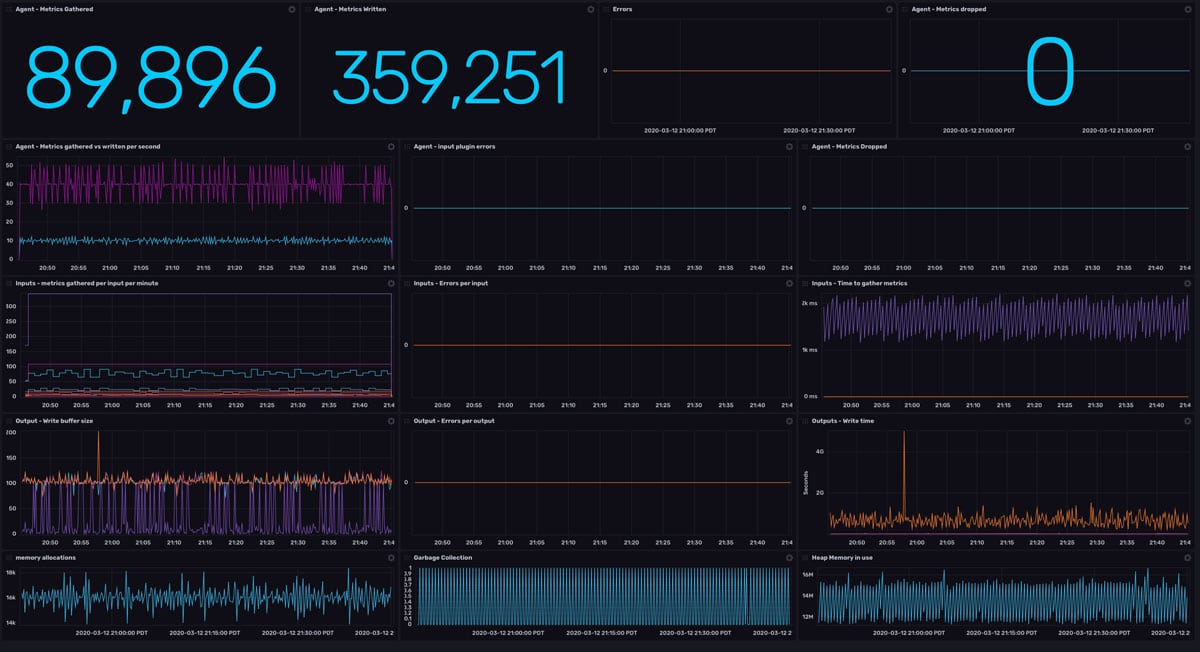
The dashboard shows metrics collected, graph errors, and throughput rates for inputs, outputs, and time spent collecting and writing metrics. See the list of Telegraf monitoring metrics you can proactively track using the template.
Advantage of using the Telegraf Monitoring Template
Since Telegraf is InfluxDB’s native metrics collection agent, it’s much easier to use the Telegraf Monitoring Template an InfluxDB template to monitor Telegraf than to use other monitoring solutions or to build a monitoring solution from scratch.
Using this template, like other InfluxDB Templates, is easy:
- Once your InfluxDB credentials have been properly configured in the CLI, you can install the Telegraf Monitoring Template using the Quick Install command.
- Once installed, the data for the dashboard will be populated by the included Telegraf configuration, which includes the relevant Telegraf Input.
Depending on how your organization is running Telegraf, you might need to customize the input configuration to better serve your needs.
To install this template, sign up for your free InfluxDB Cloud account.
Get started with InfluxDB Templates today
The InfluxDB community templates repository is home to a growing number of InfluxDB templates. InfluxDB Templates let you quickly define your entire monitoring configuration (data sources, dashboards, and alerts) for any technology in one easily-shared, open-source text file that can be imported into InfluxDB with a single command.
To use an InfluxDB template, apply community templates directly from GitHub using a template’s download URL or download the template. See How to use a Template for detailed instructions on how to load a template. The InfluxData Docs website also shows how to view, validate and apply templates. Interested in submitting your own InfluxDB Template? Learn how to build one.
