Table of Contents
As business-critical applications increasingly rely on network services, even a minor change in network usage can impact network performance and reliability, thereby also impacting business functions and network maintenance costs. sFlow (short for “sampled flow”) by providing unprecedented visibility into network usage and active routes of high-speed and complex networks delivers the data needed to effectively control and manage network usage. Here’s why, and how, sFlow monitoring provides network usage visibility.
sFlow monitoring to provide a deeper look
Like NetFlow, sFlow is an industry standard used for network monitoring. It defines a packet sampling (not all traffic) technology to provide continuous statistics on any protocol (L2, L3, L4, and up to L7). As it uses sampling, it can scale to high-speed networks. It is supported by multiple network device manufacturers and network management software vendors. Essentially, it’s a tool used to analyze and manage network traffic, to help guarantee quality of service.
sFlow monitoring allows you to take a deeper look at network traffic patterns in an easy-to-visualize, easy-to- understand way. Applications of sFlow data include fixing network problems, real-time congestion management and capacity planning. sFlow monitoring samples network packets to help accomplish important tasks like:
- Finding bandwidth hogs on a network
- Detecting, diagnosing and resolving network performance issues.
- Tracking response time, availability and uptime of critical assets
- Monitoring and analyzing network bandwidth performance and traffic patterns
sFlow monitoring using InfluxDB
The sFlow Monitoring Template can be used to monitor traffic from sFlow sources. It is an InfluxDB Template that lets you quickly define your entire monitoring configuration (data sources, dashboards, and alerts) for any technology in one easily-shared, open-source text file that can be imported into InfluxDB with a single command.
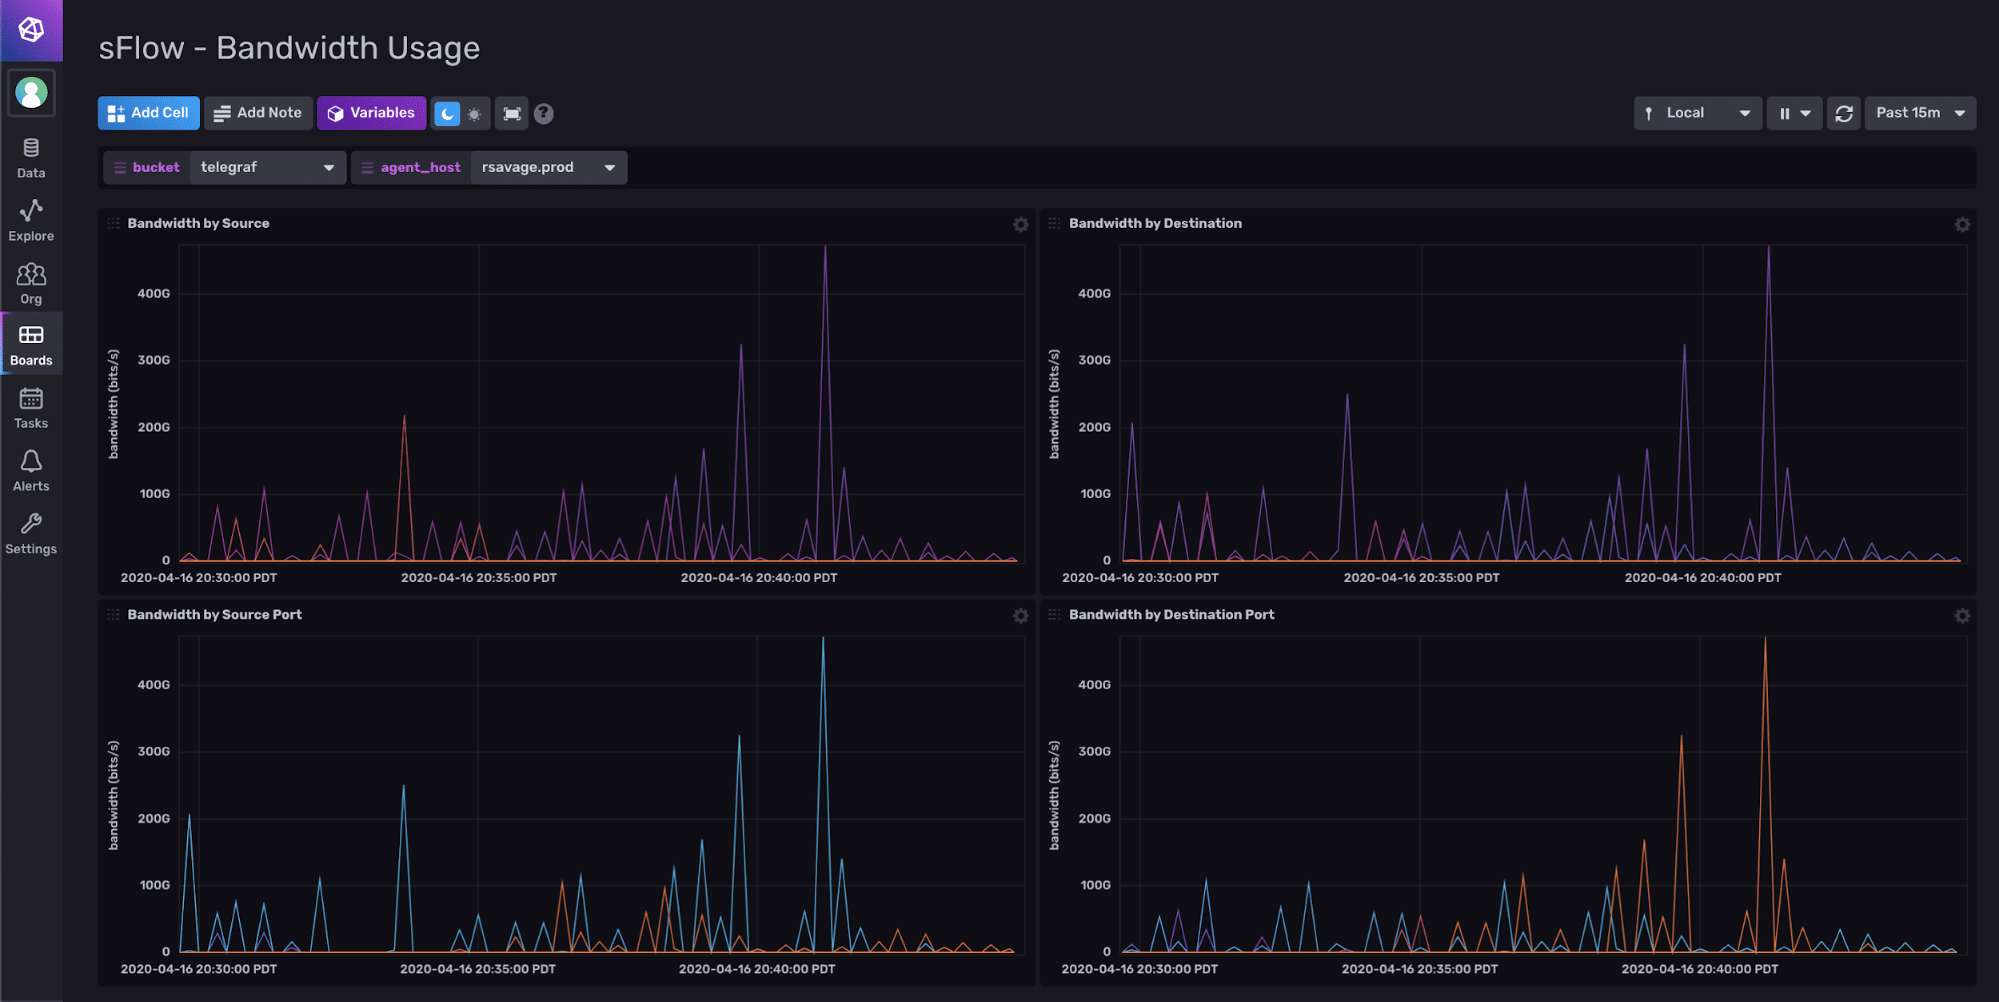
The sFlow Monitoring Template allows you to zoom in on and track key performance-related metrics as shown below such as bandwidth by source, by destination, by source port and by destination port.
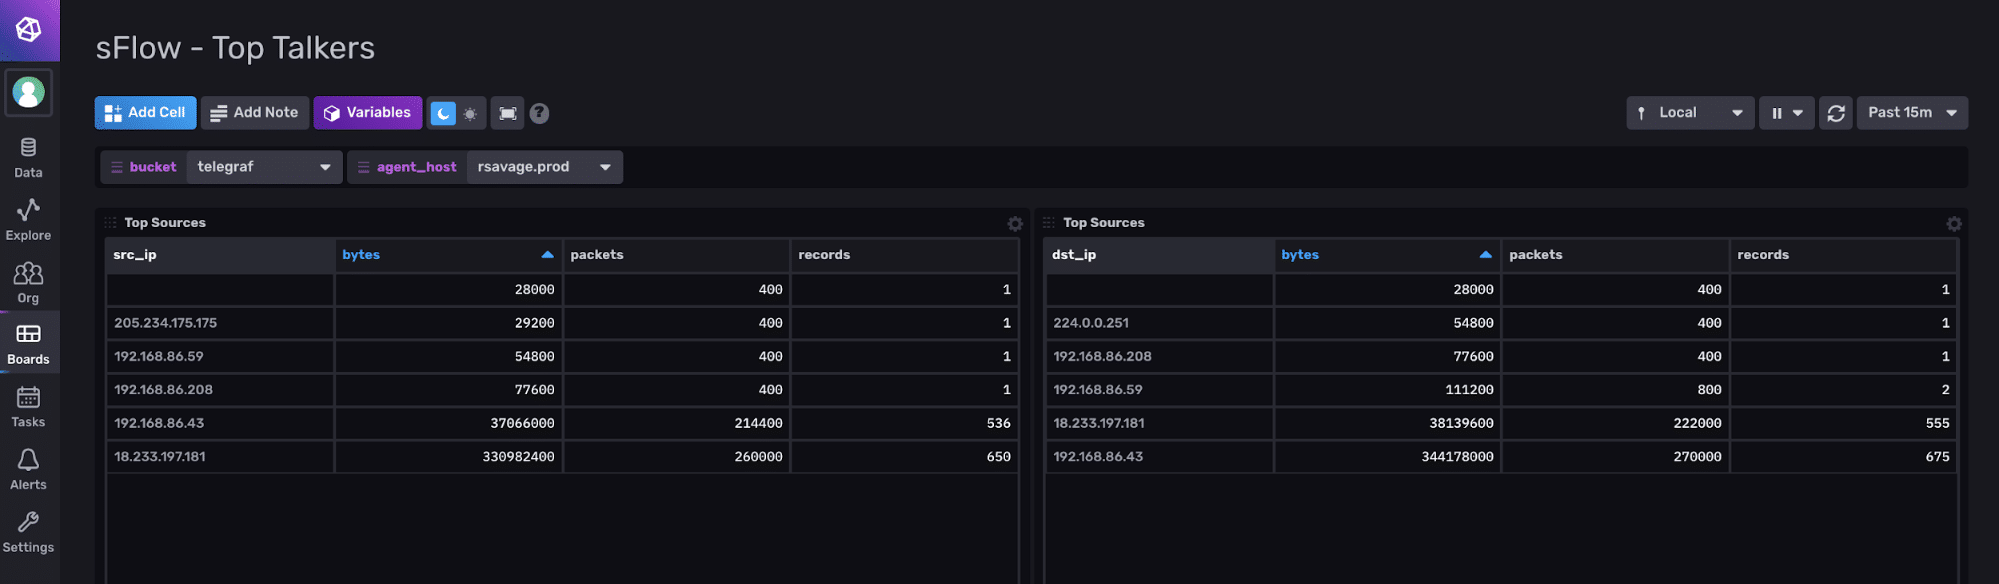
The sFlow Monitoring Template also gives you better visibility into your “top talkers” in sFlow (as shown in the dashboard below), sorting things based on factors like bytes, packets and records. All of these “top talkers” are listed by their IP address so that you can easily tell one from another.
To install this template, sign up for your free InfluxDB Cloud account.
Additionally, the InfluxDB Template Gallery offers other network monitoring templates such as the Network Interface Performance Template and SNMP Network Monitoring Template. And if you’re interested in submitting your own InfluxDB Template, here’s where you can learn how to build one. Most InfluxDB templates have been contributed by the community, and yours can be next.
