The NVIDIA Jetson Series - Part 1 (Jetson-Stats)
By
Jay Clifford
updated December 14, 2025
Product
Use Cases
Developer
Navigate to:
NVIDIA if you’re an avid PC gamer like me then the name should be familiar to you. NVIDIA is a world leader in designing and producing graphical processing units (GPU’s). In recent years, NVIDIA has moved into the Vision AI space in a big way, releasing embedded starter boards called the Jetson series.
Through this blog post series, we will create our own Vision AI pipeline and utilize Telegraf and InfluxDB to ingest, store and monitor both our Jetson hardware and the Vision AI Pipeline.
Monitoring the Jetson (planning)
Before we build our vision pipeline, let’s begin by monitoring our Jetson device.
Why?
When working with embedded systems such as the Jetson family, resources are scarce. Through monitoring hardware thermals, GPU utilization and power consumption we can assess how much strain our Vision AI pipeline is placing on the device.
As you may already know, Telegraf comes ready to go with the NVIDIA SMI (System Management Interface) plugin. This is great for monitoring your standard discrete GPU, but unfortunately, SMI is unavailable to Jetson devices.
What does this mean?
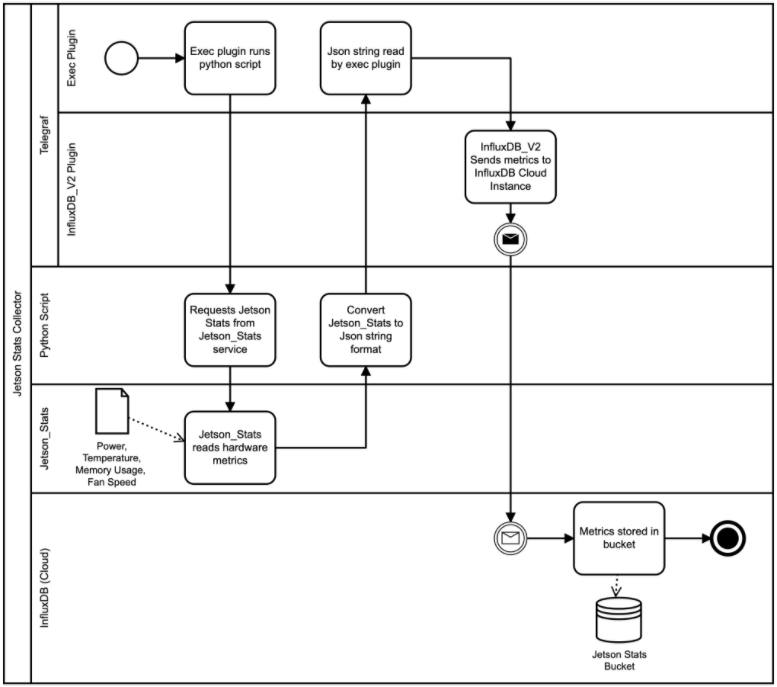
It means we have to get a little creative. When building any software architecture, I personally like to use Business Process Model and Notation (BPMN) to convey my ideas.
Let's build it
If you would like to skip ahead, I have left my code here. I will be using InfluxDB cloud for this tutorial. This tutorial is also compatible with InfluxDB OSS.
Let’s start by downloading and installing the required prerequisites:
- Jetson Stats:
$ sudo apt-get update
$ sudo apt-get install python3-pip
$ sudo -H python3 -m pip install -U jetson-stats
Note: I chose to install the Jetson-Stats library using Python3 as I prefer to work in 3.X. You may also choose to install Jetson-Stats using Python 2.X as well.
- Telegraf:
$ sudo apt-get install wget
$ wget -qO- https://repos.influxdata.com/influxdb.key | sudo apt-key add -
$ source /etc/lsb-release
$ echo "deb https://repos.influxdata.com/${DISTRIB_ID,,} ${DISTRIB_CODENAME} stable" | sudo tee /etc/apt/sources.list.d/influxdb.list
$ sudo apt-get update && sudo apt-get install telegraf
Note: Telegraf is now installed as a service on your Jetson device. It also generates its own service user (this will be important later). For now, we will not start the service.
Exec Plugin & Python script
As shown within our BPMN, we will use the Telegraf Exec Input Plugin to trigger a Python script. Let’s start by writing our Python script:
# Import jtop python library. We will use this to access the Jetson_Stats service.
from jtop import jtop
import json, datetime

if __name__ == "__main__":

    with jtop() as jetson:
            # jetson.stats provides our system measurements as type dict.
            tmp = jetson.stats
            # time and uptime are proved as time objects. These needed to be converted before passing as a JSON string,
            tmp["time"] = str(tmp["time"].strftime('%m/%d/%Y'))
            tmp["uptime"] = str(tmp["uptime"])
            # We then convert our dict -> Json string
            influx_json= {"jetson": tmp}
            print(json.dumps(influx_json))
As you can see, our Python script is quite trivial. We essentially:
- Open an instance of jtop (Jetson Stats) to read from. This returns a Python dictionary structure.
- Convert the fields time and uptime into string values. This allows us to make the dictionary parseable as a JSON structure.
- Convert to JSON string and print to stdout.
If we run the script manually, you will see a similar output to this:
{"jetson": {"time": "09/21/2021", "uptime": "6:01:06.430000", "jetson_clocks": "OFF", "nvp model": "MAXN", "CPU1": 28, "CPU2": 20, "CPU3": 14, "CPU4": 14, "GPU": 0, "RAM": 2164788, "EMC": 2164788, "IRAM": 2164788, "SWAP": 1, "APE": 25, "NVENC": "OFF", "NVDEC": "OFF", "NVJPG": "OFF", "fan": 0.0, "Temp AO": 35.5, "Temp CPU": 26.0, "Temp GPU": 24.5, "Temp PLL": 25.5, "Temp thermal": 25.0, "power cur": 1442, "power avg": 1777}}Next we will configure the Exec Plugin to run this script periodically and ingest the JSON String:
Note: I will only cover the Exec Plugin config (Full Telegraf.conf here).
[[inputs.exec]]
  ## Commands array
  commands = [
    "python3 /usr/local/bin/jetson_stats.py"
  ]

  ## Timeout for each command to complete.
  timeout = "5s"

  ## measurement name suffix (for separating different commands)
  name_suffix = "_jetson_stats"

  ## Data format to consume.
  ## Each data format has its own unique set of configuration options, read
  ## more about them here:
  ## https://github.com/influxdata/telegraf/blob/master/docs/DATA_FORMATS_INPUT.md
  data_format = "json"
  ## Array of glob pattern strings or booleans keys that should be added as string fields.
  json_string_fields = ["jetson_uptime", "jetson_nvp model", "jetson_NVENC",  "jetson_NVDEC",  "jetson_NVJPG"]
Within this plugin we define the following:
- Command: A terminal command for the Telegraf user to run. In this case, we call our Python script. Note: I moved my python script into /usr/local/bin
- Timeout: Default timeout is fine.
- Name_suffix: This allows us to append a descriptive name to our measurement (which defaults as Exec in InfluxDB).
- Data_format: In this case, I used our original JSON data format type. This is purely a personal choice due to the simplicity of the JSON structure.
- Json_string_fields: Lastly since some of our data points are type string, we must explicitly define these. Otherwise, they will be discarded when forming our measurement.
We have one more step to take before our Exec plugin can run our Python script. Since Jetson_Stats runs with elevated privileges, we must grant our Telegraf user access to its permissions group:
$ sudo sudo usermod -aG jetson_stats telegraf
InfluxDB Cloud
Note: This part of the tutorial assumes that you have already set up a free InfluxDB Cloud account. You can do this here.
Now that you have a free InfluxDB Cloud account, let’s load a template. A template provides a blueprint for building InfluxDB assets such as Buckets and Dashboards. If you would like more information about templates, check out this great blog post:
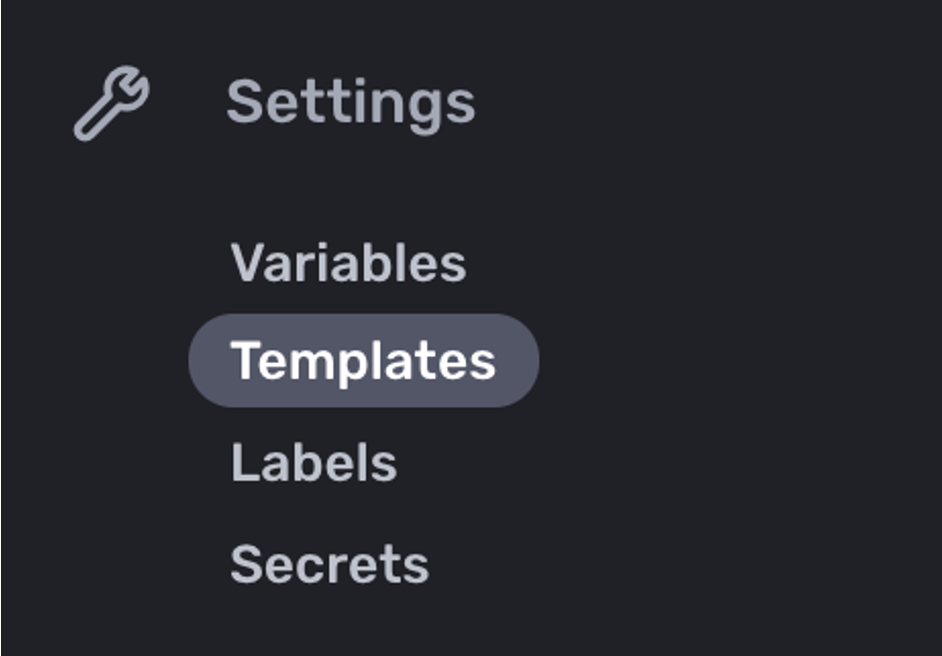
- Select Templates in the settings section of the navigation bar.
- Copy and paste my Jetson InfluxDB Template into the URL field: https://github.com/Jayclifford345/demo_telegraf_jetson_stats/blob/master/Jetson-InfluxDB-Template.yml
- Select Lookup Template.
- Select Install Template.

This autocreates the Bucket “Jetson” and the Dashboard “Jetson Stats”. We are now ready to stream our Jetson data to InfluxDB Cloud.
InfluxDB_v2 Plugin
We will now configure Telegraf to output our Jetson Stats metrics to the cloud:
[[outputs.influxdb_v2]]
  ## The URLs of the InfluxDB cluster nodes.
  ##
  ## Multiple URLs can be specified for a single cluster, only ONE of the
  ## urls will be written to each interval.
  ##   ex: urls = ["https://us-west-2-1.aws.cloud2.influxdata.com"]
  urls = ["https://us-east-1-1.aws.cloud2.influxdata.com/"]

  ## Token for authentication.
  token = "<INSERT_TOKEN>"

  ## Organization is the name of the organization you wish to write to.
  organization = "<CLOUD_ORG>"

  ## Destination bucket to write into.
  bucket = "Jetson"
Within this plugin, we define the following:
- Urls: Since we are using a cloud instance, this url will be dependent on where you decided to host your instance. My instance is hosted in AWS.
- Token: To create a token for your Jetson bucket, consult the documentation found here.
- Organization: This will be the email address you signed up to InfluxDB Cloud with.
- Bucket: Leave this as Jetson. Unless you plan to store your Jetson data in a different bucket.
Lastly, we can start our Telegraf instance:
$ sudo systemctl start telegraf
$ sudo systemctl enable telegraf
The end of part 1
You can now view your Jetson Stats using the precreated dashboard:
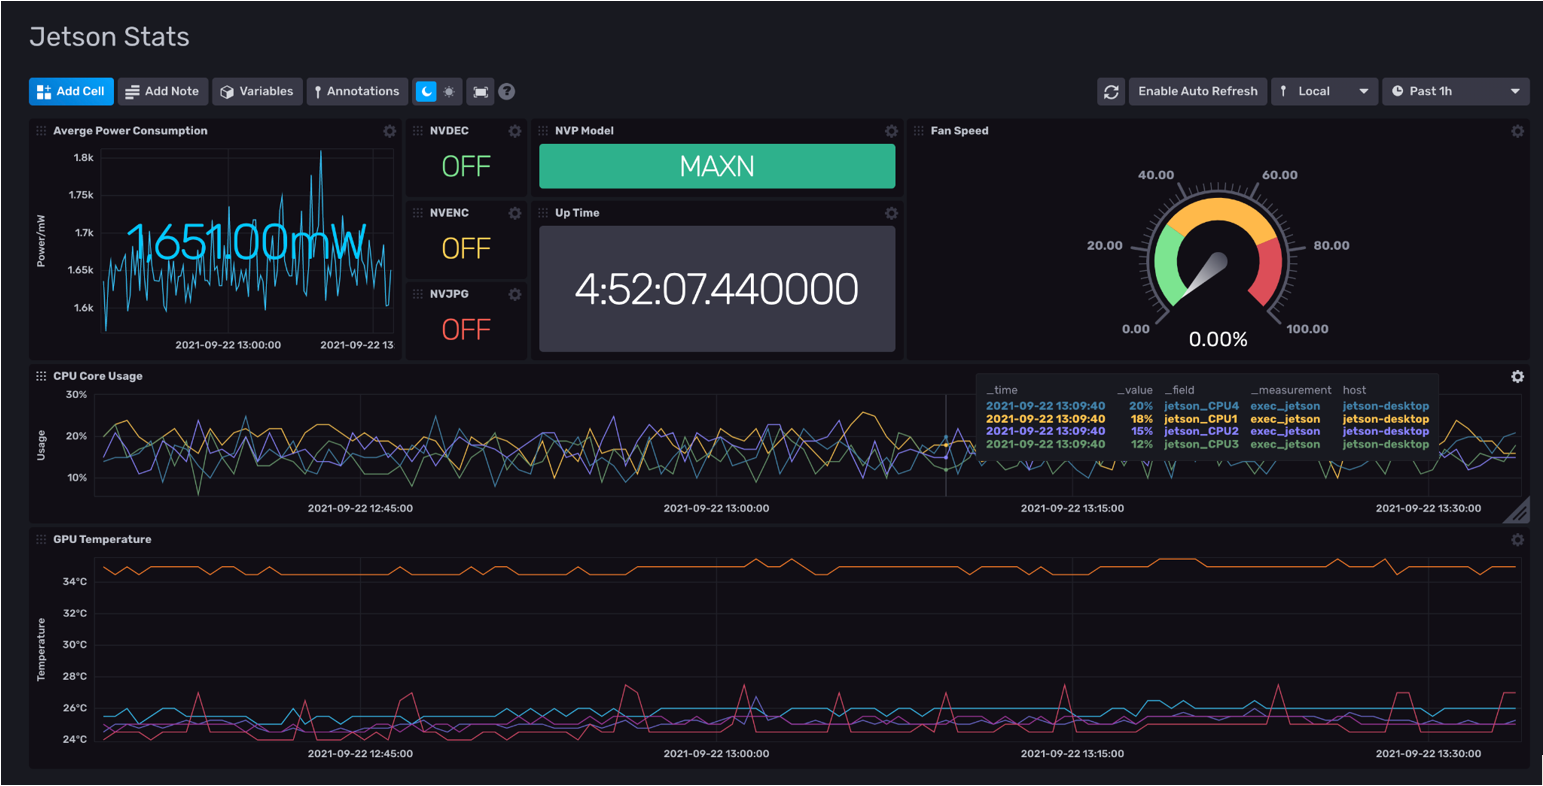
Here’s what we achieved in Part 1 of this series:
- Monitor core system metrics of a NVIDIA Jetson device using Jetson Stats
- Configure Telegraf to ingest and send these metrics to InfluxDB Cloud
- Use the Jetson InfluxDB Template to preconfigure our InfluxDB instance with the correct bucket and dashboard for the data.
You might be asking yourself: This is great, but so what? All will be revealed in Parts 2 and 3 of this series where we will build and test our Vision AI pipeline.
Once you get up and running, reach out to me on the InfluxData Slack and Community forums (just make sure to tag me @Jay Clifford). Let me know:
- If you are currently working on a vision solution and are either using or would like to use Telegraf and/or InfluxDB. This could be a great project to work on together!
- If you get stuck at any part during the tutorial.
- Any comments or suggestions. My repo can be found here, and I'm always happy to look at any pull requests.
