Plant Buddy Part 4: Using the UI
By
Barbara Nelson
updated December 14, 2025
Use Cases
Product
Developer
Navigate to:
My colleague, Rick Spencer, has been working on an interesting IoT project, Plant Buddy. This project entailed soldering some sensors to an Arduino, and teaching that device how to communicate directly with InfluxDB Cloud so that he could monitor his plants. Then he developed an app that allows users to visualize and create alerts from their uploaded Plant Buddy device data in a custom user experience.
To understand more about Rick’s project, you can check out Part 1, where he designed the basics of the device and taught it to communicate and add some notifications; Part 2, where he added downsampling and a dashboard; and Part 3, where he built an app for plantbuddy.com.
When I was reading Rick’s blog, I was impressed with how powerful our CLI is, making it easy for Rick to create a bucket, generate a token, write data, query the data, and set up checks and notifications. For someone who is familiar with working at the command line, it’s pretty intuitive. But as the head of the UI team, I wanted to see what the experience would be for someone who wanted to use the UI, not the CLI for the same functionality. So, below is a companion blog to Part 3, using the UI instead of the CLI for those of us who are more UI-centric.
Many thanks to Rick Spencer for doing the work to build a very cool IoT application to manage his growing garden (and keeping an eye on my plants too).
Bootstrapping IoT application development for InfluxDB Cloud
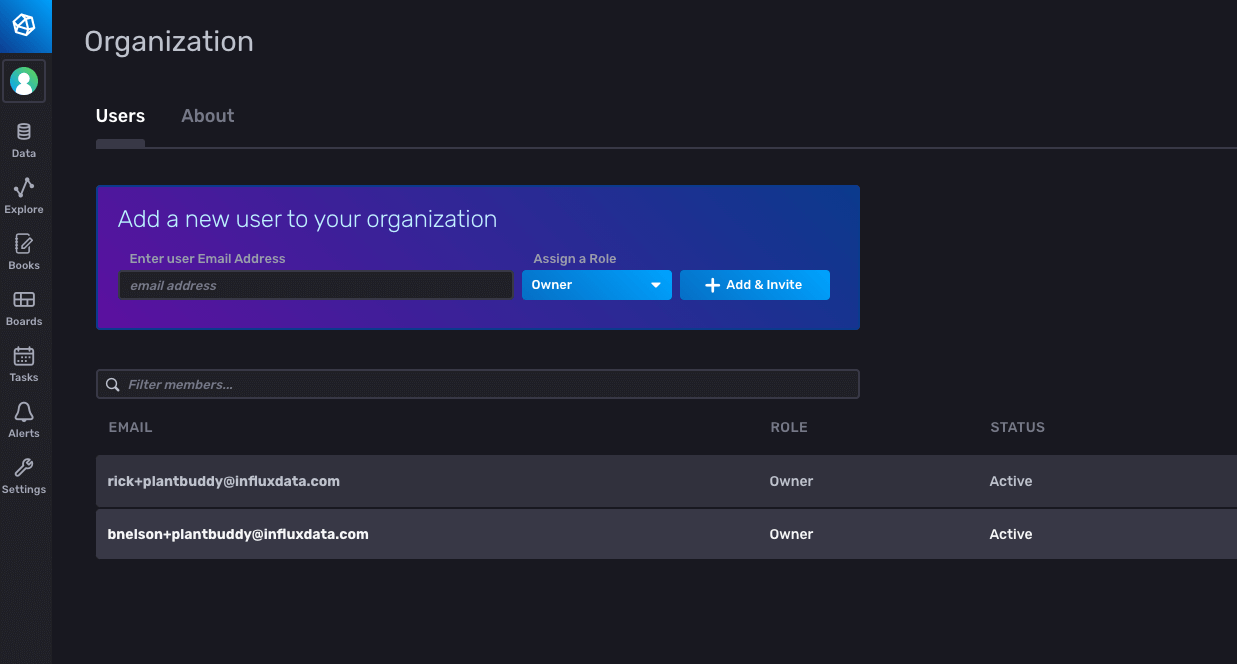
Rick has already created an InfluxDB Cloud Account, so I asked him to invite me to his account so that we could work with the same data. Once I accepted the invitation, I was all set, and I was able to log into his account. As I need a different email address for each InfluxDB Cloud Account that I want to access, I am using [email protected] for this example.
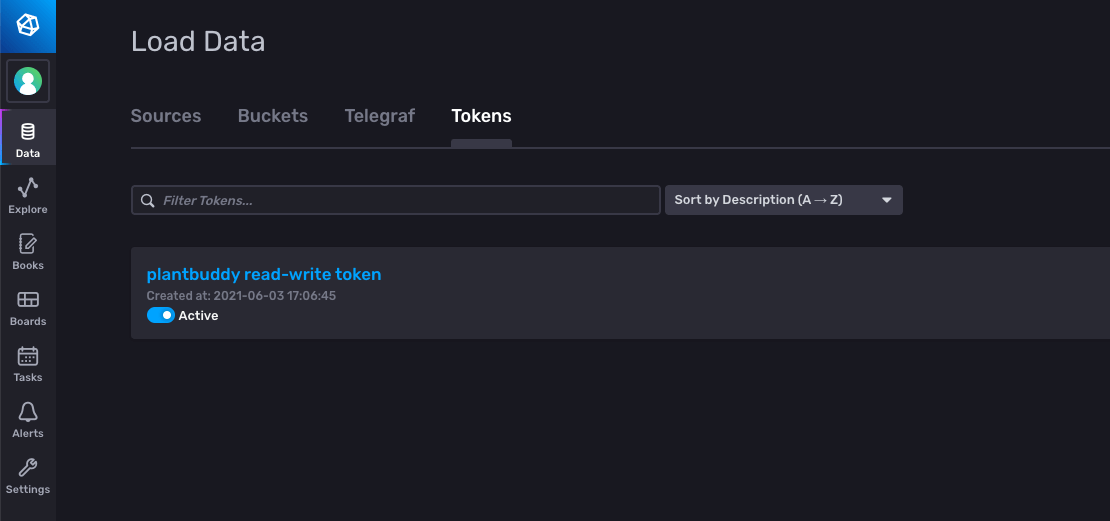
I will need a token to be able to write my data into this account. Rick already has a token, but I need one for my use as tokens are specific to each user. Rick has created a bucket, plantbuddy, so I need a read/write token to be able to write my data to his bucket. Just like Rick did, I navigate in the UI to Data -> Tokens to generate my token.
I click Generate Token and choose a Read-Write Token for the plantbuddy bucket, and provide it a name, plantbuddy read-write token.
Upload some Line Protocol
Now that I have access to the bucket, I can upload some data to it so that I can start testing right away. Rick gave me a Python script that I could use, so I set the user field to barbara and the device_id to 02, so my metrics could be filtered from Rick’s metrics. I copied the read/write token that I had just generated to my client environment, and ran my Python script to generate and upload some test data.
The line protocol format is well-documented. Here is an excerpt of what my data looked like:
soil_moisture,user=barbara,device_id=02 reading=157i 1623622366752460032
humidity,user=barbara,device_id=02 reading=69i 1623622366752460032
soil_temp,user=barbara,device_id=02 reading=66i 1623622366752460032
light,user=barbara,device_id=02 reading=36i 1623622426752460032
soil_moisture,user=barbara,device_id=02 reading=153i 1623622426752460032
humidity,user=barbara,device_id=02 reading=68i 1623622426752460032
soil_temp,user=barbara,device_id=02 reading=67i 1623622426752460032
I used the write endpoint to write my data from a Python script. I could have used the UI to upload my data, but given that I was using a Python script to generate the test data, it was just as easy to call the write endpoint directly, rather than writing my data to a file and then uploading the file via the UI.
No error was reported, so it looks like it worked, so then I ran a query to make sure.
Run a query
The Data Explorer lets me easily confirm that my data is in the plantbuddy bucket.
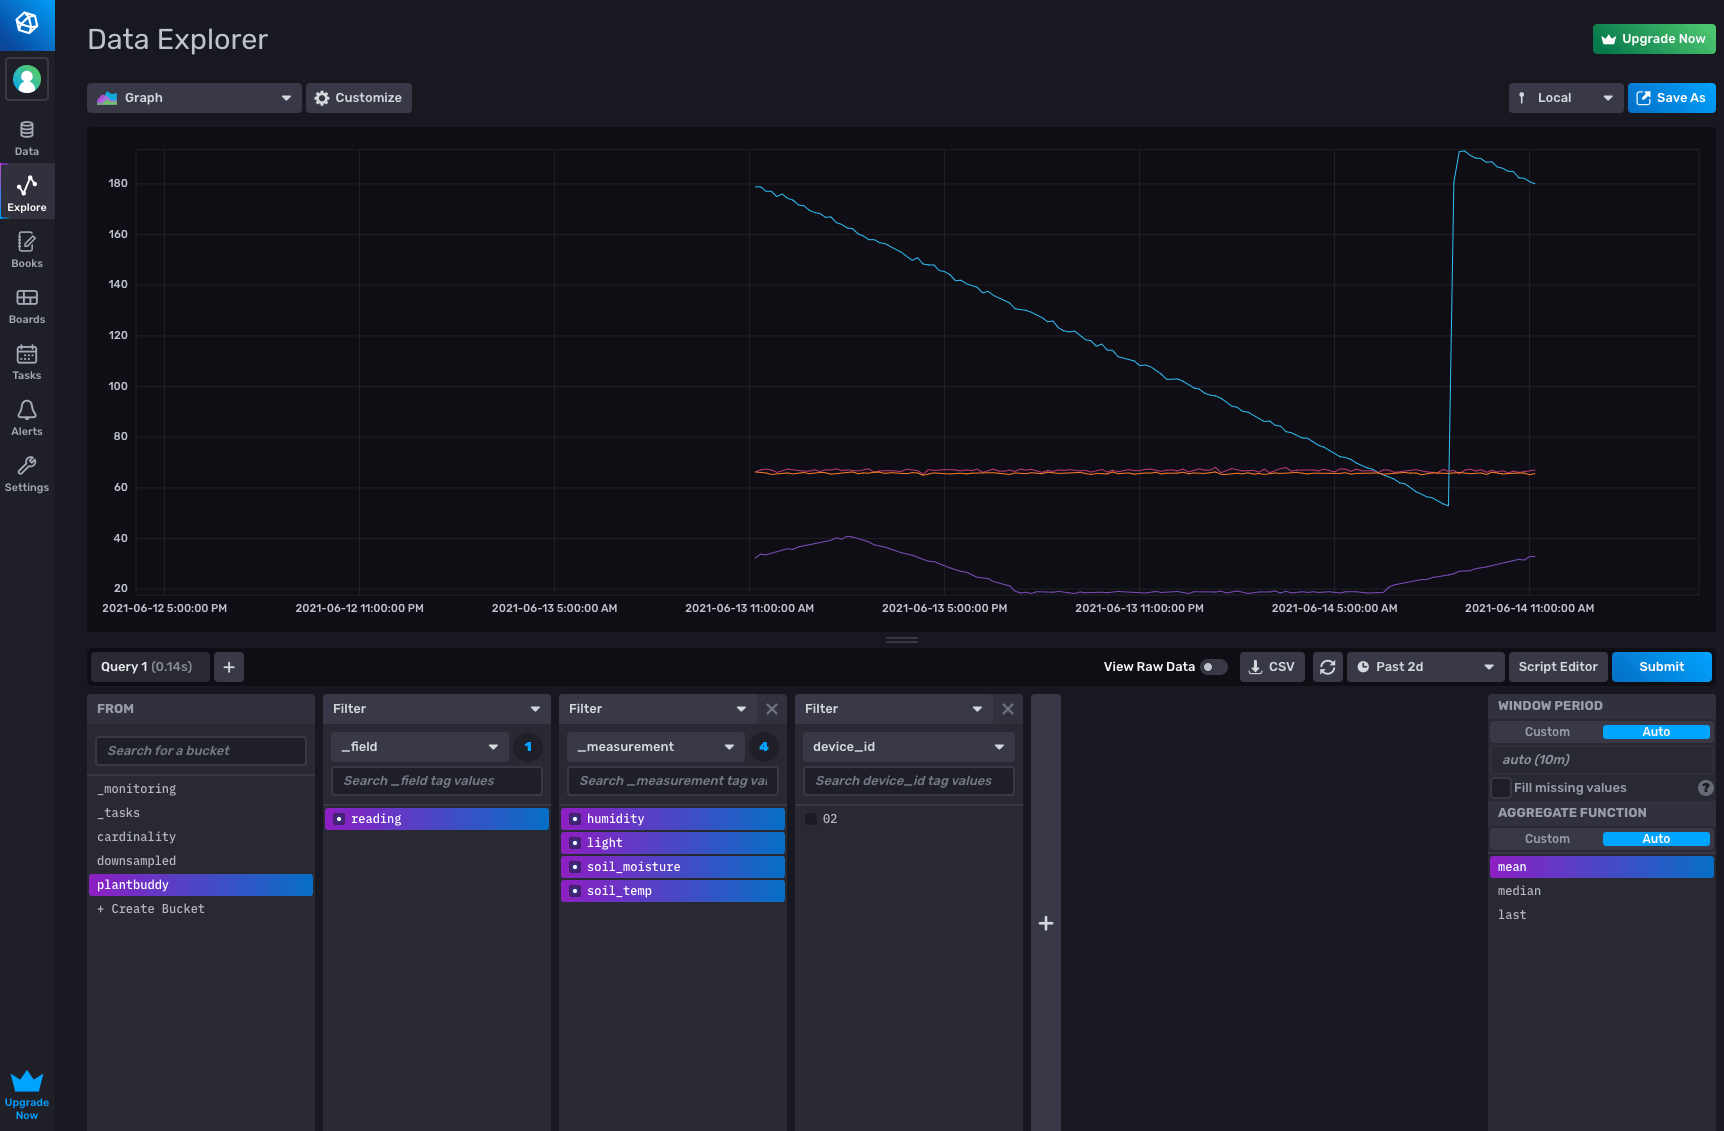
Alternatively, I can use the metrics selector in the notebooks UI to see what metrics are in the bucket. I confirmed that my data is there, ready to be analyzed and acted-upon.

Downsampling
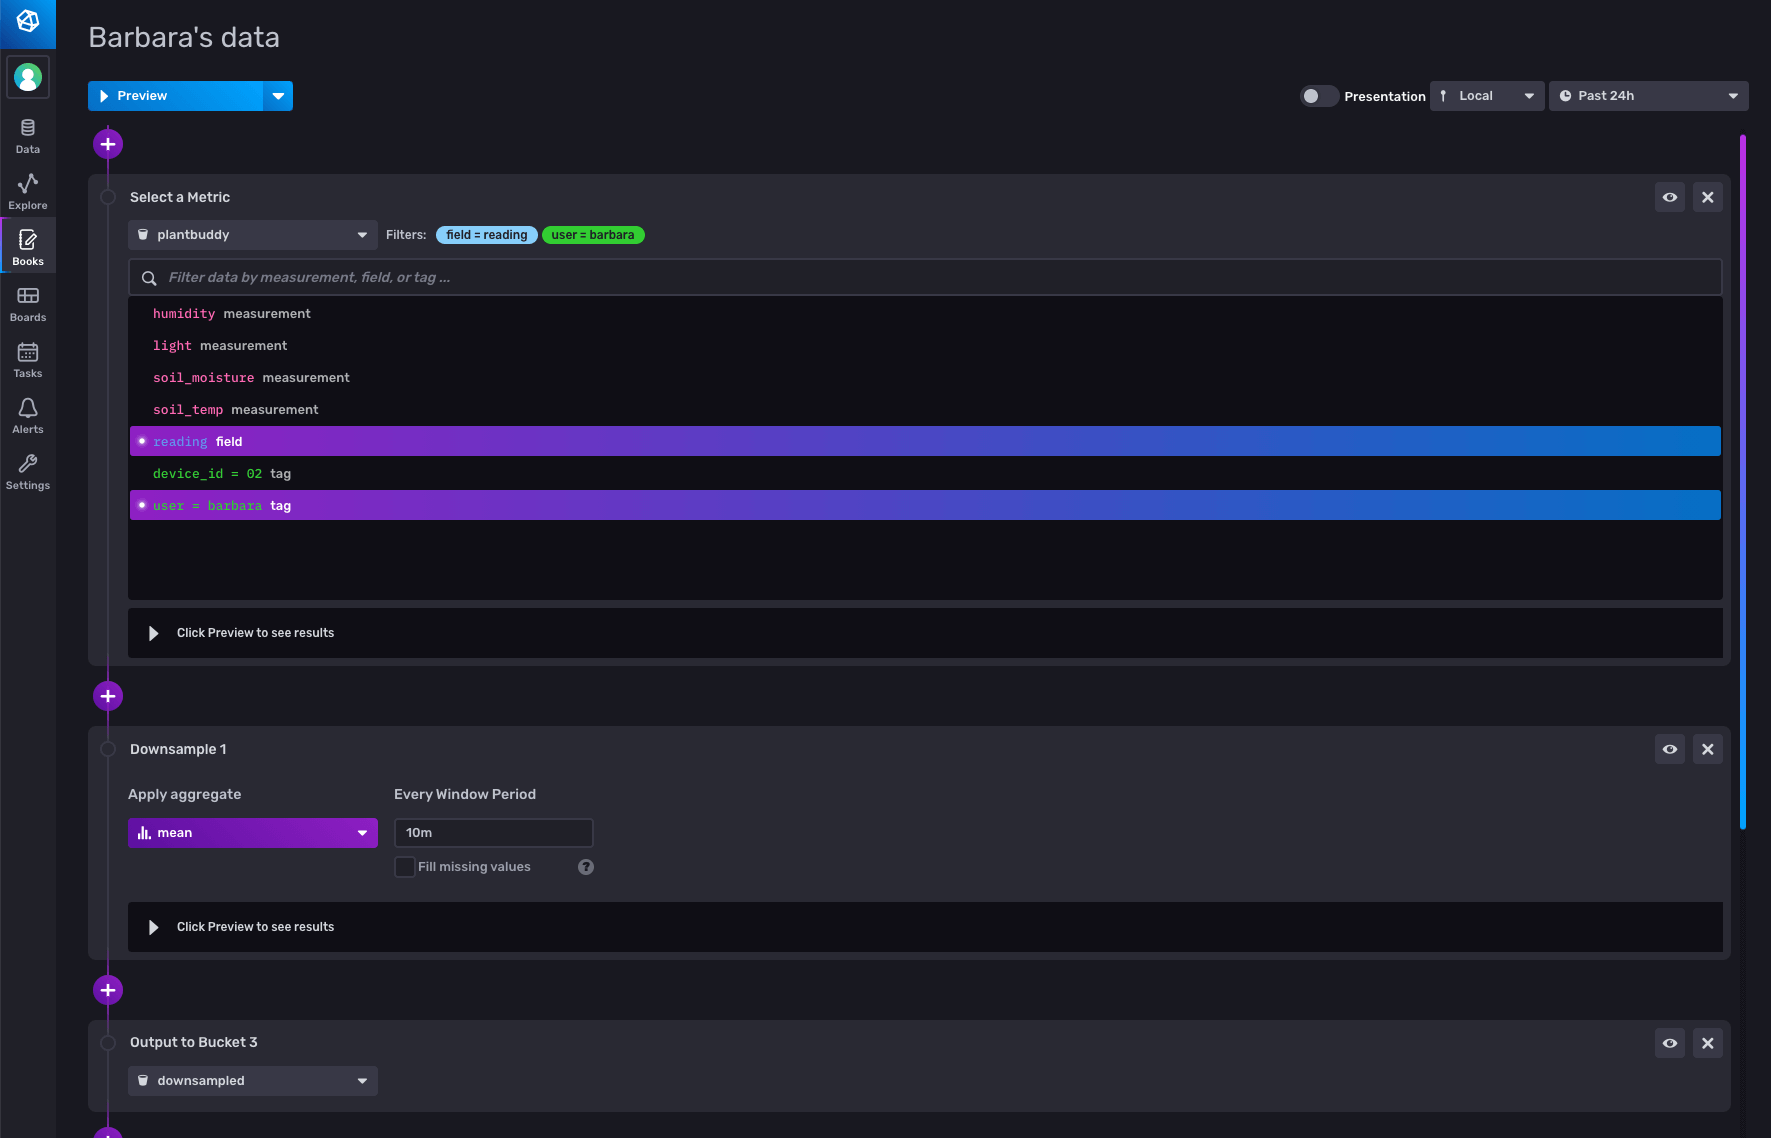
Downsampling entails calculating lower-resolution data to display from the high-resolution data, and saving that off pre-computed for displaying or further calculations. Other than making for a snappier user experience, it can also save you storage costs, because you can keep your downsampled data in a bucket with a longer retention period than your raw data. Rick used the CLI to create a downsampling bucket, author his downsampling script, and create a task to run the script. I took an easier approach, and used the notebooks UI to create the task that will downsample my data. I selected my metrics, then added a ‘downsample’ panel to aggregate the data every 10 minutes, and configured an output panel to write the result to the downsampled bucket.
Querying the downsampled bucket, I can see all the data is there.
Create a downsampling task
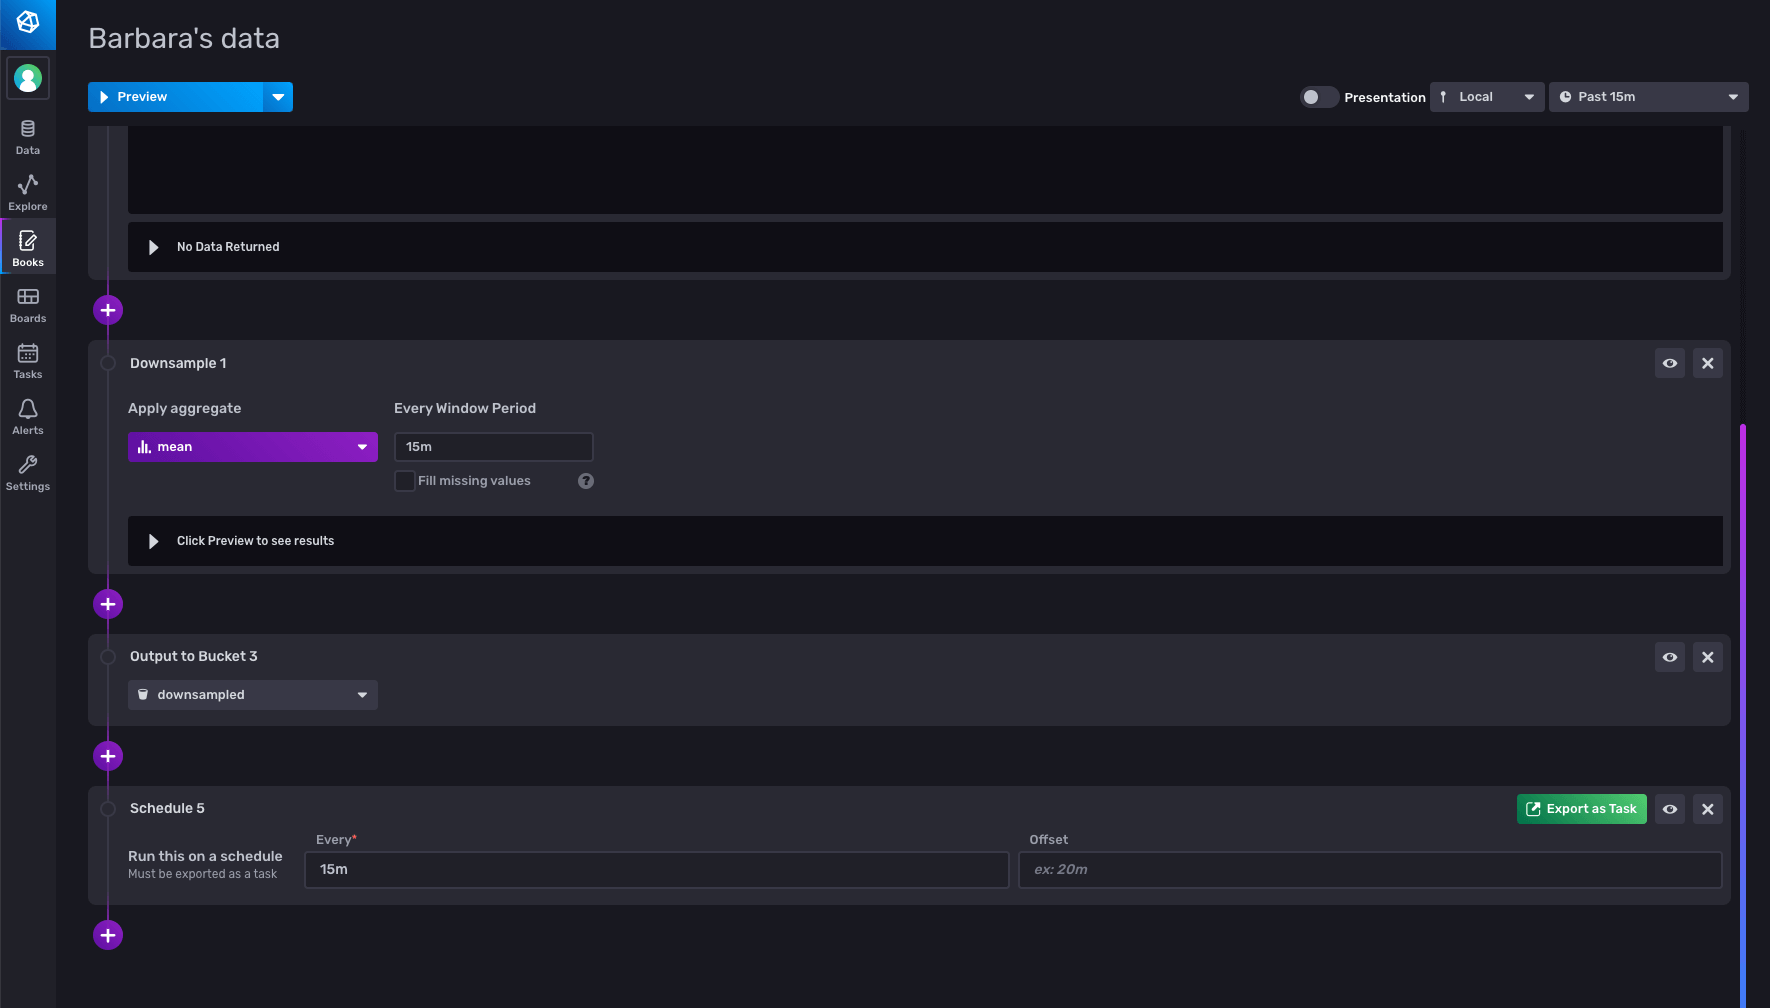
Once I confirmed that the downsample was working correctly, I took my notebook, and registered it as a task to run every 15 minutes, by adding a schedule panel, and configuring it to run every 15 minutes. I also changed the range to only look back for the last 15 minutes, so that I don’t downsample data more than once.
When I export as a task, I can see the generated Flux code:

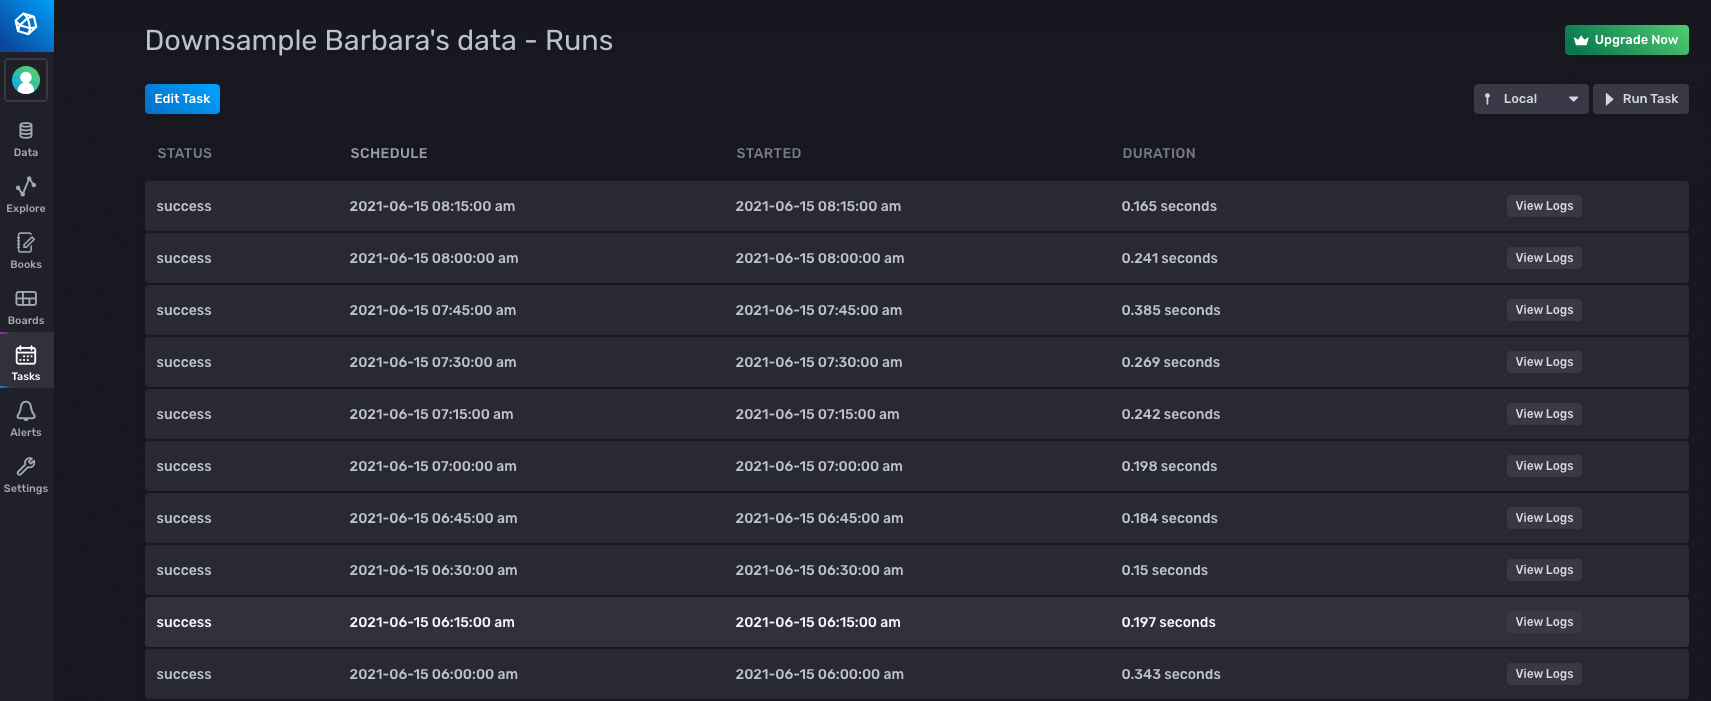
And I can see that it ran successfully, along with some other useful information, such as what Flux was actually run.
Notifications
The final feature that Rick added is the ability for plantbuddy.com to notify users if their soil gets too dry. With InfluxDB you can use tasks to create status checks and notification rules that will send a message to your application under whatever conditions you define. I decided to use the UI to set up my status checks and notification rules.
Threshold Check
I go to the Alerts option in the UI to set up my check. There are three parts to it:
- Defining the check
- Configuring the notification endpoint
- Defining the notification rule
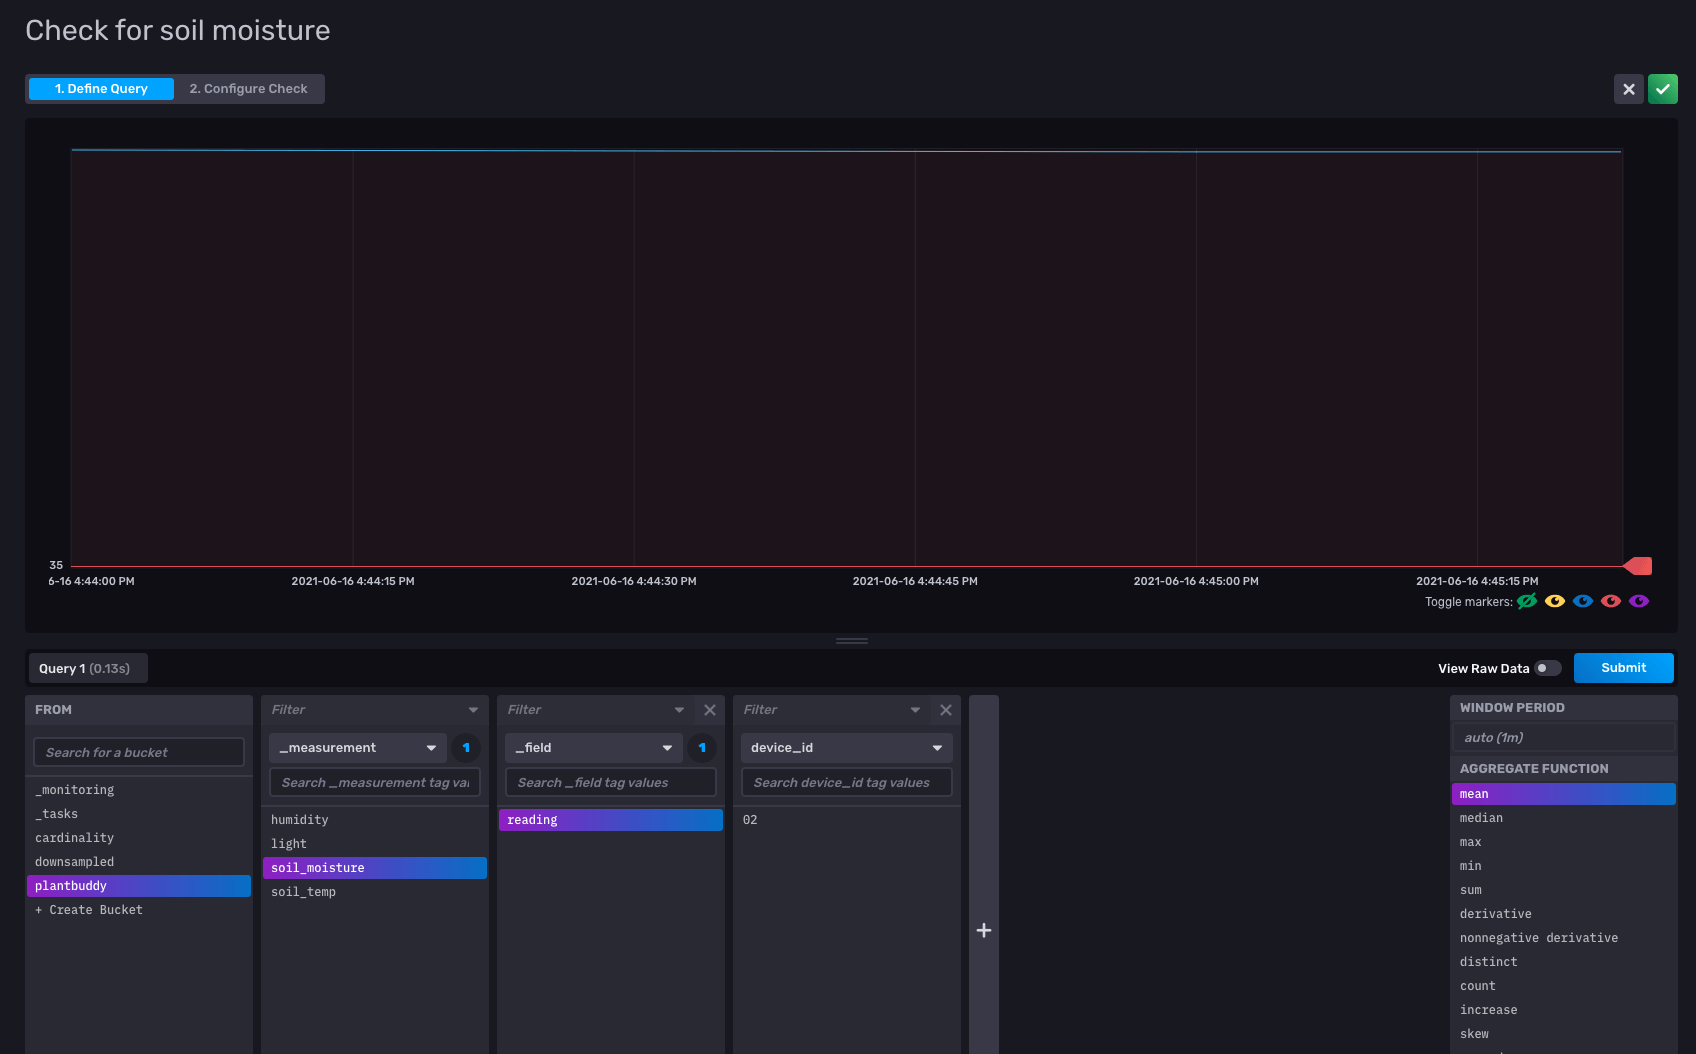
To define the check, all I have to do is select the field that I want to check, and the frequency at which I want to check it. I select my soil_moisture field.
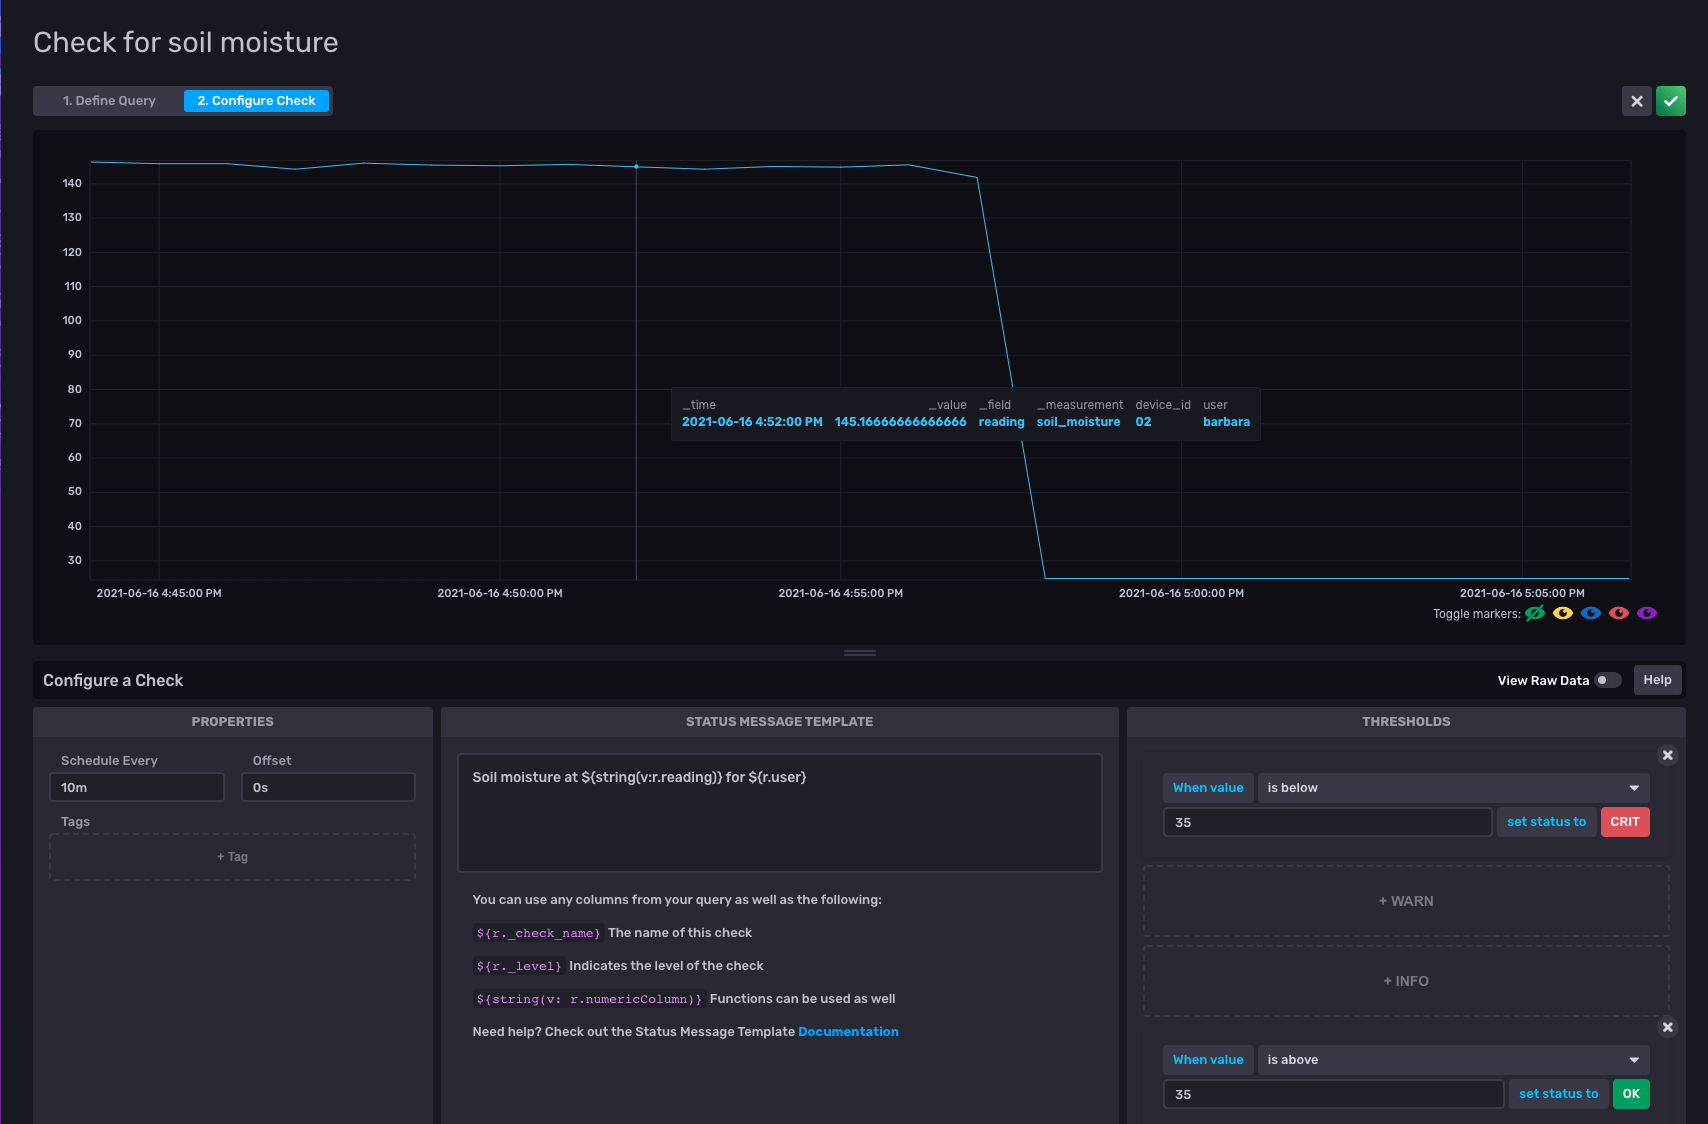
I configure the check to run every 10 minutes. I set the status to CRIT if the soil_moisture value is below 35, and set the status to OK if the soil_moisture level is above 35.
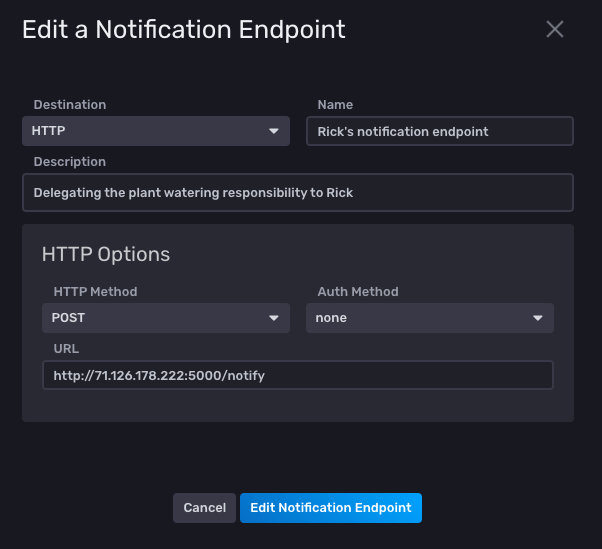
The second step is to set up a notification endpoint that can be notified when the plant needs watering. As Rick has already configured a HTTP endpoint, I’ll just use that one, so he can be reminded to water my plants. :-)
I select HTTP as the endpoint, provide the URL and I’m all set.
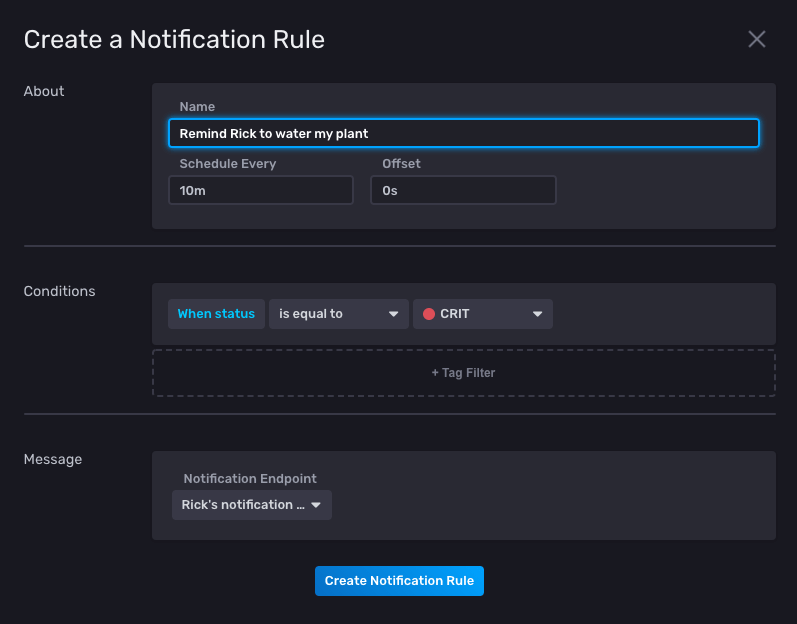
Now that I have a check and a notification endpoint, I can define my notification rule. I set the rule to check the status every 10 minutes, and notify Rick whenever my plant’s soil_moisture
level is critical.
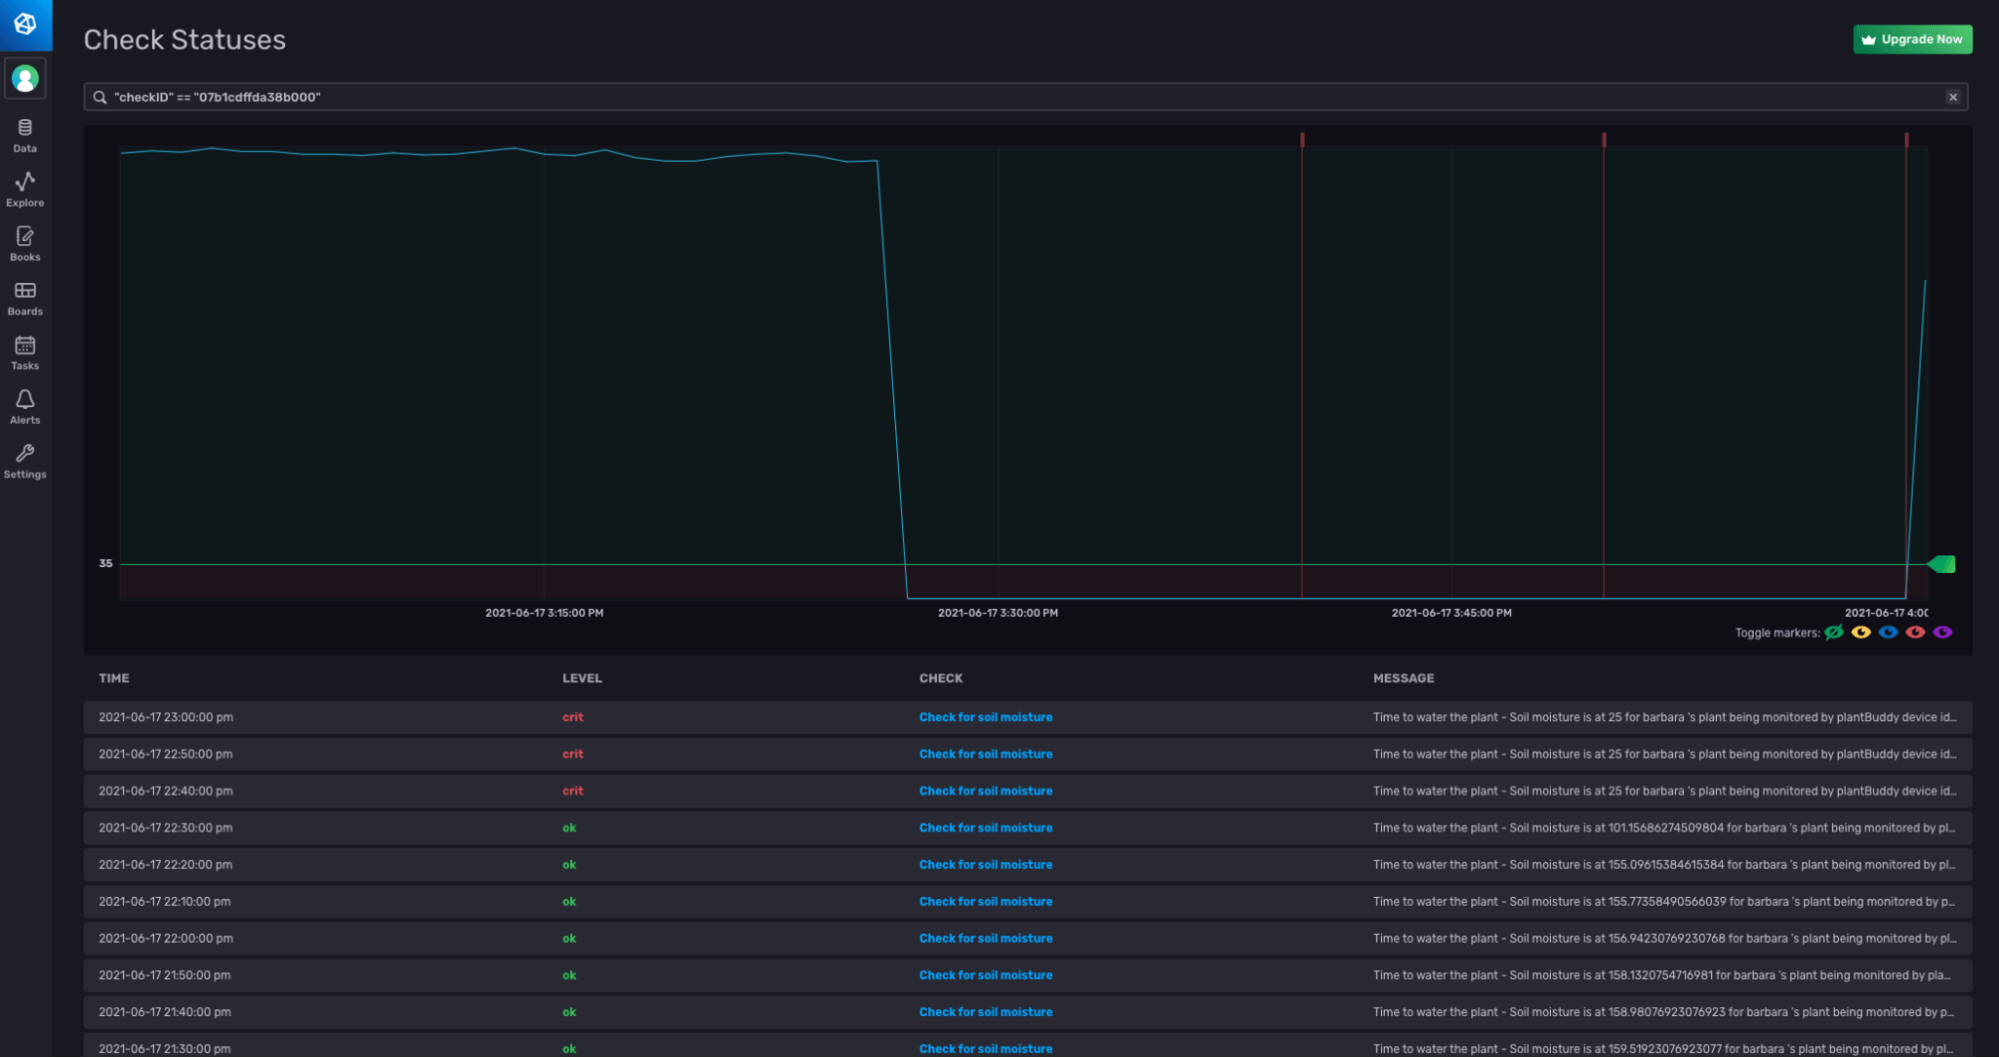
To test that everything is running, I write some test data with a low value for the soil_moisture, and I can see that the alerts fire.
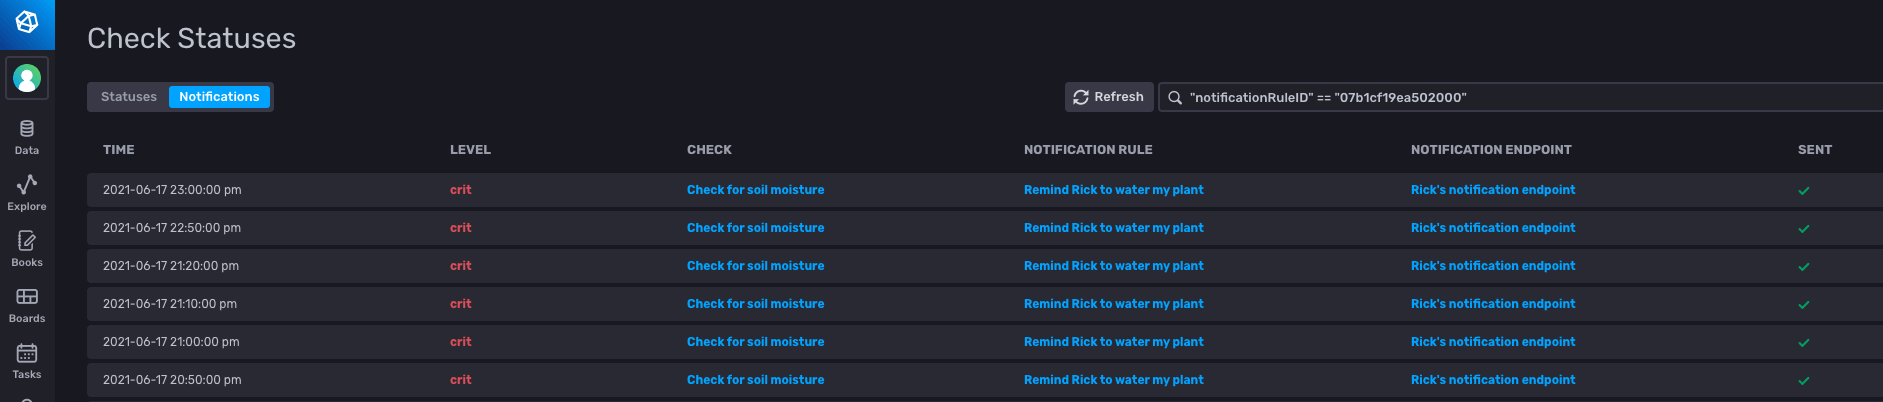
Whenever the level was critical, a notification was sent to Rick’s HTTP endpoint.
I hope you found this blog useful to show you the power of the InfluxData platform. Whether you choose to use the UI, the CLI, the API or any combination thereof, you should be able to build your own application to gain intelligence and act on your time series data.
