Plot Your Telegraf Metrics in Azure Monitor
By
Chris Churilo
updated December 14, 2025
Product
Developer
Company
Navigate to:
Today we announced Microsoft’s inclusion of Telegraf with their monitoring solution Azure Monitor, which they describe as Azure Monitor’s Unified Metrics Store. Azure Monitor is a platform that allows users to collect performance and utilization metrics from Azure resources. It comes with a portal for dashboarding and a mechanism to set up alerts. The inclusion of Telegraf plugins is significant since it expands the set of metrics that can be collected and stored in Azure Monitor. Microsoft calls these “Custom Metrics” and they are essentially metrics specific to the application or workload running in Azure.
 <figcaption> Figure 1: Azure Monitor custom metrics architecture Source: Microsoft</figcaption>
We are excited by this enhancement to Azure Monitor since it validates what we have known all alongthe strength of Telegraf is in part due to its open source nature, ease of use, and strong contributions from the community. Just look at the latest release, Telegraf 1.8, where 22 new plugins were added and contributions to the project were made by over 60 community members!
![]()
Deploying and setting Telegraf on a Linux VM in Azure is straightforward. Setup your VM in Azure, install and configure Telegraf, then plot your Telegraf metrics in the Azure portal. A detailed set of instructions is available on the Azure docs.
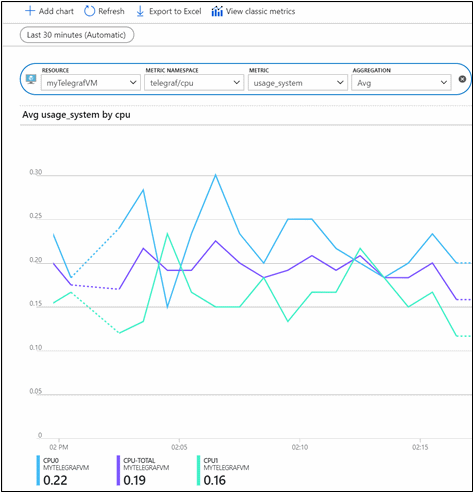 <figcaption> Figure 2: Azure Monitor dashboards Source: Microsoft</figcaption>
If you would like to learn more, or even try Azure Monitor with Telegraf for yourself, we have pulled together a set of links to help you learn more and get started.
