Prometheus Remote Write Support with InfluxDB 2.0
By
Samantha Wang
updated December 14, 2025
Product
Use Cases
Developer
Navigate to:
In InfluxDB 1.x, we provided support for the Prometheus remote write API. The release of InfluxDB 2.0 does not provide support for the same API. However, with the release of Telegraf 1.19, Telegraf now includes a Prometheus remote write parser that can be used to ingest these metrics and output them to either InfluxDB 1.x or InfluxDB 2.0.
How to send Prometheus remote write metrics into InfluxDB with Telegraf
I’ll go through how you can store your Prometheus remote write metrics in InfluxDB Cloud, but this same approach works with InfluxDB 2.x as well. We’ll start by setting up Telegraf to begin listening for metrics then make sure your Prometheus server is configured to begin remote writing data to your Telegraf instance.
Set up Telegraf to start listening for Prometheus remote write metrics
If you’re new to Telegraf and its plugin ecosystem, check out this Getting Started guide and video around setting up Telegraf and its configuration to send data to InfluxDB Cloud.
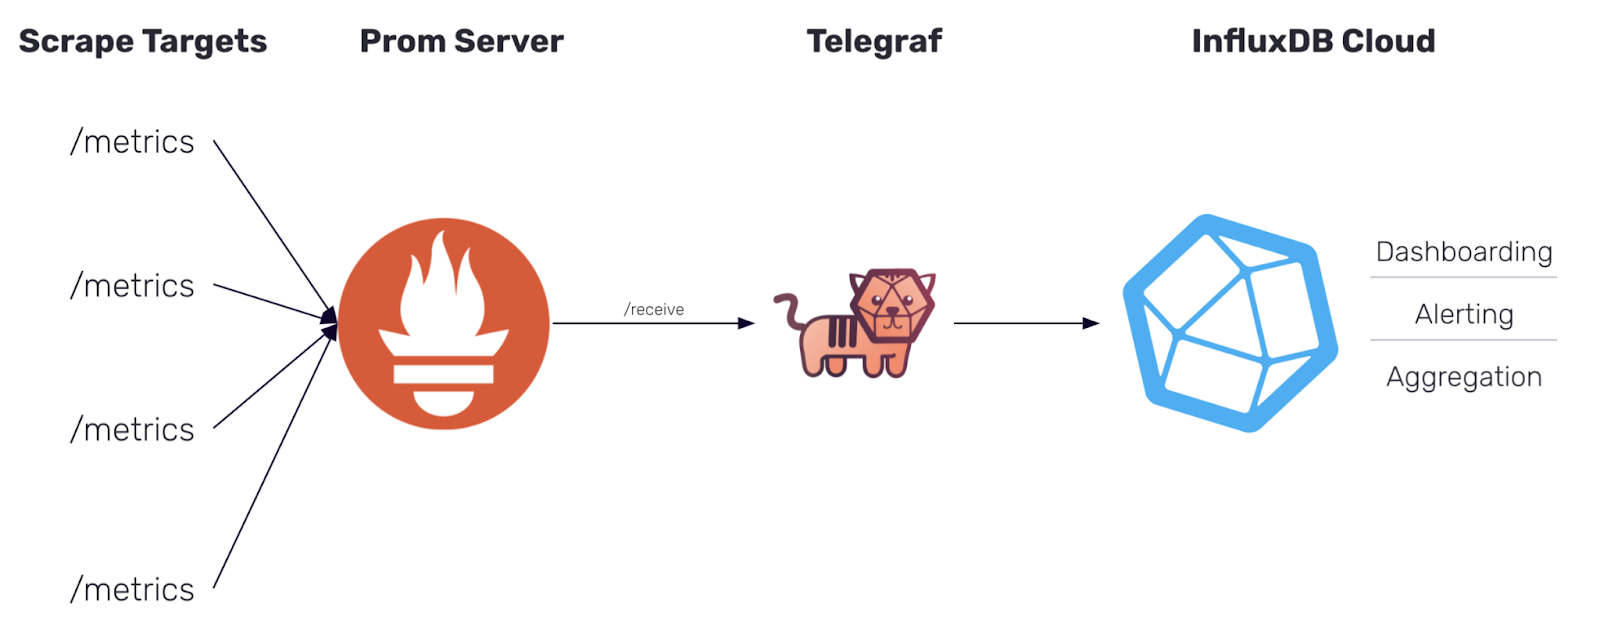
We’ll be using Telegraf as the collector for your Prometheus remote write metrics. To begin remote writing Prometheus metrics, you’ll be using the following:
Telegraf contains many general-purpose plugins that support parsing input data, using a configurable parser, into metrics. The Prometheus Remote Write Parser converts Prometheus remote write samples directly into Telegraf metrics.
You specify the parser to use with any input plugin which contains the data_format option. I’ll talk about how you can use the Prometheus Remote Write Parser specifically with the inputs.http_listener_v2 to begin collecting Prometheus metrics.
Set the port of your HTTP Listener and the path for it to listen to
The HTTP Listener v2 plugin listens for metrics sent via HTTP, and this is how we set up Telegraf to receive Prometheus remote write metrics. In your HTTP Listener v2 input plugin, you create an endpoint by specifying the port that you want Telegraf to listen on. You set that port number in the service_address option within the Telegraf configuration file as part of the HTTP Listener v2 plugin configuration. In this blog post, we’ll be using port :1234. Next you’ll set your path that you want to listen to and configure it in path; I’ll be setting my path to /receive.
The parser configuration is rather simple, as there are no additional configuration options to begin reading in Prometheus remote write samples. Once you set your data_format = "prometheusremotewrite" with the remote_write URL information in your HTTP Listener plugin, you should be good to go!
Within your Telegraf configuration file, your HTTP Listener v2 plugin definition will look something like this:
[[inputs.http_listener_v2]]
 ## Address and port to host HTTP listener on
 service_address = ":1234"
 ## Path to listen to.
 path = "/receive"
 ## Data format to consume.
 data_format = "prometheusremotewrite"
Add your InfluxDB Output Plugin
To send your data to your InfluxDB Cloud instance, you need to add the InfluxDB v2 Output Plugin and configure your URL, organization, bucket, and token (we suggest you avoid storing tokens directly in your telegraf.conf and store them as an environment variable).
Example of an InfluxDB Cloud Output Plugin:
[[outputs.influxdb_v2]]
  urls = ["https://us-west-2-1.aws.cloud2.influxdata.com"]
  token = "$INFLUX_TOKEN"
  organization = "example-org"
  bucket = "example-bucket"
Telegraf Tip: For setting up Telegraf and troubleshooting, it’s helpful to also have your metrics write to STDOUT alongside your output database. Just add an outputs.file to your configuration.
Run Telegraf to start listening for metrics????
Once your configuration is in place, you can run the following command to get Telegraf up and running:
telegraf --config /path/to/custom/telegraf.conf
Once Telegraf runs, you should see that your Telegraf is listening for metrics on your set port.
2021-06-17T17:52:04Z I! Starting Telegraf 1.19.0
2021-06-17T17:52:04Z I! Loaded inputs: http_listener_v2
2021-06-17T17:52:04Z I! Loaded aggregators:
2021-06-17T17:52:04Z I! Loaded processors:
2021-06-17T17:52:04Z I! Loaded outputs: file influxdb_v2
2021-06-17T17:52:04Z I! Tags enabled: host=MBP15-SWANG.local
2021-06-17T17:52:04Z I! [agent] Config: Interval:10s, Quiet:false, Hostname:"MBP15-SWANG.local", Flush Interval:10s
2021-06-17T17:52:04Z I! [inputs.http_listener_v2] Listening on [::]:7070
You won’t start seeing metrics until you get Prometheus up and running and set up your Prometheus configuration file to remote write.
Set up your Prometheus server
If you don’t already have your Prometheus server set up, check out Prometheus’ “Getting Started” documentation for a good introduction on how to get Prometheus up and running to start monitoring itself.
Add your Telegraf endpoint to the remote_write section of your Prometheus configuration file
In your configuration file (prometheus.yml), add a remote_write section with the URL of your Telegraf endpoint that you set in your HTTP Listener v2 Plugin.
The URL you use should look something like http://+service_address+path that you specified in the steps above.
Example of remote_write configuration:
remote_write:
 - url: "http://localhost:1234/receive"
My entire prometheus.yml:
global:
  scrape_interval:     15s
  evaluation_interval: 15s
alerting:
  alertmanagers:
  - static_configs:
    - targets:
rule_files:
scrape_configs:
  - job_name: 'prometheus'
    static_configs:
    - targets: ['localhost:9090']

remote_write:
  - url: "http://localhost:1234/receive"
Start remote writing your Prometheus metrics to Telegraf
Start Prometheus with your updated configuration file.
./prometheus --config.file=prometheus.yml
Telegraf has been listening for metrics on your set port this entire time. Once Prometheus is started, Telegraf receives these metrics and starts sending them to InfluxDB Cloud.
View metrics in InfluxDB Cloud
Now that you have Telegraf and Prometheus running, you can view your data in InfluxDB Cloud. From there, you can start creating dashboards or querying the data with Flux.
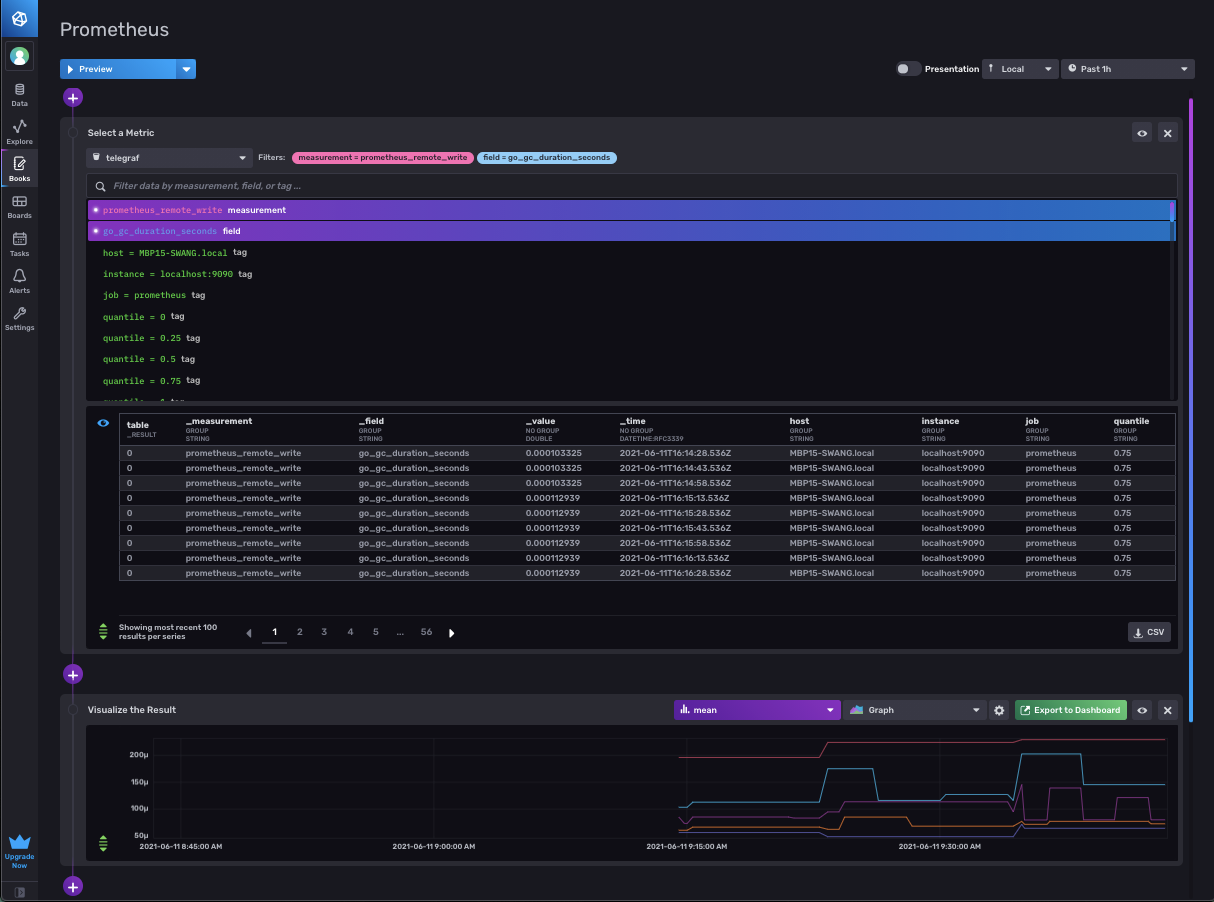
View of your Prometheus remote write metrics in Notebooks:
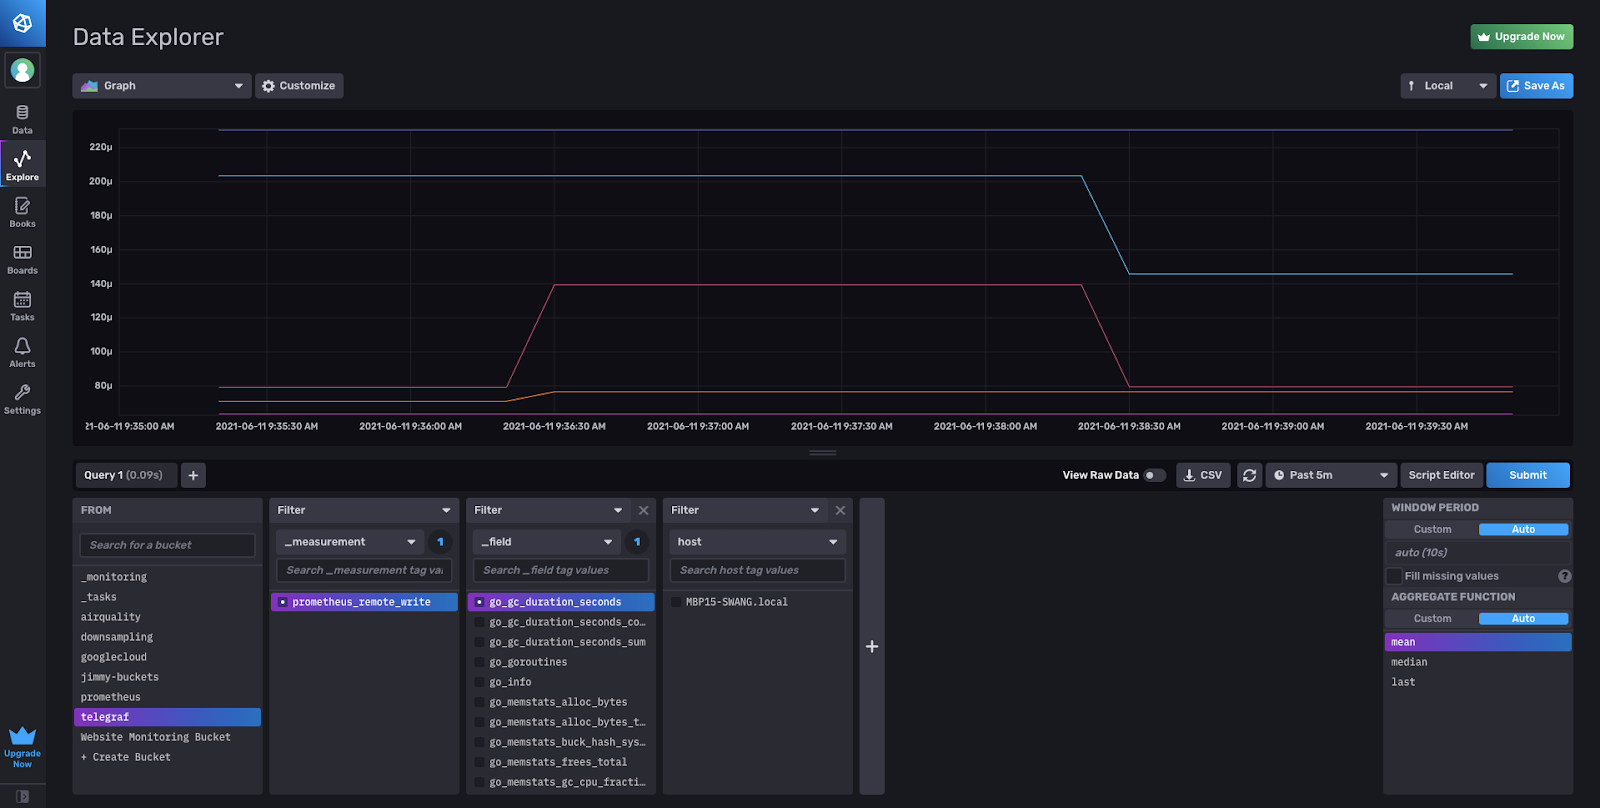
View of your Prometheus remote write metrics in the Data Explorer:
Writing Prometheus remote write to match the schema from InfluxDB 1.x
If you are looking to align with the Prometheus remote write schema from InfluxDB 1.x you need to make a quick addition to your configuration. The Prometheus Remote Write Parser works in line with the metric_version = 2 format of our Prometheus parser in Telegraf. This setting is what we recommend to Telegraf users when using any type of Prometheus plugin to properly round trip metrics.
If you would like to send your data to align with the InfluxDB 1.x schema, you will need to add a Starlark Processor containing this script. If you’re not familiar, Starlark is a lightweight Python-like language for quickly transforming records in Telegraf. You may need to edit the example script below to fit your specific use case.
Your configuration (without the output plugin) should look like the following:
[[inputs.http_listener_v2]]
  ## Address and port to host HTTP listener on
  service_address = ":1234"

  ## Path to listen to.
  path = "/receive"

  ## Data format to consume.
  data_format = "prometheusremotewrite"
[[processors.starlark]]
  ## The Starlark source can be set as a string in this configuration file, or
  ## by referencing a file containing the script.  Only one source or script
  ## should be set at once.

  ## Source of the Starlark script.
  source = '''
def apply(metric):
   if metric.name == "prometheus_remote_write":
        for k, v in metric.fields.items():
            metric.name = k
            metric.fields["value"] = v
            metric.fields.pop(k)
   return metric
'''
You’ll notice the following differences in the schema with and without the processor. In InfluxDB 1.x, the Prometheus metric names become the InfluxDB measurement. Then the Prometheus sample value becomes an InfluxDB field using the value field key (always a float). Prometheus labels will then become InfluxDB tags.
With the Prometheus Remote Write Parser, the measurement name is the plugin name prometheus_remote_write. The field key is the Prometheus metric name with the sample value as a float64. Then the Prometheus labels are converted into tags.
| InfluxDB output | Telegraf Config | Sample output schema |
| InfluxDB 2.x | [[inputs.http_listener_v2]] data_format = "prometheusremotewrite" + [[outputs.influxdb_v2]] | prometheus_remote_write,instance=localhost:9090,job=prometheus scrape_samples_scraped=390 1622840468859000000 |
| InfluxDB 1.x | [[inputs.http_listener_v2]] data_format = "prometheusremotewrite" + [[processors.starlark]] + [[outputs.influxdb]] | scrape_samples_scraped,instance=localhost:9090,job=prometheus value=390 1622843903859000000
(not preferred) |
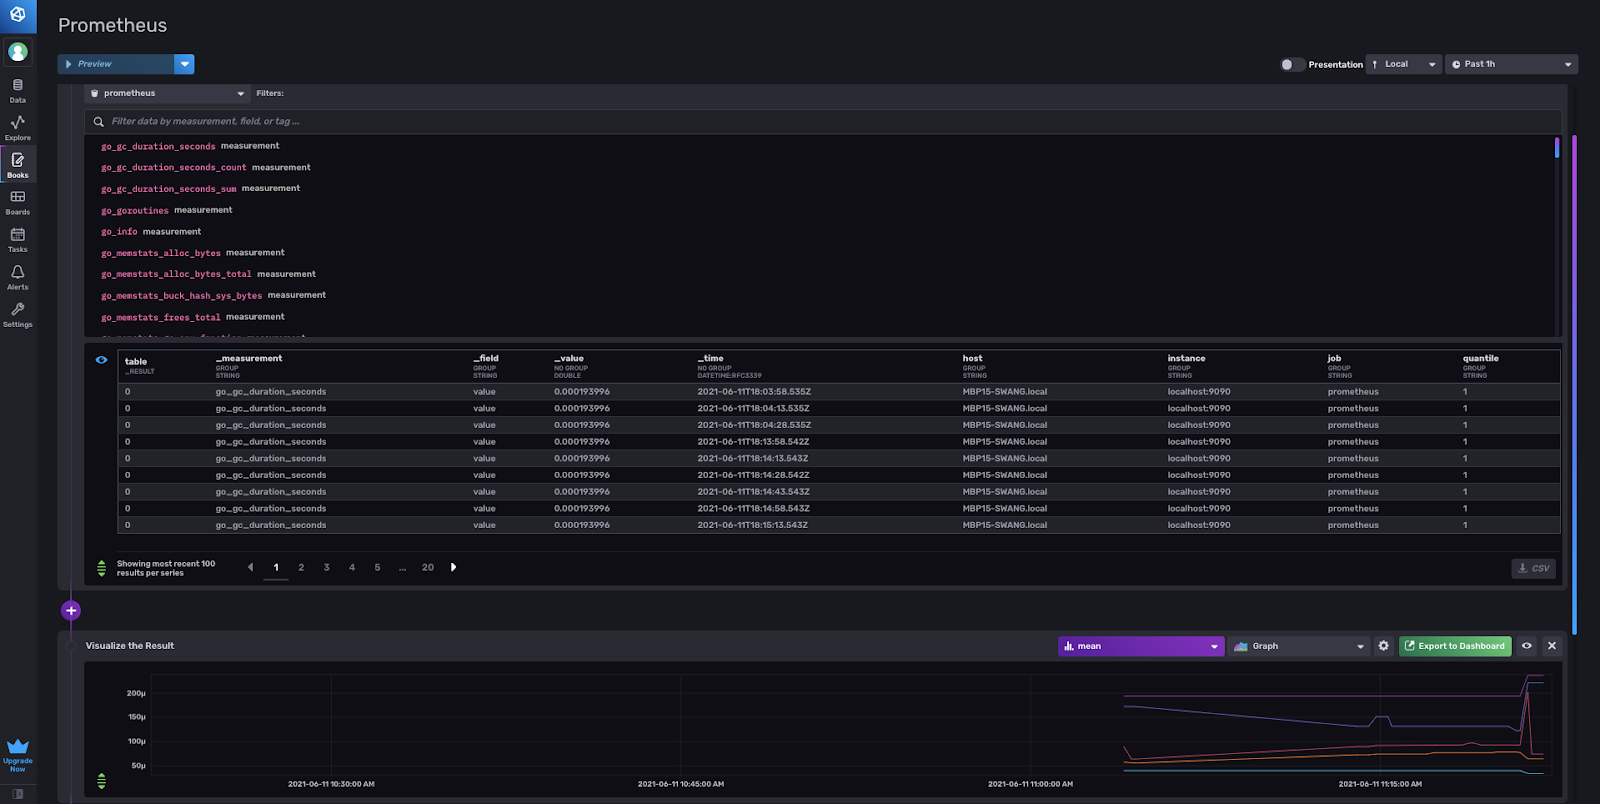
Here is the view of the 1.x schema of Prometheus remote write metrics as an InfluxDB Notebook, ready for you to begin querying and exploring the data.
Migrating Prometheus Remote Write metrics from InfluxDB 1.x to 2.0
For those who have been stuck on InfluxDB 1.x, since they’ve been waiting for Prometheus remote write support in 2.0, now is finally your chance!
As mentioned a few times before, if you have been remote writing Prometheus metrics prior to the Telegraf parser in 1.19, you are most likely using the API to write into 1.x and have been unable to migrate to 2.0 since the API does not provide support.
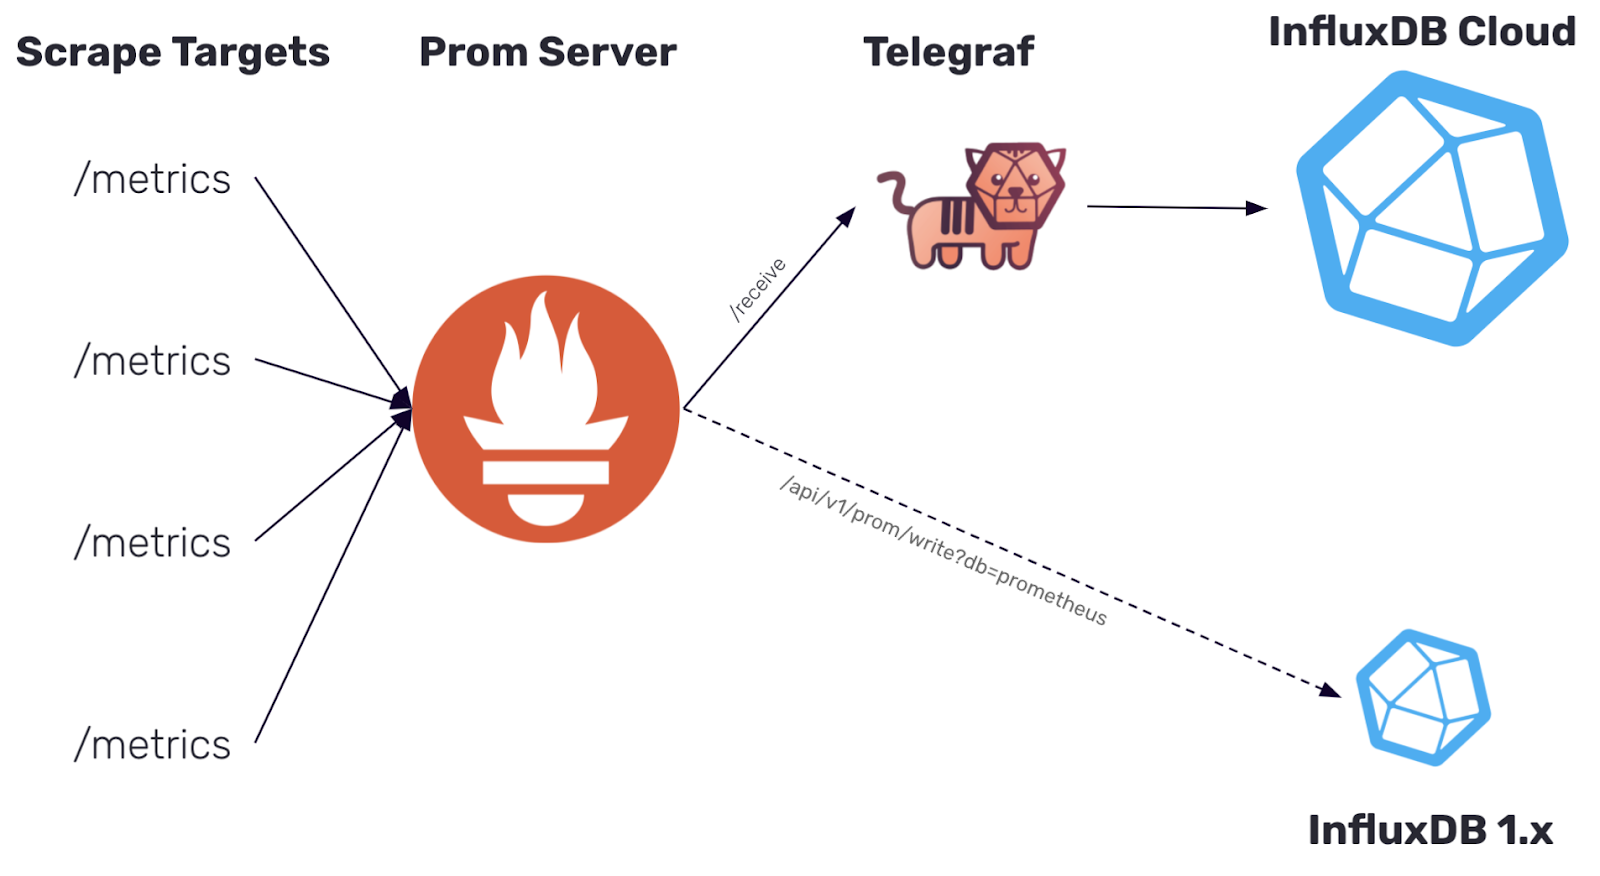
Dual remote write to InfluxDB 1.x and 2.0 from your Prometheus server
When you started remote writing data to InfluxDB 1.x, you probably had configured your prometheus.yml with the URL that includes the port on which your InfluxDB is running. To dual write to InfluxDB 2.0, we will add an additional remote write endpoint to your configuration. This can be done simply by adding another -url: pointing to your Telegraf endpoint to the remote_write section of your prometheus.yml.
remote_write:
  - url: "http://localhost:8086/api/v1/prom/write?db=prometheus"
  - url: "http://localhost:1234/receive"
Set up Telegraf to remote write data in InfluxDB 2.0
Follow the steps above in the “How to send Prometheus Remote Write metrics into InfluxDB with Telegraf” section to begin remote writing data to InfluxDB 2.0 alongside your existing InfluxDB 1.x instance. Remember to add the Starlark processor if you want your metrics to align with the schema from InfluxDB 1.x.
Verify the data is flowing into InfluxDB 2.0
You can view and query the metrics in InfluxDB 2.0. Be sure to check out our migration documents to make sure all your dashboards, queries, and everything that is important to you from 1.x also gets upgraded to 2.0.
Slowly migrate off of InfluxDB 1.x
Once you are satisfied with how everything is running in InfluxDB 2.0, you can begin to migrate off of 1.x. Once you remove the InfluxDB API endpoint from your prometheus.yml configuration, you will no longer be sending data to 1.x but only remote writing with Telegraf to InfluxDB 2.0.
As emphasized before, Prometheus metrics that are sent from the parser as is in metric_version=2 format (without starlark) is the option we recommend Telegraf users to properly round trip metrics. Unless you are reusing InfluxQL or other similar migrations that would cause your set up to break, working towards migrating to this schema as well would be very important.
Sign up for InfluxDB Cloud and download Telegraf to start writing!
Go ahead and start remote writing your Prometheus metrics! Download or upgrade to the Telegraf 1.19 and sign up for InfluxDB Cloud to try it out. If you have any questions please feel free to reach out to us on our Telegraf GitHub page, InfluxData Slack channel or community site.
