Prototyping IoT with InfluxDB Cloud
By
Rick Spencer
updated December 14, 2025
Product
Developer
Navigate to:
This is Part 1 of a four-part series. Read Part 2, Part 3, and Part 4 as well.
Earlier this week we announced that we are ready for the world to start using InfluxDB Cloud 2.0, the next version of the most popular time series database, in production. I love InfluxDB, and joined the company because it is so easy and fun to use while also being a battle-hardened production database.
InfluxDB Cloud 2.0 is suitable for monitoring infrastructure (including easily monitoring your Kubernetes cluster) but is also very popular for IoT projects. This posting is about the project that I wrote in an afternoon to use InfluxDB Cloud 2.0 for prototyping an IoT project. Absolutely everything here can be done with the free tier.
The scenario
Using parts and sensors that I had lying around my workshop, I created a monitoring system for the plant on workbench. What I would like is to get a stream of environmental information about the plant. I will focus mostly on the soil moisture level, though the other sensors could benefit from the same treatment.
The sensors
To build the sensor array, I rummaged through my box of goodies and came up with a set of relevant sensors that I had lying around:
- Light sensor
- Air temperature/humidity sensor
- Waterproof thermometer suitable for a soil sensor
- Soil moisture sensor (the focus of most of this post)
The prototype is not pretty, but it works.
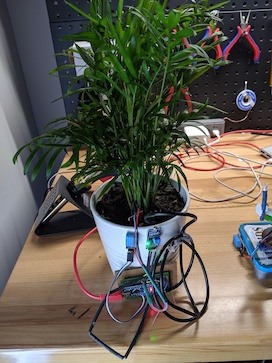
I used an Arduino Nano clone for the microcontroller. The Microcontroller lacks a wifi chip, so I am simply streaming the data from the sensors over USB to a Raspberry Pi 3 with integrated wifi, etc… This has the additional benefit of allowing me to easily use Python for sending the data.
The Arduino code is on GitHub in case you are interested. Again, none of this code is InfluxDB specific, it all relates to transmitting the sensor data to the Raspberry Pi, which acts as a sort of edge gateway in this setup.
Python code to structure sensor data
InfluxDB uses a line protocol format. That means that I need some Python code to create a string in the right format to send to Influx.
There is excellent documentation available on the line protocol format. To briefly summarize, a line has the following parts:
- The name of the measurement
- An optional set of tags
- A set of fields with their values
- An optional timestamp
Tags are very useful in circumstances where you need to differentiate the source of the data. For example, if I had several plants, I could use tags to differentiate which plant a specific reading is from. For this prototype, there is only one plant, so I will skip the tags. If you don’t supply a timestamp, then the database will add timestamp on the server for you. It’s easy enough to add a timestamp on the Raspberry Pi, so I will just do that.
Therefore, my simple line protocol will be:
sensorname measurement=value timestampI wrote a program that simply reads from the USB port, and prints out the line protocol. You can see the whole program in GitHub, but here is the function that creates the line protocol.
def get_line_protocol(sensor, reading, value):
	line = "{} {}={} {}"
	timestamp = str(int(datetime.datetime.now().timestamp() * 1000))
	return line.format(sensor, reading, value, timestamp)
An example output looks like this:
moisture soilMoisture=521 1568289900477Now I’m ready to start writing to InfluxDB! I just need to set up a free account.
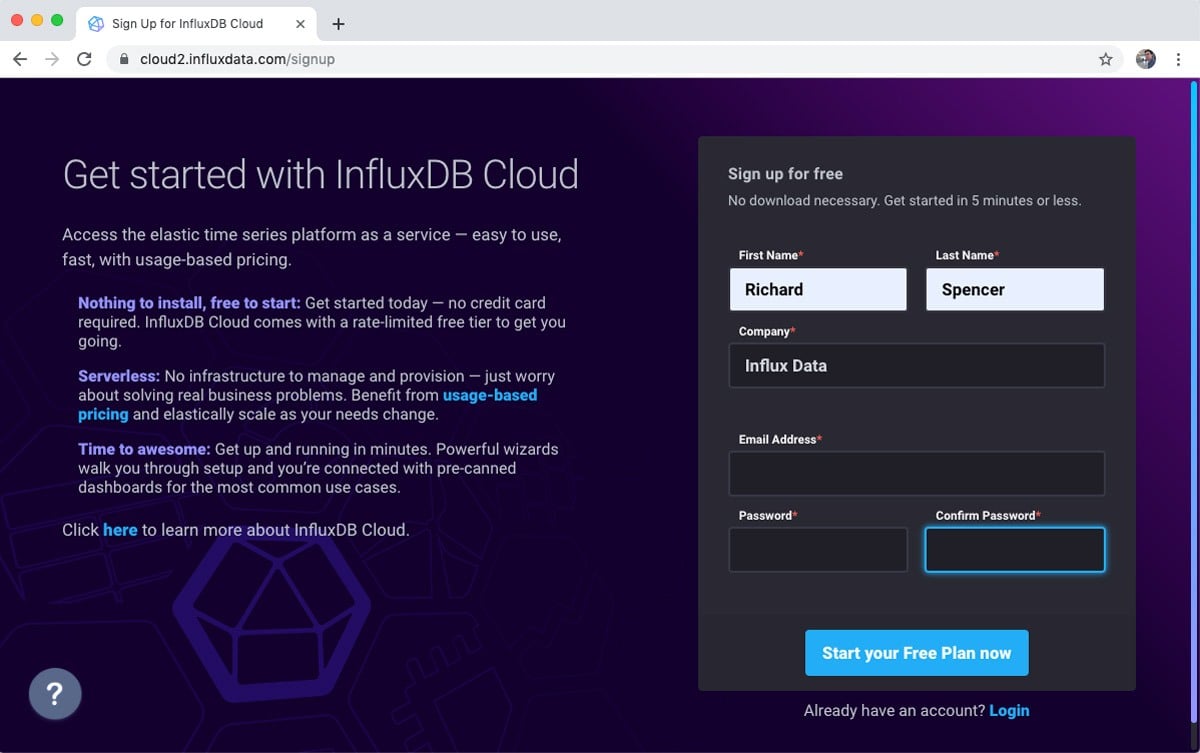
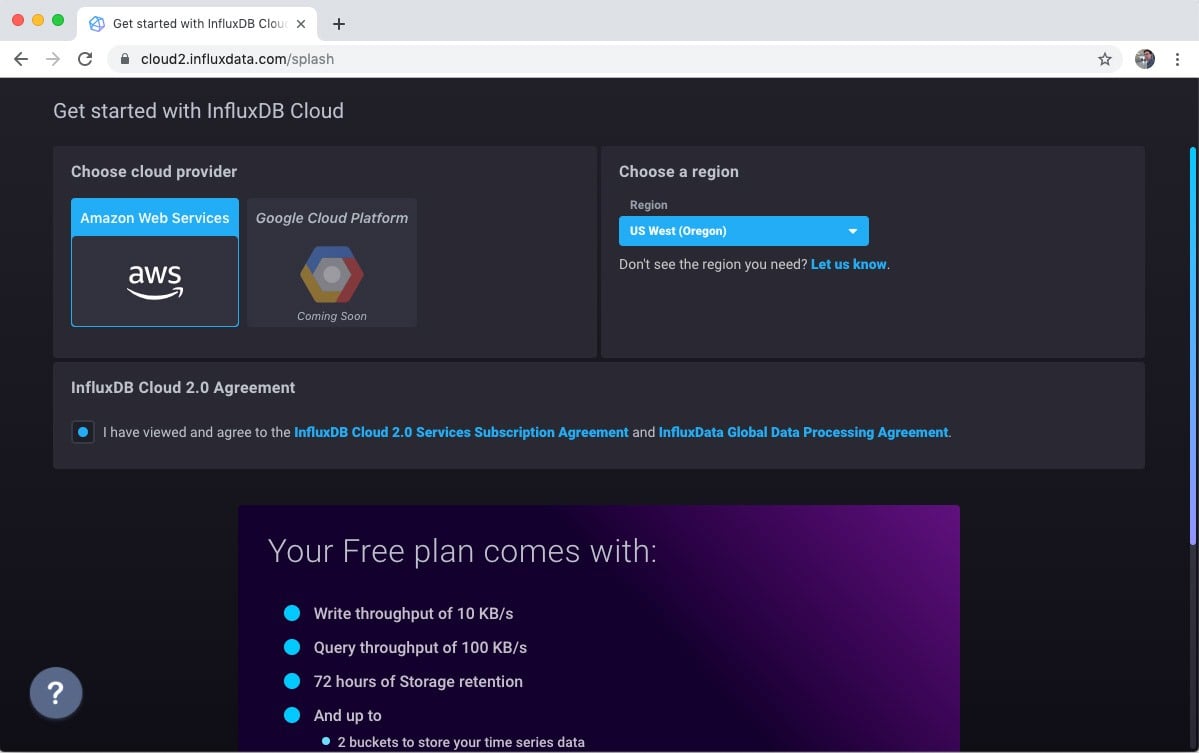
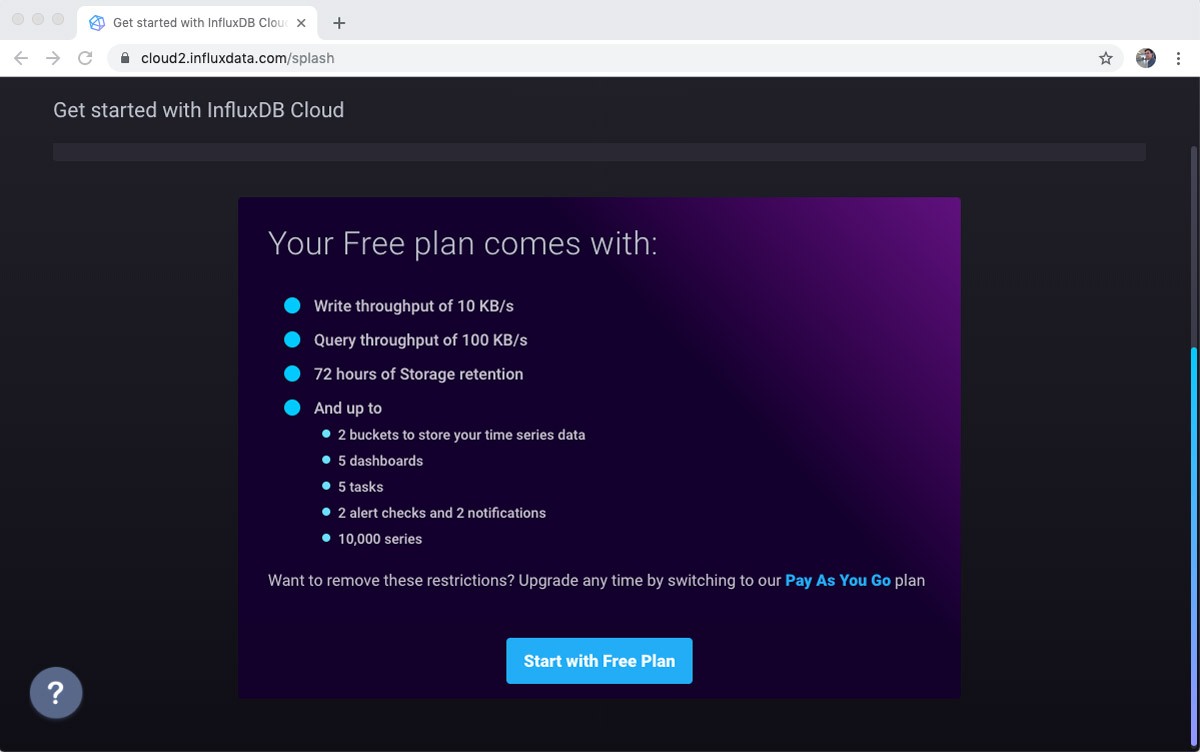
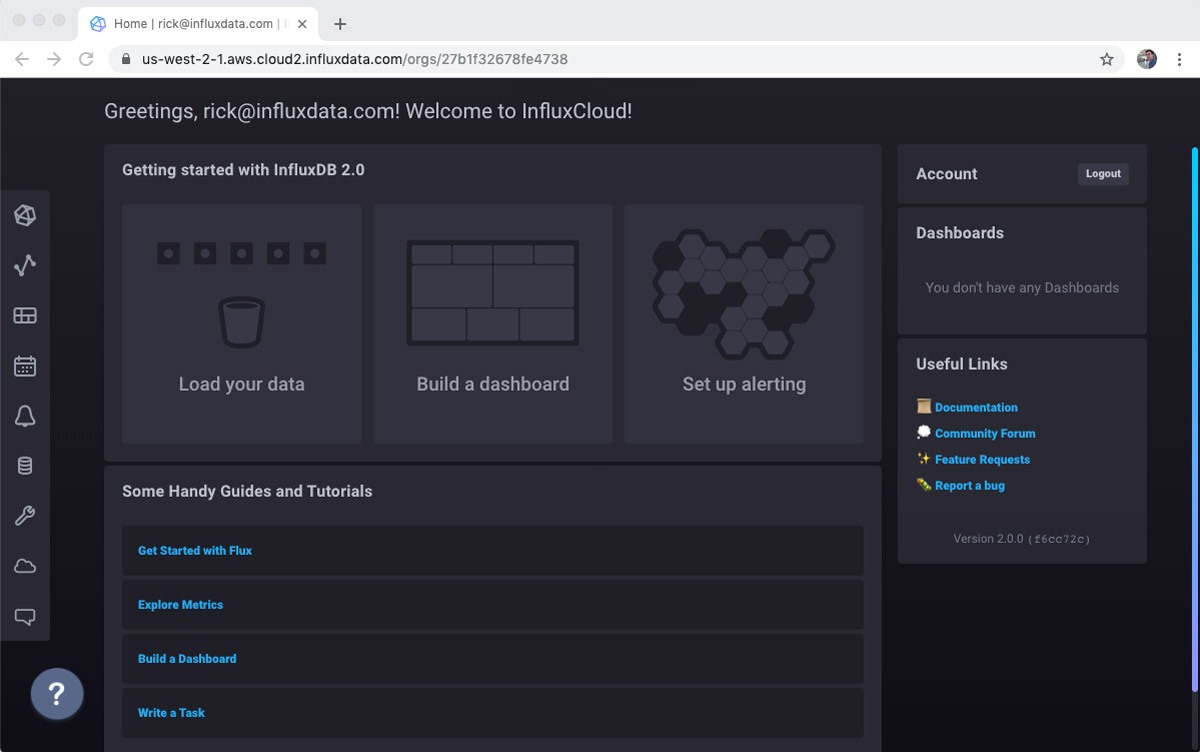
Get an InfluxDB account
There is a normal signup flow it takes less than a minute to get an account. You just have to acknowledge your email.
Set up a bucket
A “bucket” on InfluxDB is pretty much what it sounds like. You can add any time series that you want to a bucket. For example, I am going to send a mix of sensor data. I will need the bucket later so my Python code can tell InfluxDB where to store the data.
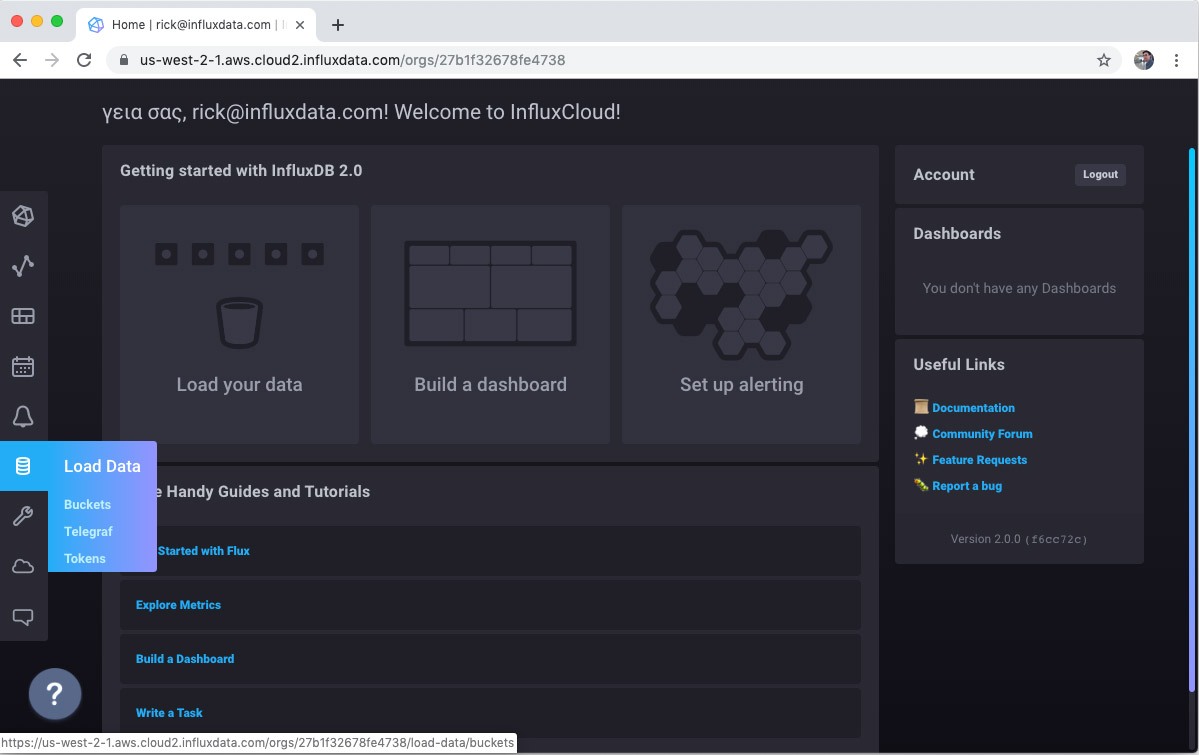
Go to the Buckets subsection of the Load Data screen.

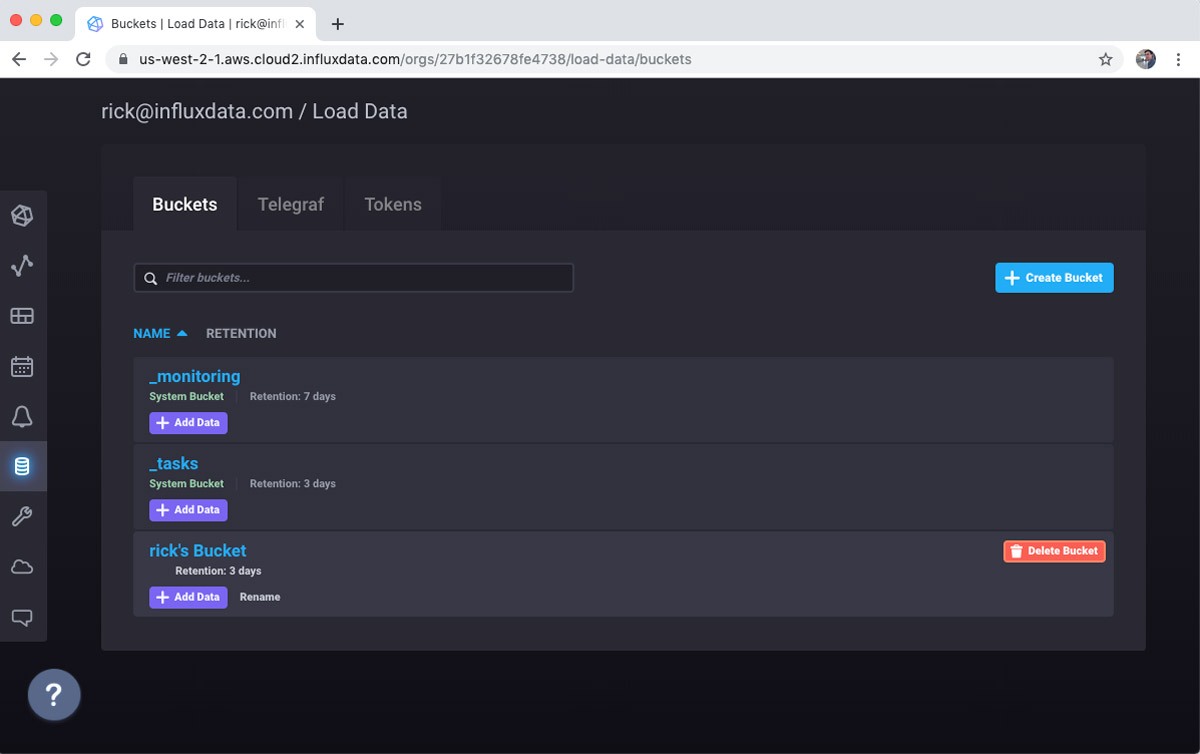
Notice that there are three buckets created already. The _monitoring and _tasks buckets are important for supporting features that we will use later, so leave those alone. On the other hand, I typically delete the default bucket as a first step. You could rename it if you prefer, but for some reason my habit is to delete the bucket and create a new one.
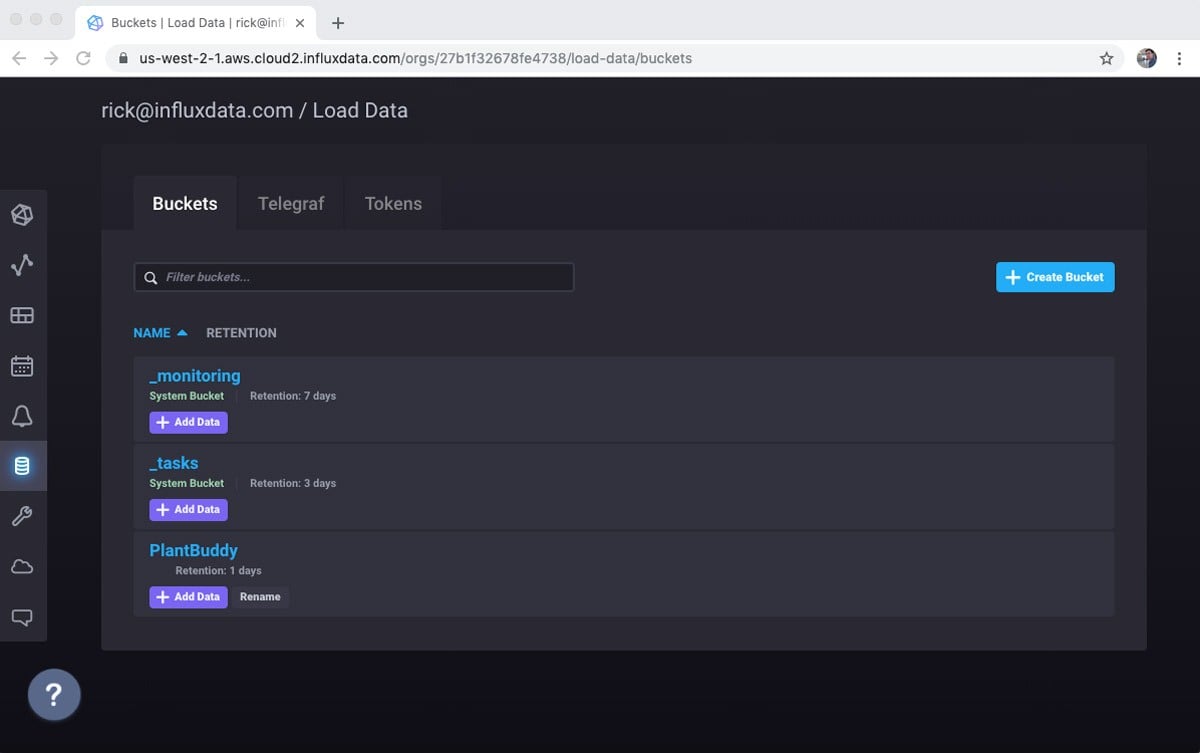
Use the + Create Bucket button to get the Create Bucket dialog. Because this is a free account, I don’t get infinite data retention. That’s fine for my prototype, though. I’ll set the retention period to one day for simplicity.


And now my bucket is ready to get some data!
Get a token
There are various good ways to send your data to InfluxDB. Typically, you will use Telegraf to send your data to InfluxDB. However, there is also a clean REST API that you can use. This means that you have to do all of the error handling, and optimizations that Telegraf can handle for you, which makes sense in certain production use cases. For prototyping, I find using the REST API is simple because there is one less component to set up. Perhaps I will migrate to Telegraf in a future post, as it is quite easy to install and run on a Raspberry Pi.
So, the main thing that I need is a token. Don’t worry, I will delete this token right after publishing this. :)
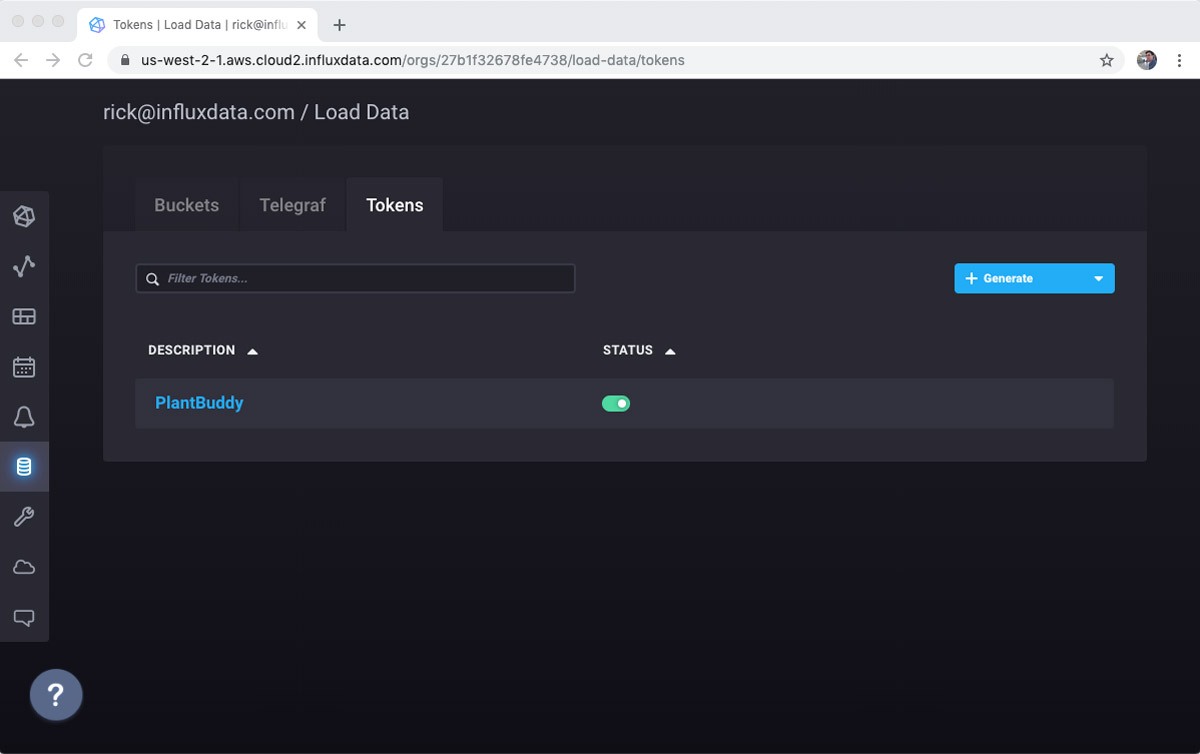
First, I’ll go to the token sub screen in the Load Data screen in the left hand nav.
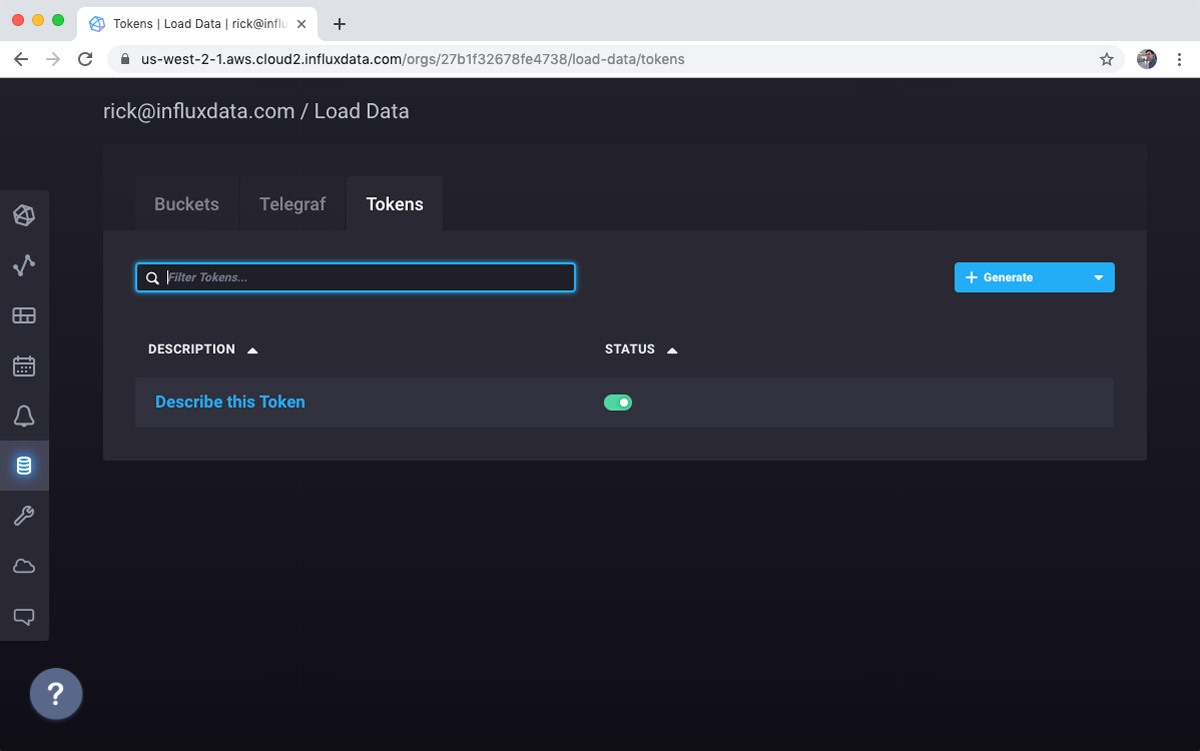
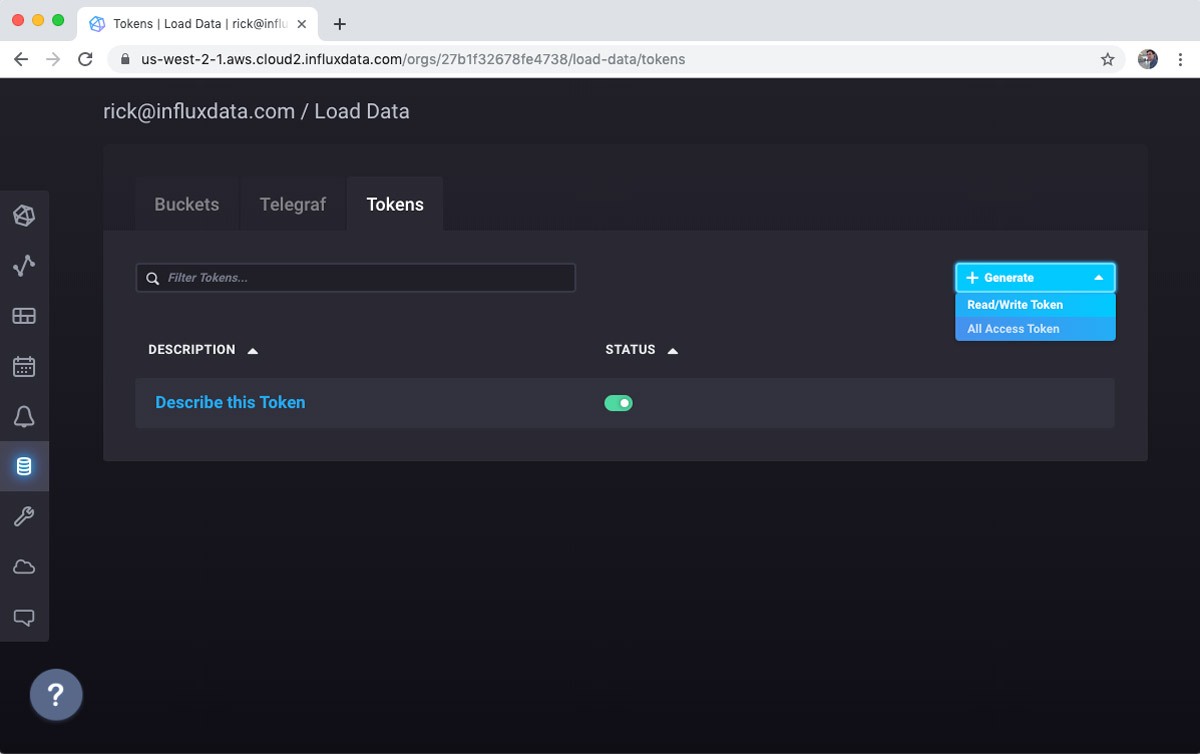
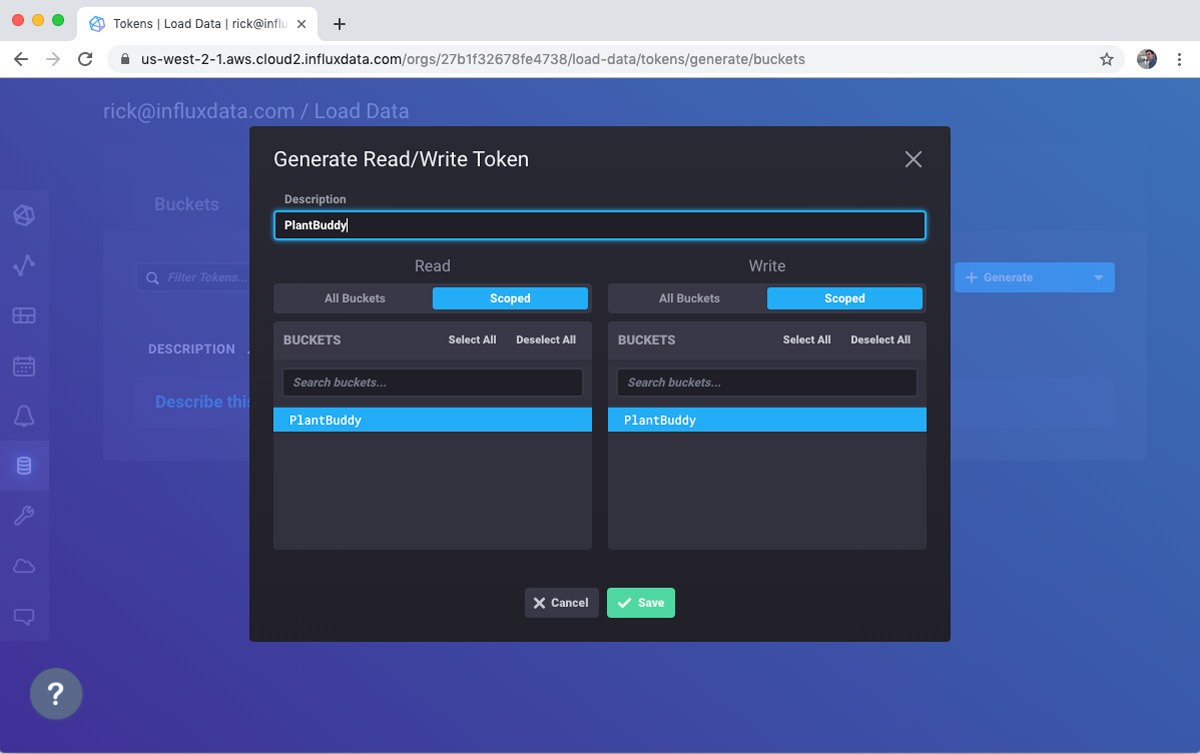
Again, there is a default token available, but I will use the + Generate button to create a read/write token. Plant Buddy is not going to be administering my database, so it doesn’t need full access. In fact, it only needs Write access, but I might want to write some “Read” code as part of the prototype, so I will make it Read/Write for now.
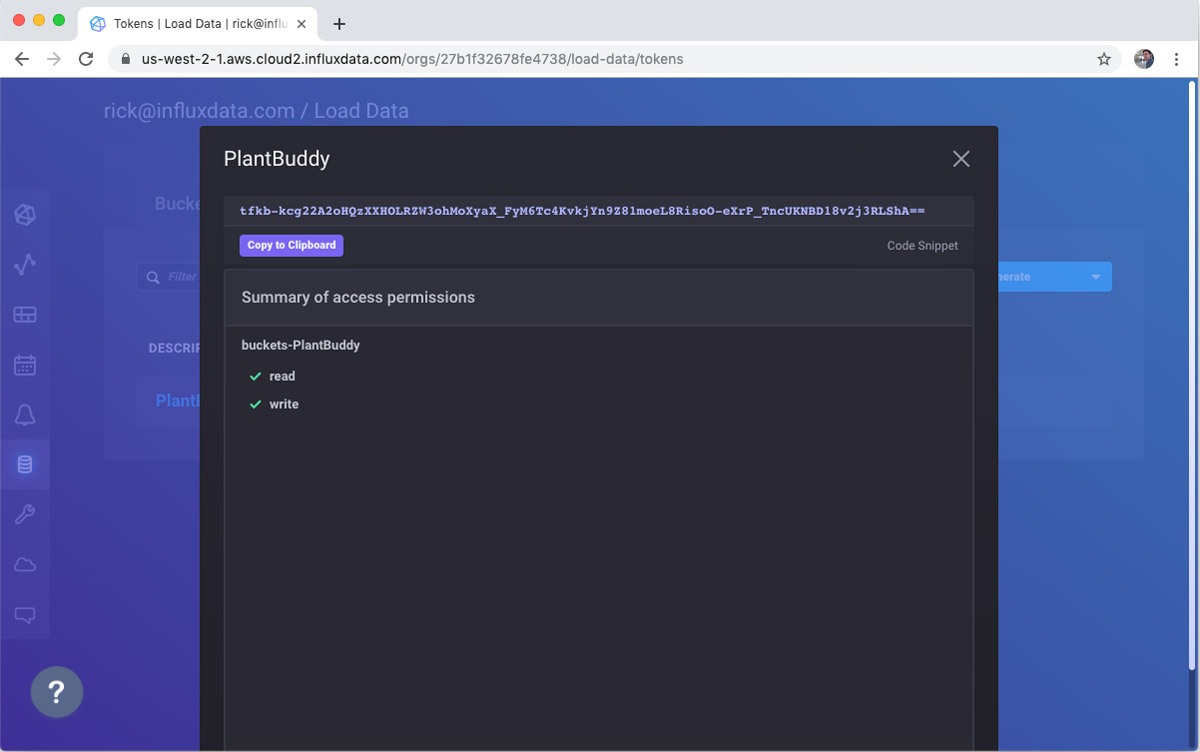
Select the buckets that you want to access:
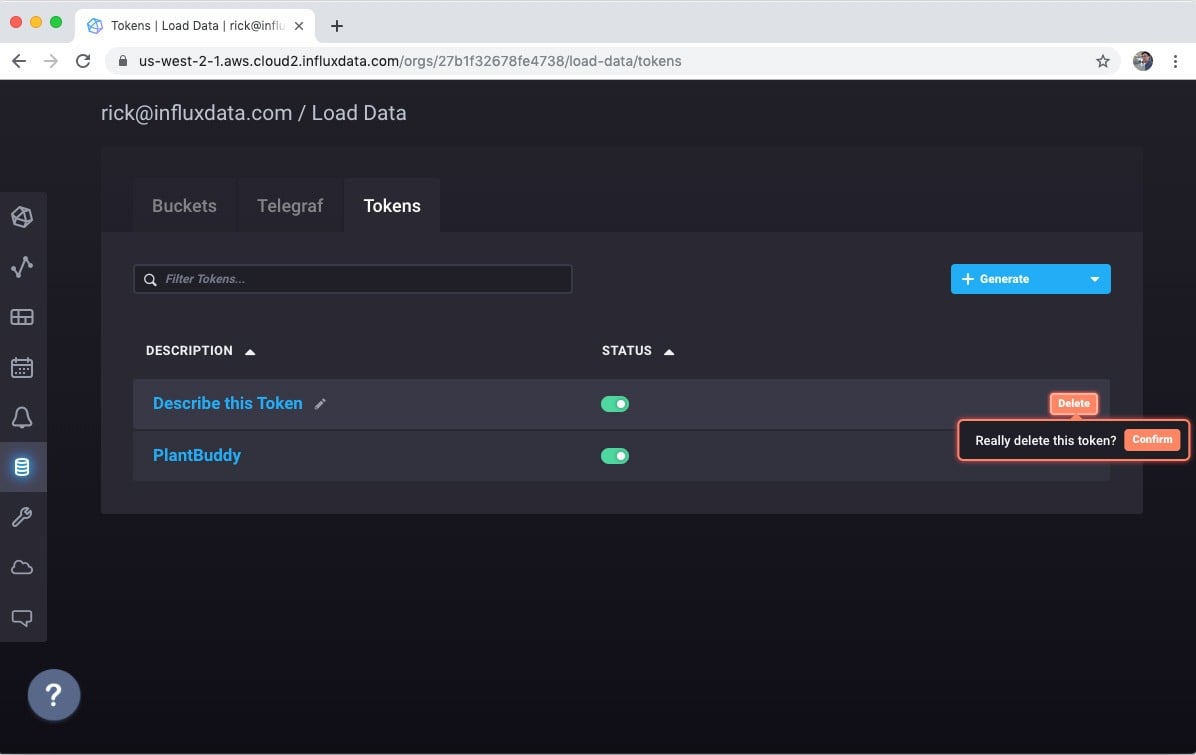
Again, for whatever reason, I like to delete the default token.
Now I can click on the token, view it, and copy it into my code. Just in case you are getting naughty ideas, I am going to delete the token before I publish this. :)
Python code for sending the data
Now that I have the token, I simply need to create a POST request to send the line protocol data to InfluxDB. I need to know:
- My token
- The bucket where I want to send the data
- My organization name
- The URL to post to
Now that I have the token, I can construct the POST request:
def send_line(line):
    url = "{}api/v2/write?org={}&bucket={}&precision={}".format(influx_url, organization, bucket, precision)
    headers = {"Authorization": "Token {}".format(influx_token)}
    r = requests.post(url, data=line, headers=headers)
The full Python module is available on GitHub. I tried to set it up to be a decent starting place for your own prototyping.
When I run it, I can see from the output that the data is being gathered from the sensors and formatted properly:
$ ./plant-buddy --token=tfkb-kcg22A2oHQzXXHOLRZW3ohMoXyaX_XXXXXXXXX
moisture soilMoisture=526 1568289892854
temp airTemp=028 1568289893544
humidity humidity=067 1568289894447
temp soilTemp=025 1568289895168
light light=162 1568289895809
moisture soilMoisture=522 1568289896665
temp airTemp=028 1568289897280
humidity humidity=067 1568289897942
temp soilTemp=025 1568289898565
light light=163 1568289899160
moisture soilMoisture=521 1568289900477
temp airTemp=027 1568289901420
humidity humidity=066 1568289902134
temp soilTemp=025 1568289902849
Visualizing data
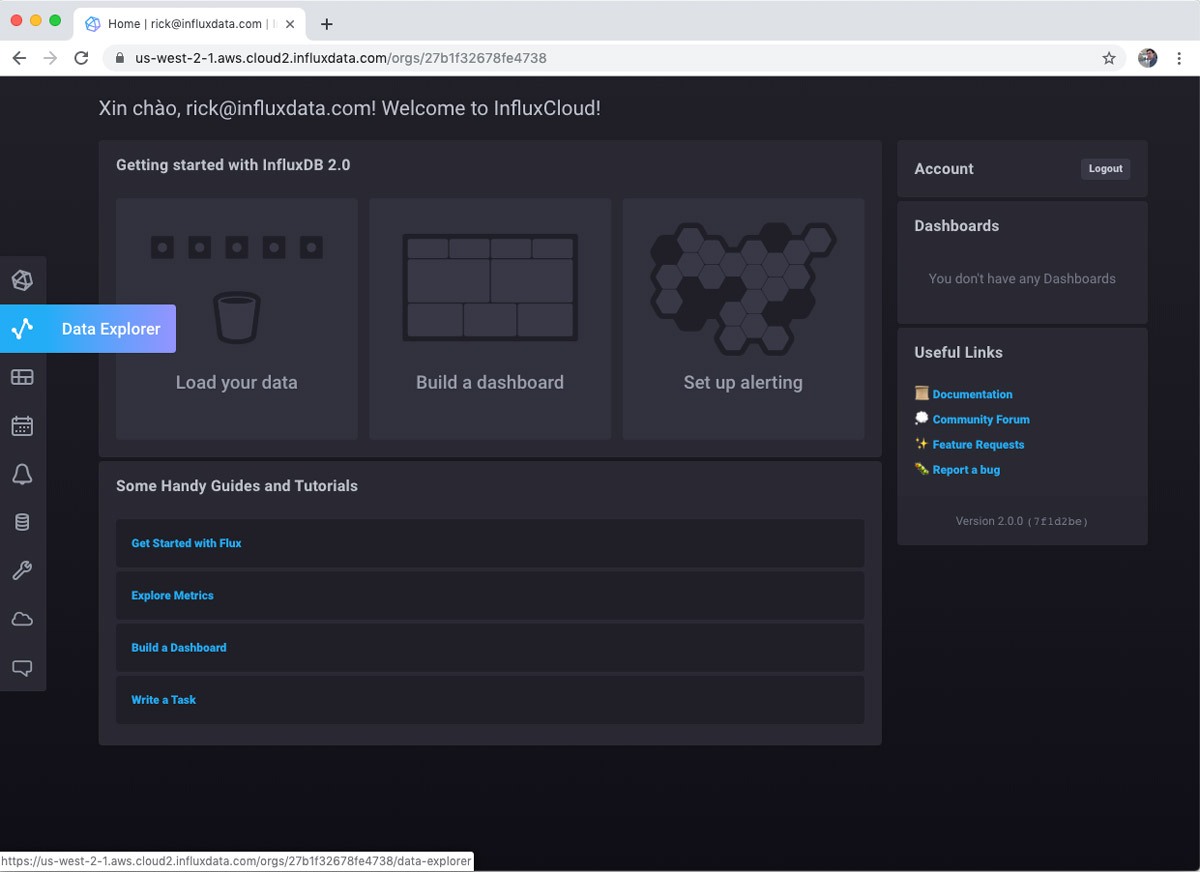
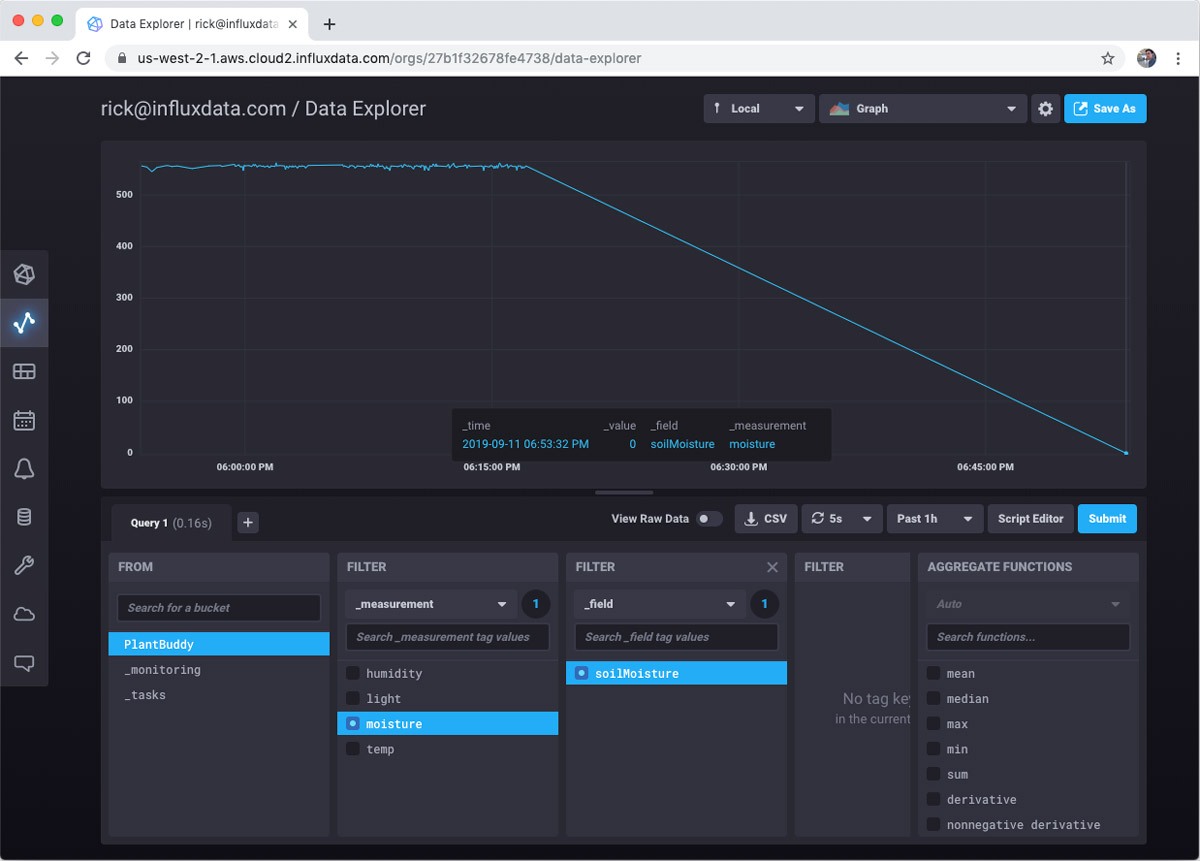
So, now we can look at the data streaming into the database. Just select Data Explorer on the left hand nav.
Then select the bucket that you want to visualize. This is easy for me since I only have one bucket.
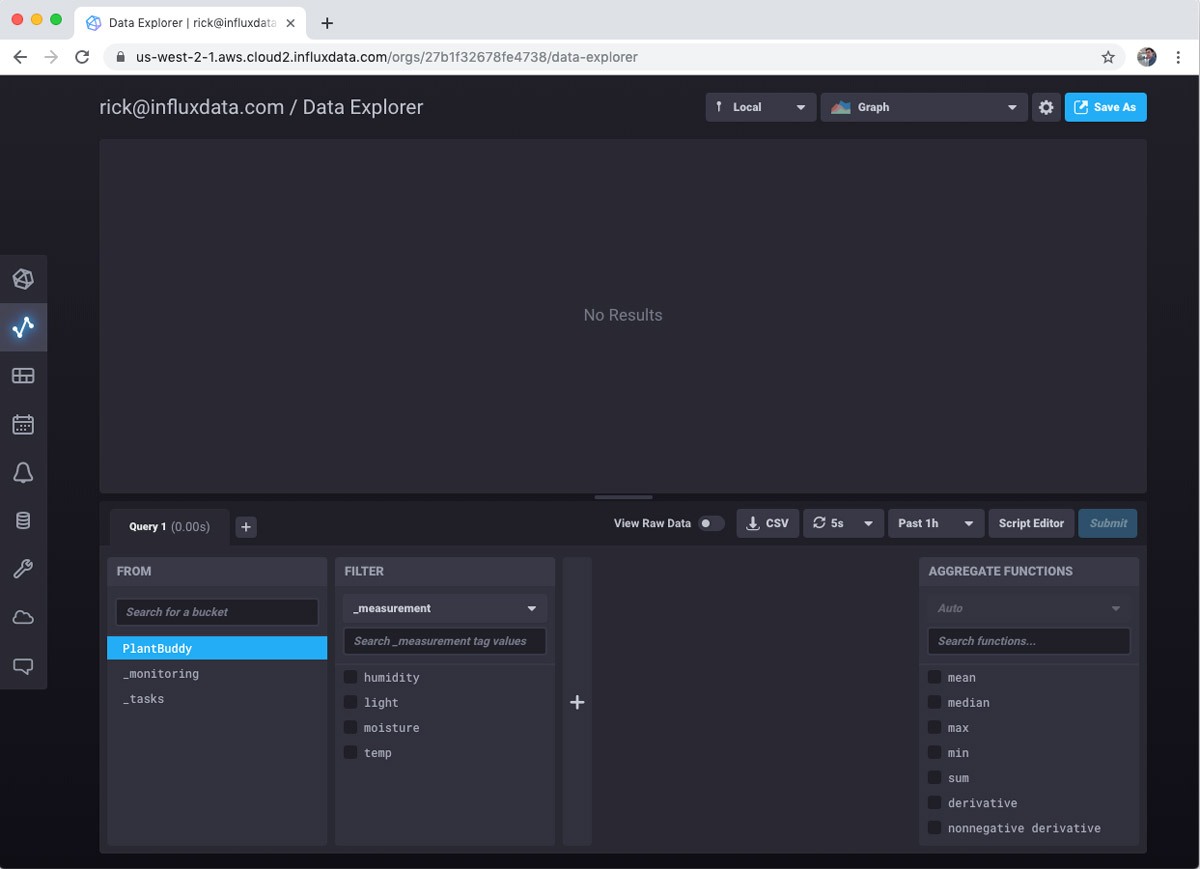
Then you can choose measurement and fields you want to visualize. For this example I care most about soil moisture levels, so I will focus on that.
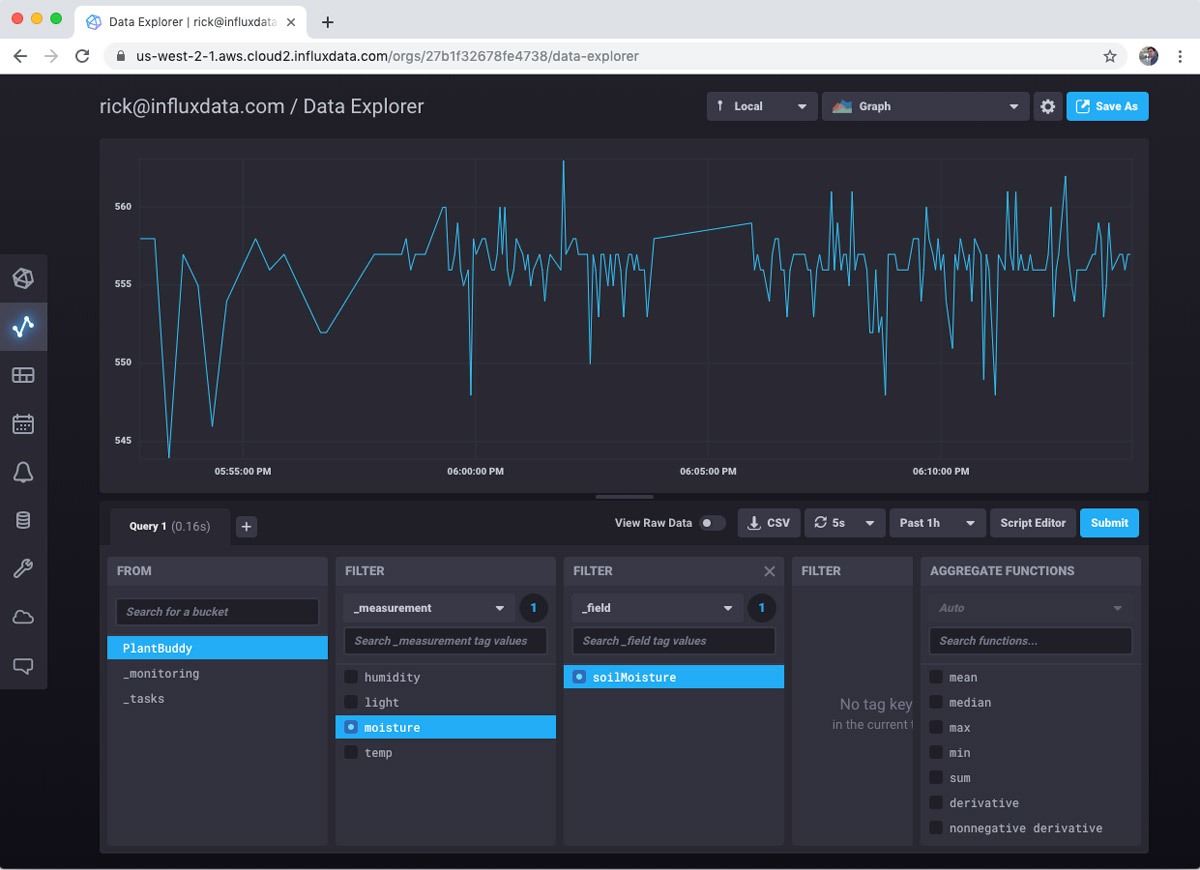
However, you can look at as many measures as you want.
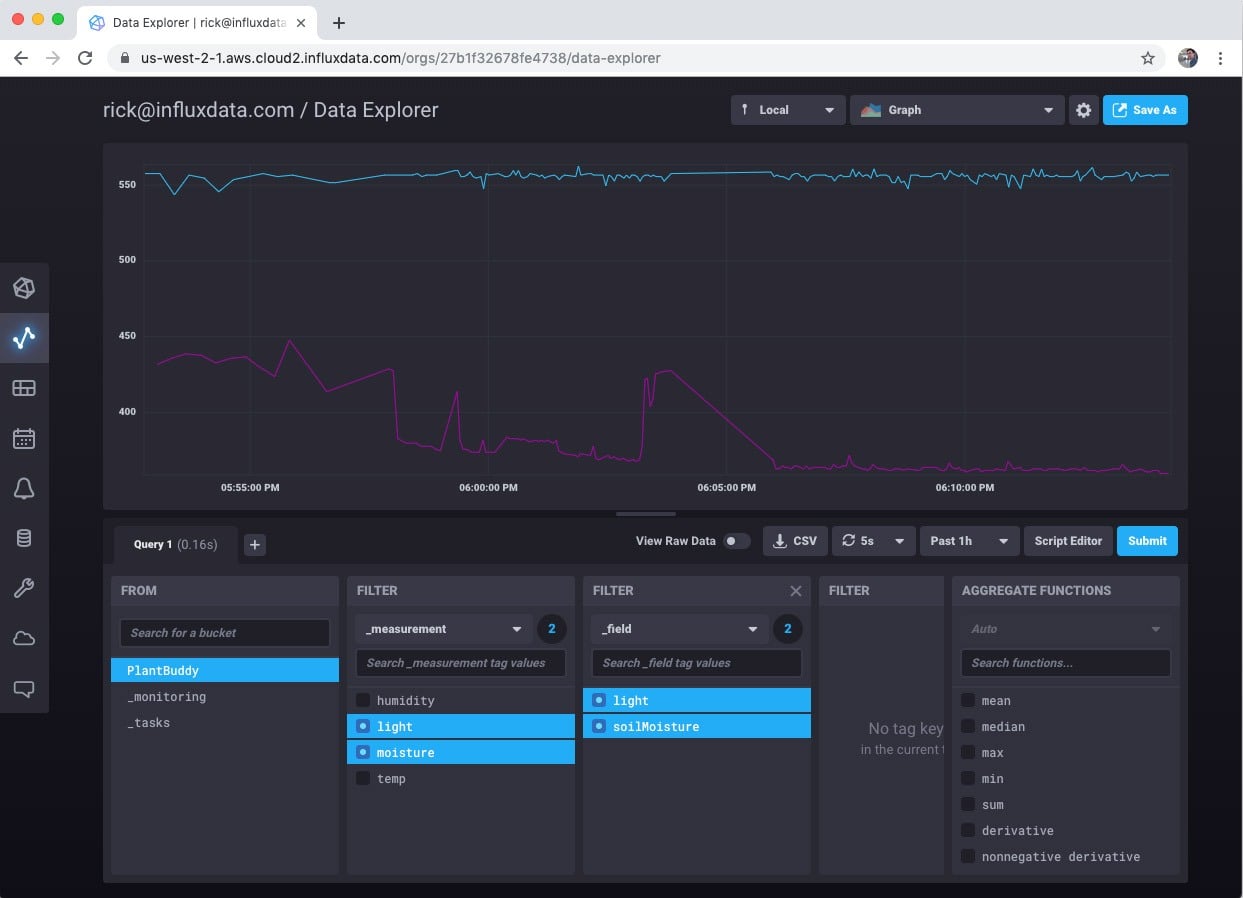
There is also a selection of other interesting visualizations that you can choose.
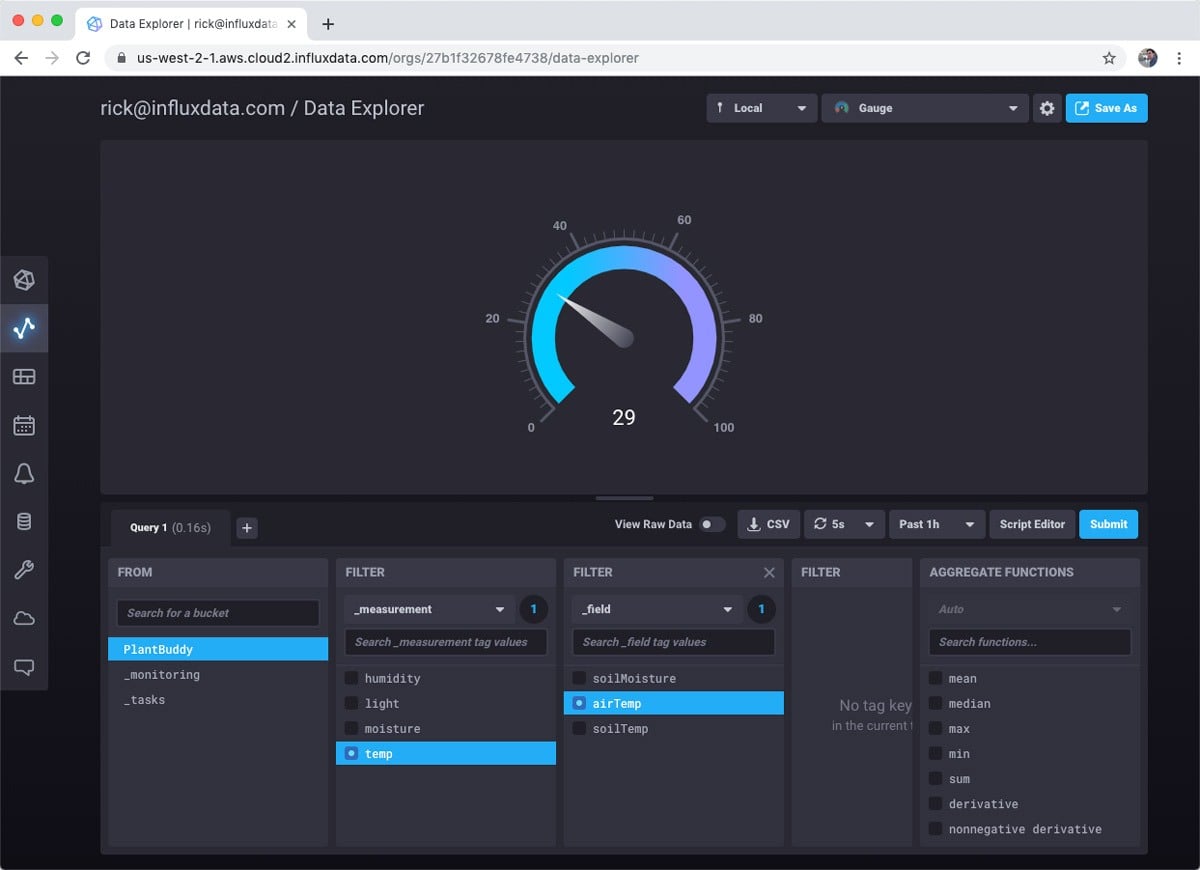
So, pretty cool. With basically no effort, I can visualize my sensor data.
Alerts and notifications
It’s nice that I can visualize the data, but it would be good to know when I need to water the plant. The free tier comes with Slack alerts built-in, so I will use that.
First I need to set up Slack to receive an alert. I already have a personal Slack server, so I’ll just use that.
Setting up Slack to receive a webhook callback is well-documented, so I won’t cover that here. In summary you create a Slack app, and in the Slack settings, you get an incoming webhook URL. Mine looks like this: https://hooks.slack.com/services/TN5S4A6L8/BN5SHN78Q/VOlsxxxxxxxxx
To use the webhook, all I have to do is:
- Create a set of notification levels
- Create alerts for the levels
- Customize the message if I wish
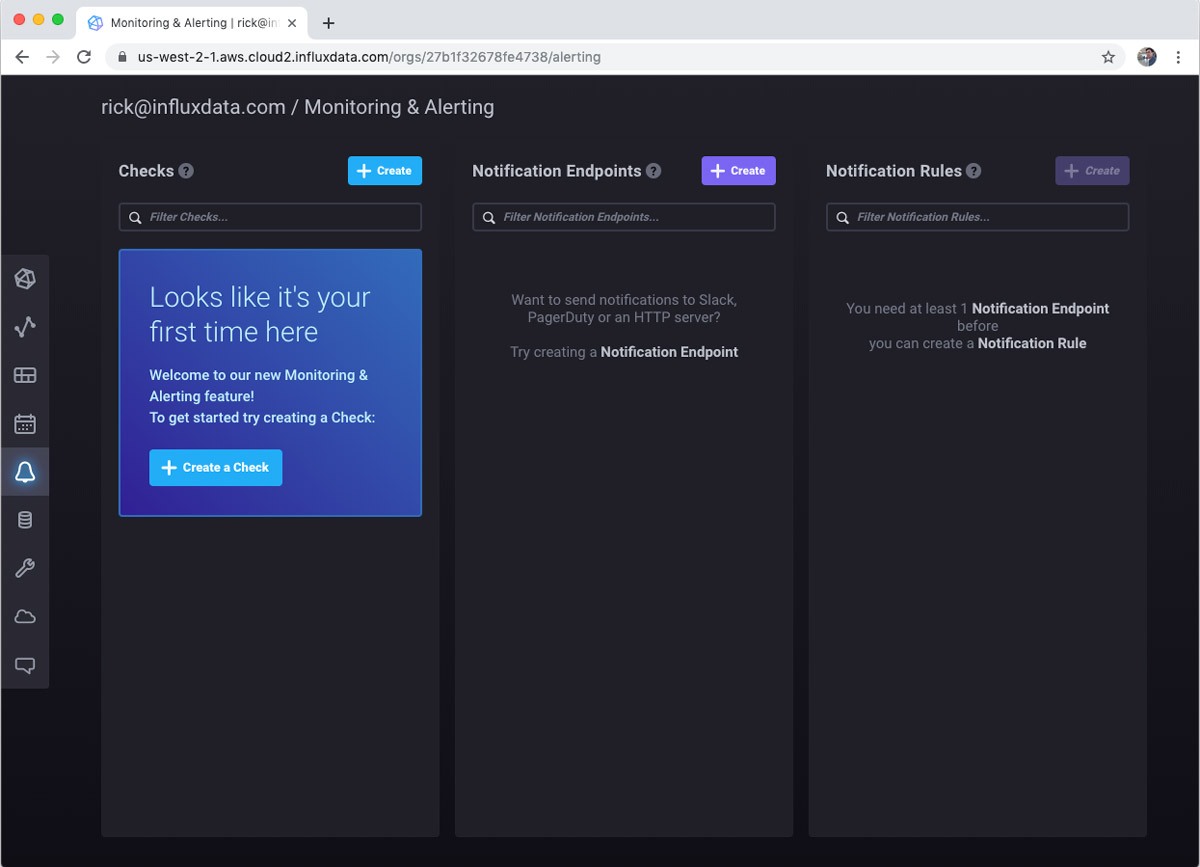
First is to select Monitoring & Alerting from the left hand nav. Since I don’t have any alerts set up, I am prompted to get started.
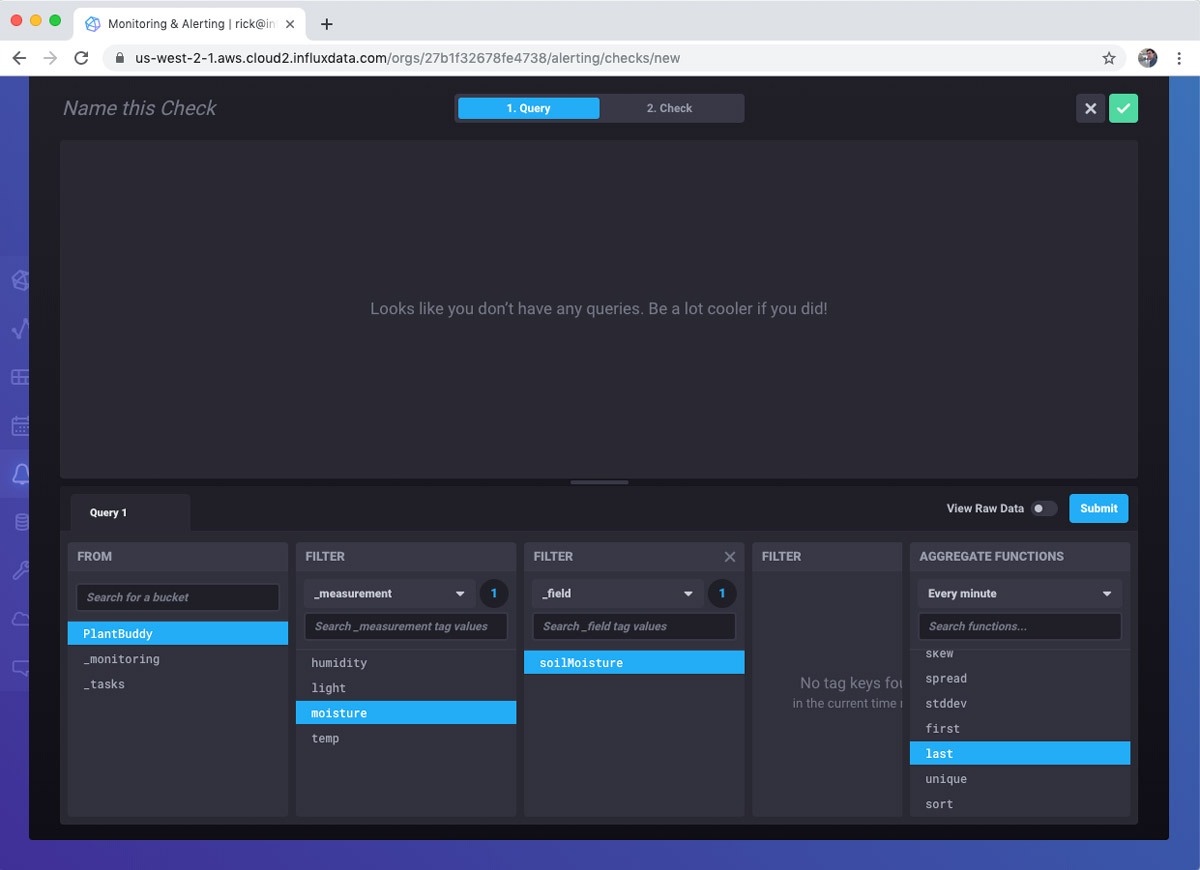
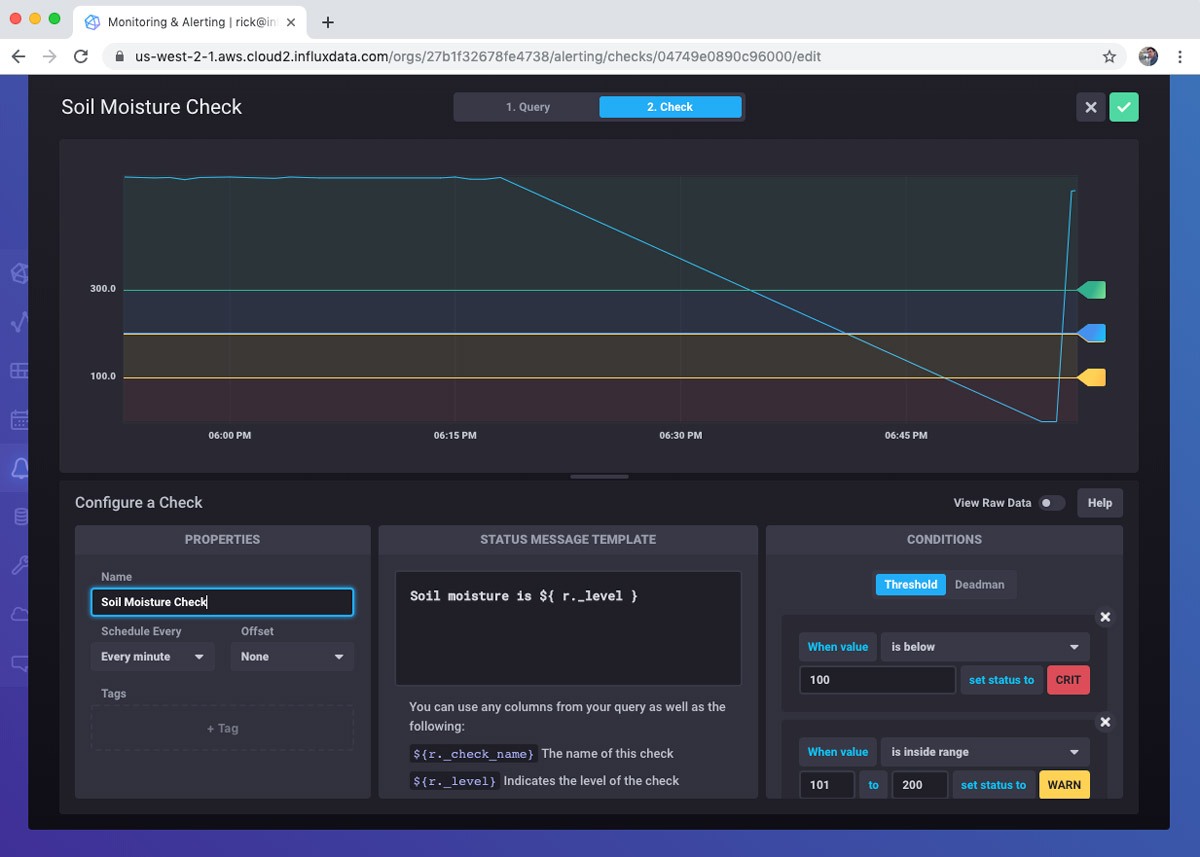
Next, I create a query for the check. Essentially, what do I want to monitor? I am simply going to read the last soil moisture reading.
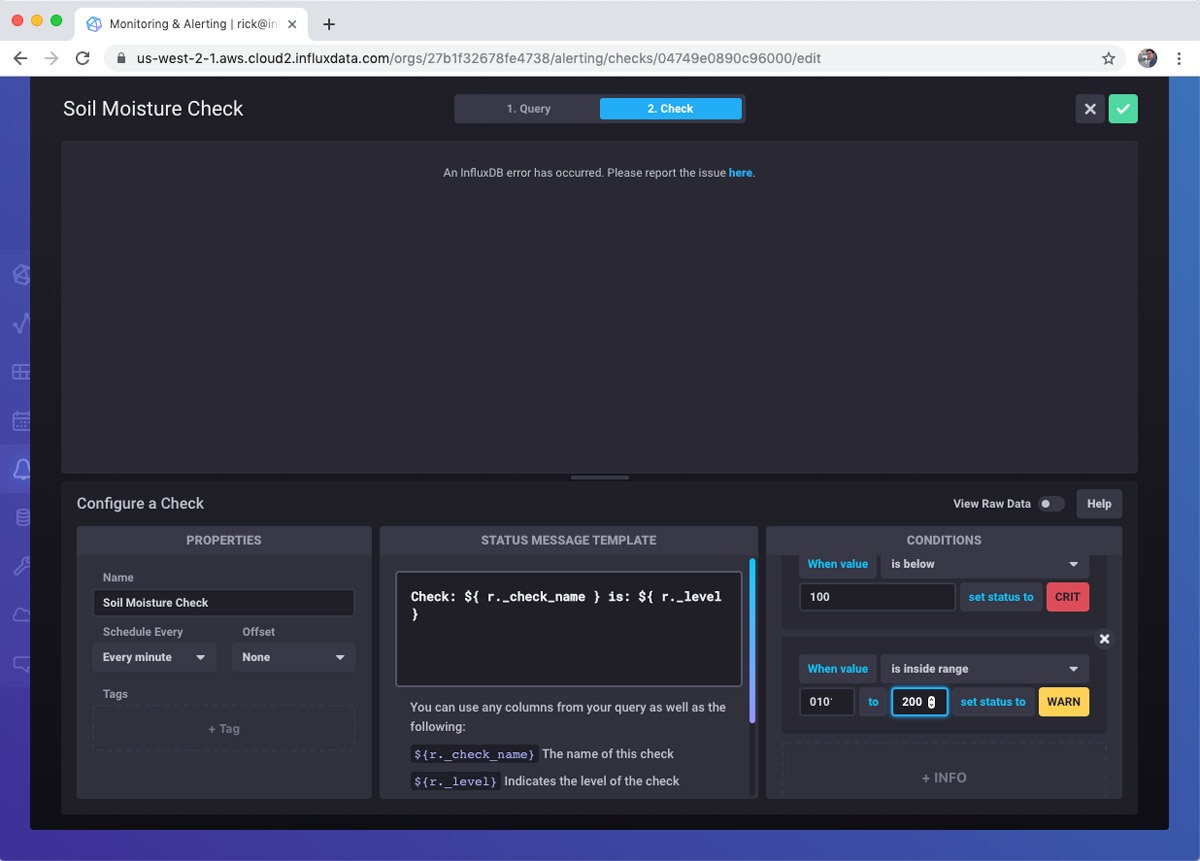
After building the query, I define the check. This involves how often to run the check as well as the notification levels. InfluxDB 2.0 comes with built-in notification levels. If these don’t suit your particular scenario, don’t worry, you can use the Tasks feature to do highly custom interactions. I set the different notification levels from Ok to Critical. Critical is a moisture reading level below 100.
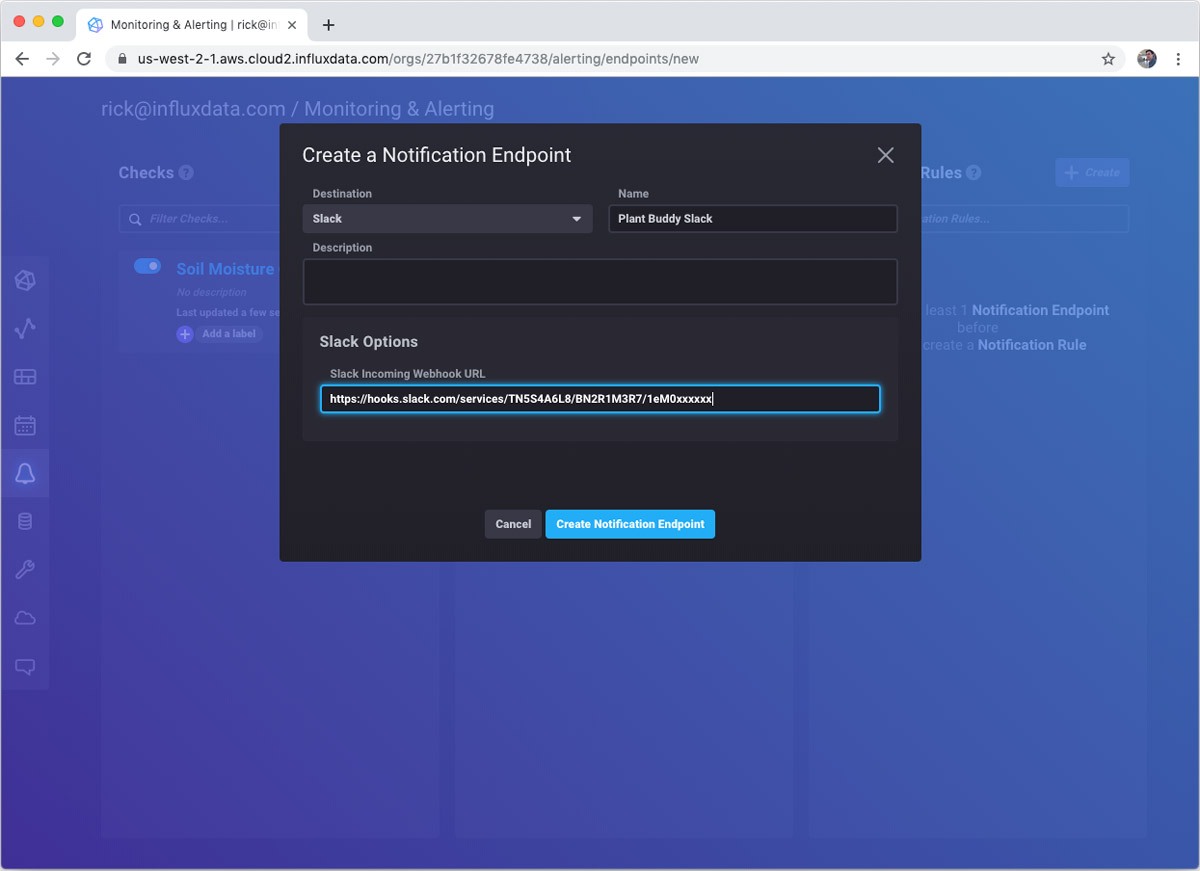
Next I create a Notification Endpoint. I just use the webhook URL that I made from my Slack app.
Finally, I make the notification rule itself. As you can see, I configured it to send a notification every minute when the soil moisture level is critical.
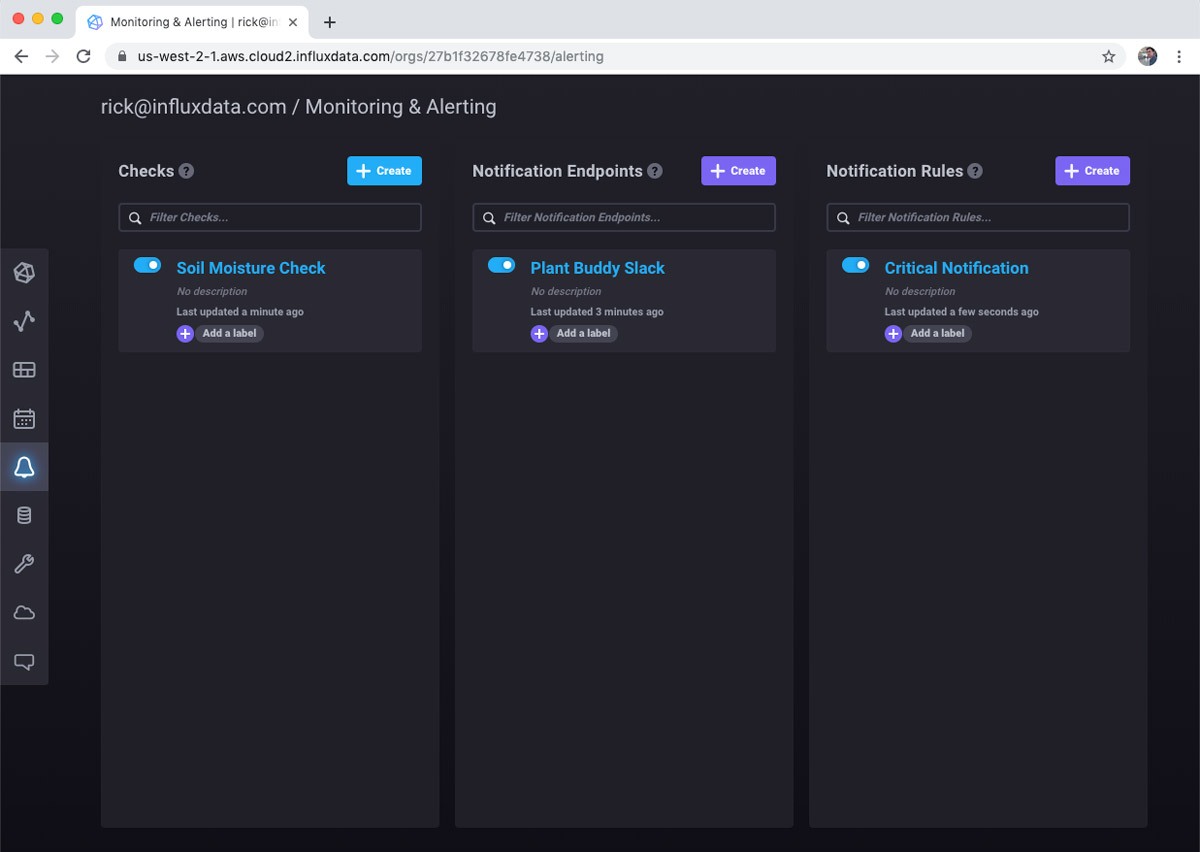
There are other types of checks that are important. For example, I can create a “deadman” notification that alerts me that Plant Buddy stops sending data.
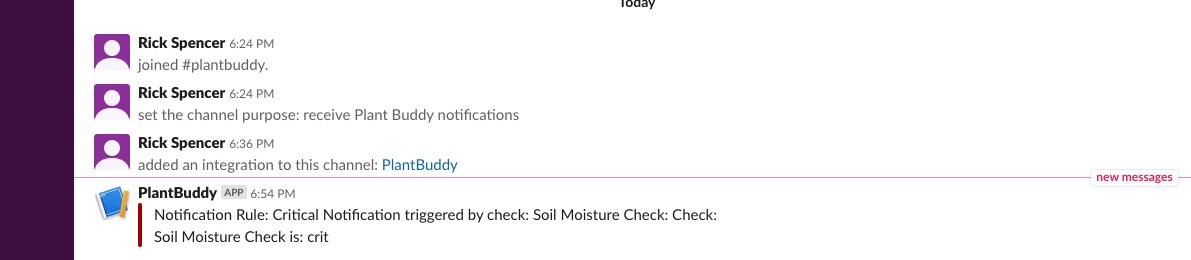
Meanwhile, if I pull the sensor from the soil, you can see that the soil moisture level crashes.
I also got notified in Slack as expected. And will continue to get notified every minute until I solve the problem.
The Check and Notification Rule both have templates for the messages, which you can customize in different ways. I changed them to the following:
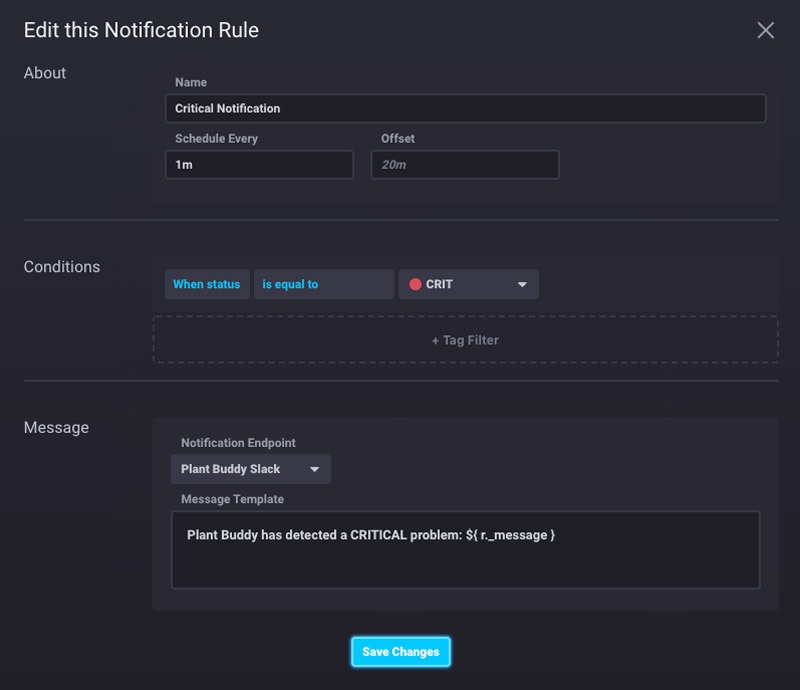
This results in a nicer message in Slack.
![]()
Conclusion
This post covered how easy and fun it is to use InfluxDB Cloud 2.0 to prototype an IoT device using the free tier.
- Totally serverless. I had zero infrastructure to manage.
- Totally easy. All the tools and the UI were intuitive and easy to use.
- Powerful. I was able to create a bucket, use a REST API, visualize the data in different ways, and even set up automated alerts.
However, this post barely scratched the surface of everything that InfluxDB 2.0 can do. I didn’t even touch on Telegraf, which makes data collection much more robust and powerful. I didn’t touch on using tags to monitor multiple devices. And, I didn’t even mention Flux, the powerful query language that allows highly customized queries and tasks.
