Querying InfluxDB IOx Using the New Flight SQL Plugin for Grafana
By
Jay Clifford
updated October 13, 2023
Company
Developer
Navigate to:
A quick start guide to installation, configuration, and usage
Grafana has been a staple visualization tool used alongside InfluxDB since its inception. With the release of InfluxDB Cloud powered by IOx, there is now a new way to integrate InfluxDB and Grafana: Flight SQL.
Two of our engineers, Brett and Helen, have been working hard to create a new Grafana plugin called Flight SQL. This open-source plugin allows users to perform SQL queries directly against InfluxDB IOx and other storage engines compatible with Apache DataFusion. This blog post provides a quick start guide to installing, configuring, and utilizing the data source plugin.
Note: If you are looking for an InfluxDB OSS tutorial with either Flux or InfluxQL, check out the following blog.
Installing the plugin
We are currently releasing the Flight SQL plugin for Grafana as an experimental package. To install it, check out the most up-to-date instructions here. Since the package is currently experimental, it is unsigned and requires you to explicitly approve the installation of the plugin (The instructions will help you through this).
Configuring the plugin
To configure the Flight SQL plugin check out the following documentation. My top tip here is to make sure you specify your host URL in the following manner:
us-east-1-1.aws.cloud2.influxdata.com:443
You will find that if you include any protocols or trailing paths after the port, the connection will timeout.
Once you complete the steps in the above documentation, you will receive the following connection success.

Quick Start examples
If you would like to skip some of the manual setups and are familiar with Docker, I also created a repository called InfluxDB-IOx-Quick-Starts. This repository contains a series of Telegraf and Grafana examples deployed using Docker-Compose. To utilize this repository, run the following instructions:
- Clone the repository:
clone https://github.com/InfluxCommunity/InfluxDB-IOx-Quick-Starts.git - Create an environment file within the repository
cd InfluxDB-IOx-Quick-Starts && touch .env - Add the following environment variables to the file:
Note: make sure to remember to only include the __host:port__ like so:export INFLUX_HOST=<INSERT_HOST> export INFLUX_TOKEN=<INSERT_TOKEN> export INFLUX_ORG=<INSERT_ORG> export INFLUX_BUCKET=<INSERT_BUCKET_NAME>
Save Changes.us-east-1-1.aws.cloud2.influxdata.com:443 - Source your newly created environment file:
source .env - Now you can deploy both Telegraf and Grafana using docker-compose:
docker-compose -f system-monitoring/docker-compose.yml up -d
Once the quick start is running, you can access Grafana at http://localhost:3000. You can log in with the default username and password: admin and admin.
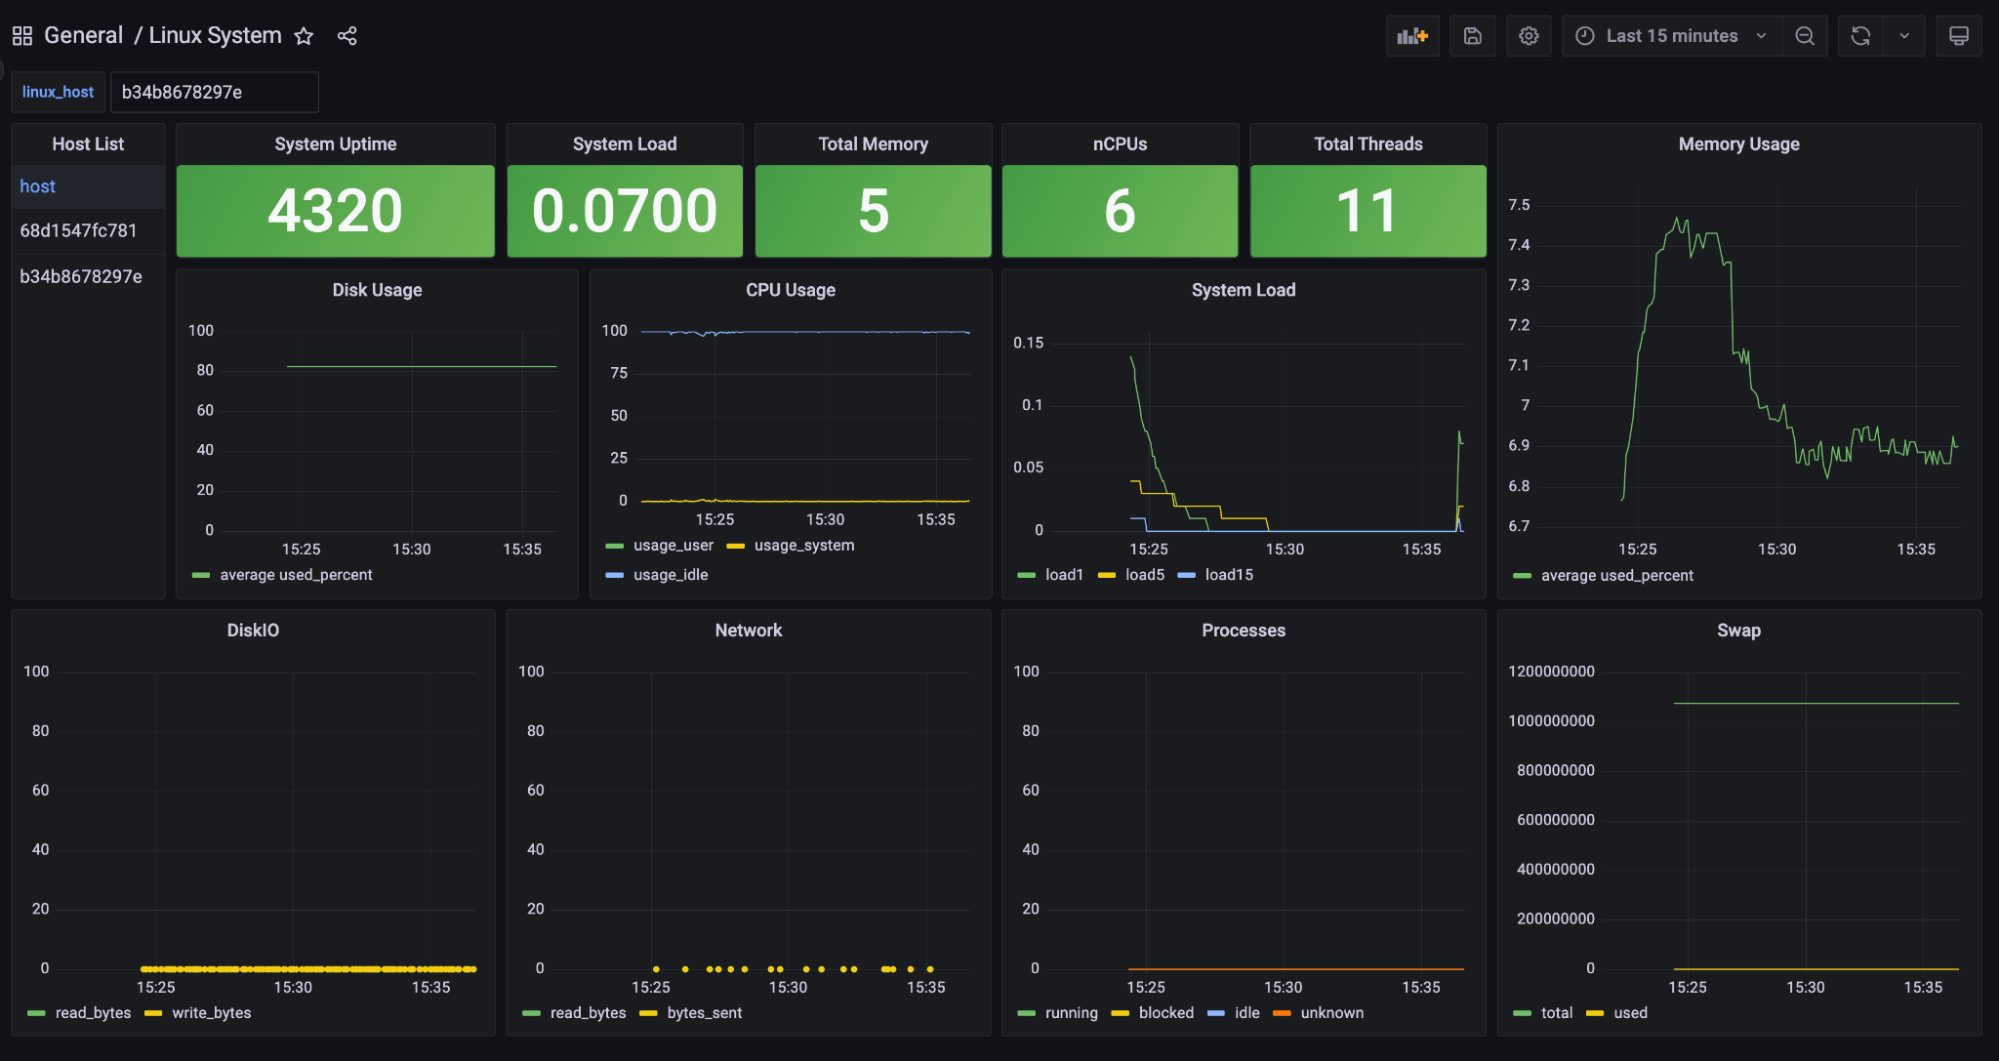
Dashboard overview
Now that we installed and configured the plugin, let’s take a tour of an example Grafana dashboard using the Flight SQL data source. Linux System is a beloved dashboard with the InfluxDB Community, so we will use this dashboard as an example of how to convert Flux to SQL.
Global variables for Flight SQL
Before we move on to the query conversions, it is worth mentioning that there are a series of global Grafana variables you can use to make your queries dynamic and streamlined. Here is a non-exhaustive list:
| Variable | Description |
|---|---|
| $__timeRange(time) | This variable allows you to dynamically set the query time range. For instance, if you selected to see the last 15 minutes of data from the drop-down you would see an equivalent example to the conversion column. Example Conversion: ’2023-01 01T00:00:00Z’ and time <= ’2023-01-01T01:00:00Z’ |
| $__dateBin(time) | This variable is a dynamic short form for creating an interval window, and is useful for aggregation. The interval is set based on the dashboard specification. Example Conversion: date_bin(interval ’30 second’, time, interval ’1970-01-01T00:00:00Z’) |
| $__timeGroup(time, hour) | As we know dateBin is effectively a window period. This gives us a way to reduce the amount of data returned via aggregations or selectors. timeGroup differs by producing projections that can be grouped on.Example Conversion: datepart(’minute’, time),datepart(’hour’, time),datepart(’day’, time),datepart(’month’, time),datepart(’year’, time); |
You can find a full variable list by clicking Show Query Help while constructing your query:

Get the list of hosts
The InfluxDB dashboard introduced a dashboard variable that allowed you to filter based on the hostname tag. Let’s take a look at the conversion.
| Flux | Flight SQL |
|---|---|
|
|
Aggregation Window (Average)
One of the most commonly used functions within Flux is the aggregate window. This allows us to window our time series data by a specific interval (e.g. 30 seconds, 2 minutes, 1 year) and then perform an aggregator (mean, mode, median, etc.) or a selector (max, min, first, last, etc.) function on the windowed data points.
| Flux | Flight SQL |
|---|---|
|
|
Calculating the derivative
Now let’s not beat around the bush here: not all time-based queries are simple within SQL. The derivative of a value with respect to time, also known as the rate of change of the value, is calculated by using the rules of differentiation. The derivative of a function gives us the rate of change of the function at a given point. This requires us to know the previous value as well as the current. Let’s look at an example:
| Flux | Flight SQL |
|
|
For these types of examples, we plan to provide workarounds like this where possible and slowly develop a series of custom SQL functions to handle these complex time series calculations.
Conclusion
I hope this blog post provides enough insight into the new Flight SQL plugin for Grafana to start trialing it. My call to action for you is to start testing the plugin and leaving your feedback within the plugin repository. This will help us improve the overall useability and feature set of the plugin. I would also like to take the time to thank Brett and Helen for their efforts in making an open-source plugin for Flight SQL.
Come join us on Slack and the forums. Share your thoughts — I look forward to seeing you there!
