Telegraf Configuration in InfluxDB 2.0
By
Katy Farmer
updated December 14, 2025
Product
Use Cases
Developer
Navigate to:
Welcome to the time series world of tomorrow, InfluxData 2.0. We’re getting started with 2.0 by explaining the fundamentals. Today, we’re talking about what happens behind the scenes when you configure Telegraf as a data collector.
Collecting data is the first step in creating useful information, which makes it a vital step in any of our systems.
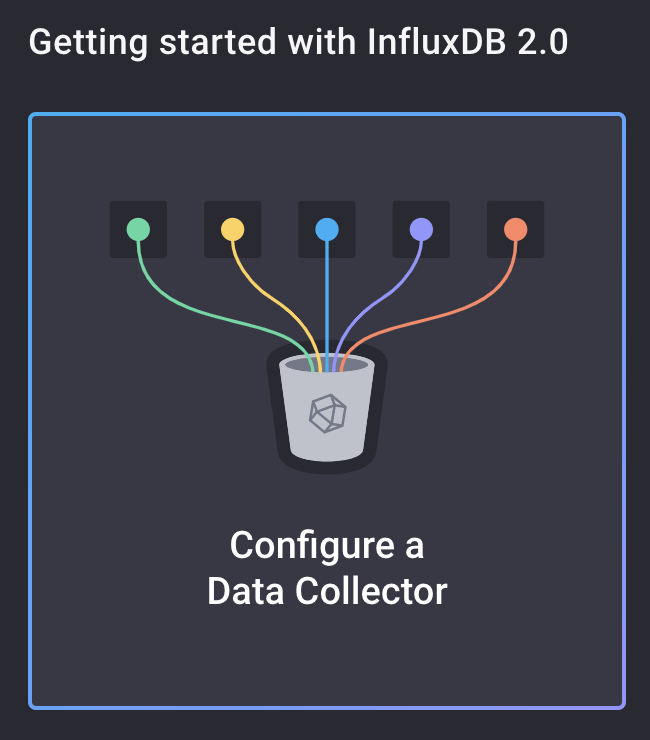 <figcaption> All vital steps should have rainbow connectors, in my opinion</figcaption>
Configuring Telegraf
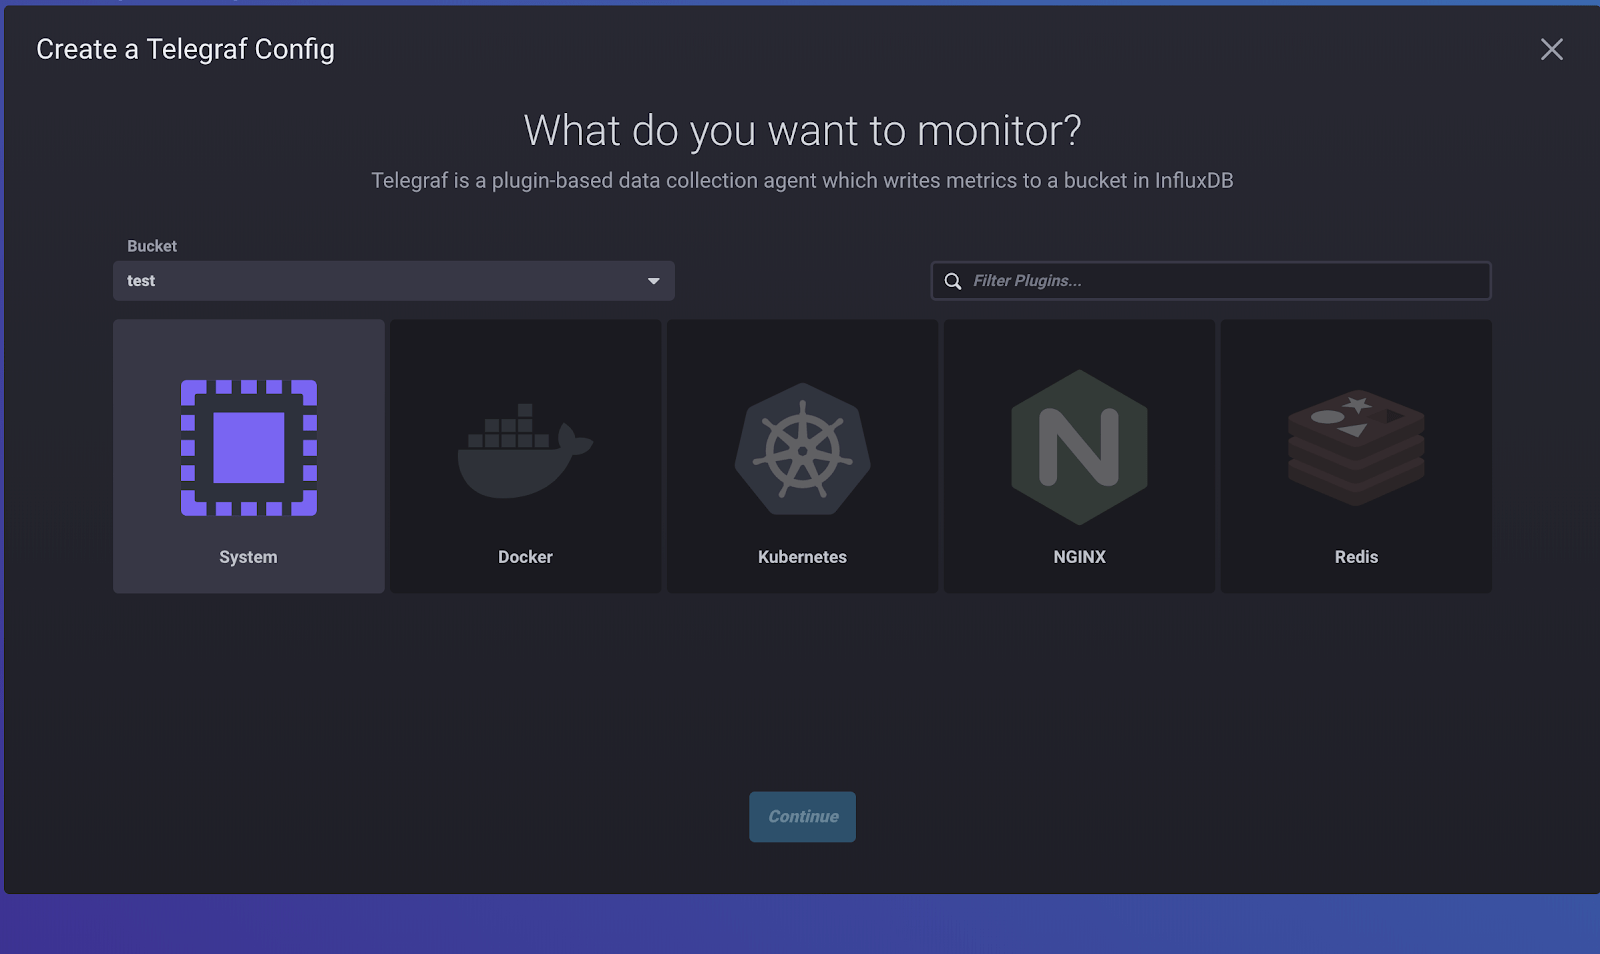
When we click on “Configure a Data Collector”, we’re transported (through the magic of JavaScript) to the ‘Load Data’ page, where we can configure Telegraf.
There’s a whole tab for Telegraf because a lot of people rely on multiple Telegraf configurations to power their data collection. From here we select “Create Configuration”, which gives us a few options for services to monitor that are prebuilt for us. I like to start with System, as it’s easy to set up and verifies that Telegraf is working. We can also specify which bucket we want Telegraf to write to, so we can create a bucket just for these system metrics if we want to. If you don’t see what you want to monitor listed, you can still use Telegraf to gather those metrics, but you won’t be able to use the configurator to do it. We’ve described how to configure Telegraf manually for use with InfluxDB 2.0 here.
On the next step, name your configuration. Again, I usually go for something descriptive like “katy’s system” or “my precious”. If that’s not enough, you can also add a description.
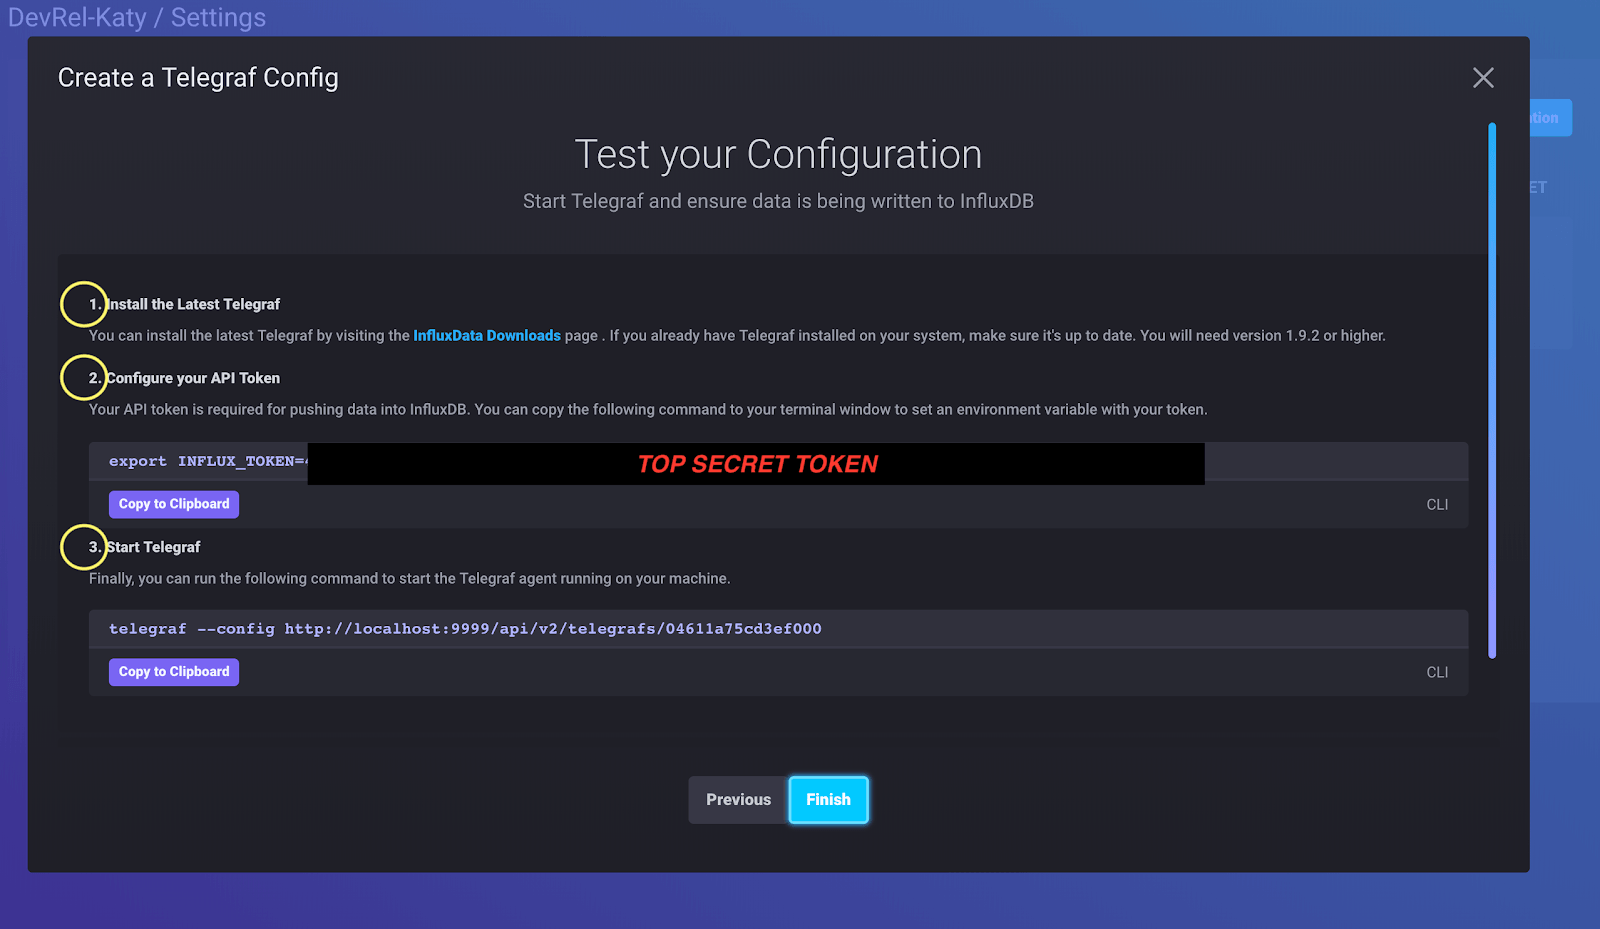
Now that we’ve got the navigation out of the way, we’re on to the juicy part of the Telegraf configuration. On the final step, we have 3 tasks to complete.
- Install Telegraf (must be at least Telegraf 1.9.2). Telegraf remains separate from the InfluxData 2.0 platform so that it can be easily installed and deployed in all of the places we want to monitor. Need help with Telegraf installation? Check out this guide.
- Configure the API token. InfluxDB 2.0 uses token-based authentication, so we need to set an environment variable to store our token. Storing this token gives Telegraf permission to access the InfluxDB API so we can write the data we're collecting into InfluxDB. I use bash, so I saved my token in my
.bashrcfile. - We only have one task left between us and data collection. We need to start the Telegraf service using the right config file. Remember when we chose to monitor "System"? That determined what our Telegraf config file looks like
-
- On the initial Telegraf setup, we can test our connection to make sure data is being written into our bucket. I love this feature because I love confirmation that things have gone correctly, both on my end and the platform.
-
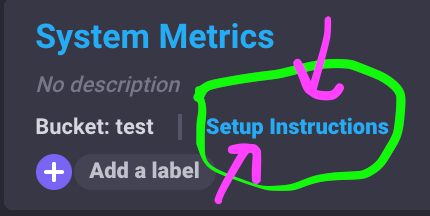
Don’t worry if you move on from this list and need it later we can always see the setup instructions again by clicking the link next to the configuration in the Telegraf tab.
A deeper dive
I love an intuitive UI, and the front-end team at Influx has done a smashing job leading us through configuring Telegraf. So what’s happening behind the scenes? For Telegraf to start sending metrics to InfluxDB, it needs two things: an input plugin and an output plugin. When we configure Telegraf from the UI, it enables the InfluxDB output plugin automatically, so we don’t have to specify the output (we can always change the output plugin later if we need to).
The output portion of the config file should look like this:
[[outputs.influxdb_v2]]
  ## The URLs of the InfluxDB cluster nodes.
  ##
  ## Multiple URLs can be specified for a single cluster, only ONE of the
  ## urls will be written to each interval.
  ## urls exp: http://127.0.0.1:9999
  urls = ["http://localhost:9999"]

  ## Token for authentication.
  token = "$INFLUX_TOKEN"
Although the token is not technically part of the output, we still need it for a successful Telegraf connection.
When we chose “System” as the environment to monitor, a Telegraf config file was generated for us that had a group of input plugins enabled. This includes cpu, disk, diskio, mem, net, processes, swap, and system. All of these help to build a complete picture of the system they are running on. There is no configuration required for this set of input plugins, which means they start collecting metrics right away.
Do you want to know what the input section of the Telegraf config looks like? I’m sure you do.
## Organization is the name of the organization you wish to write to; must exist.
  organization = "DevRel-Katy"

  ## Destination bucket to write into.
  bucket = "test"
[[inputs.cpu]]
  ## Whether to report per-cpu stats or not
  percpu = true
  ## Whether to report total system cpu stats or not
  totalcpu = true
  ## If true, collect raw CPU time metrics.
  collect_cpu_time = false
  ## If true, compute and report the sum of all non-idle CPU states.
  report_active = false
[[inputs.disk]]
  ## By default stats will be gathered for all mount points.
  ## Set mount_points will restrict the stats to only the specified mount points.
  # mount_points = ["/"]
  ## Ignore mount points by filesystem type.
  ignore_fs = ["tmpfs", "devtmpfs", "devfs", "overlay", "aufs", "squashfs"]
[[inputs.diskio]]
[[inputs.mem]]
[[inputs.net]]
[[inputs.processes]]
[[inputs.swap]]
[[inputs.system]]
If we had chosen Redis, for example, we would have to provide some information before it can generate a working config file. If we click on the list of plugins, we can then add any server information or authentication we need to get things up and running.
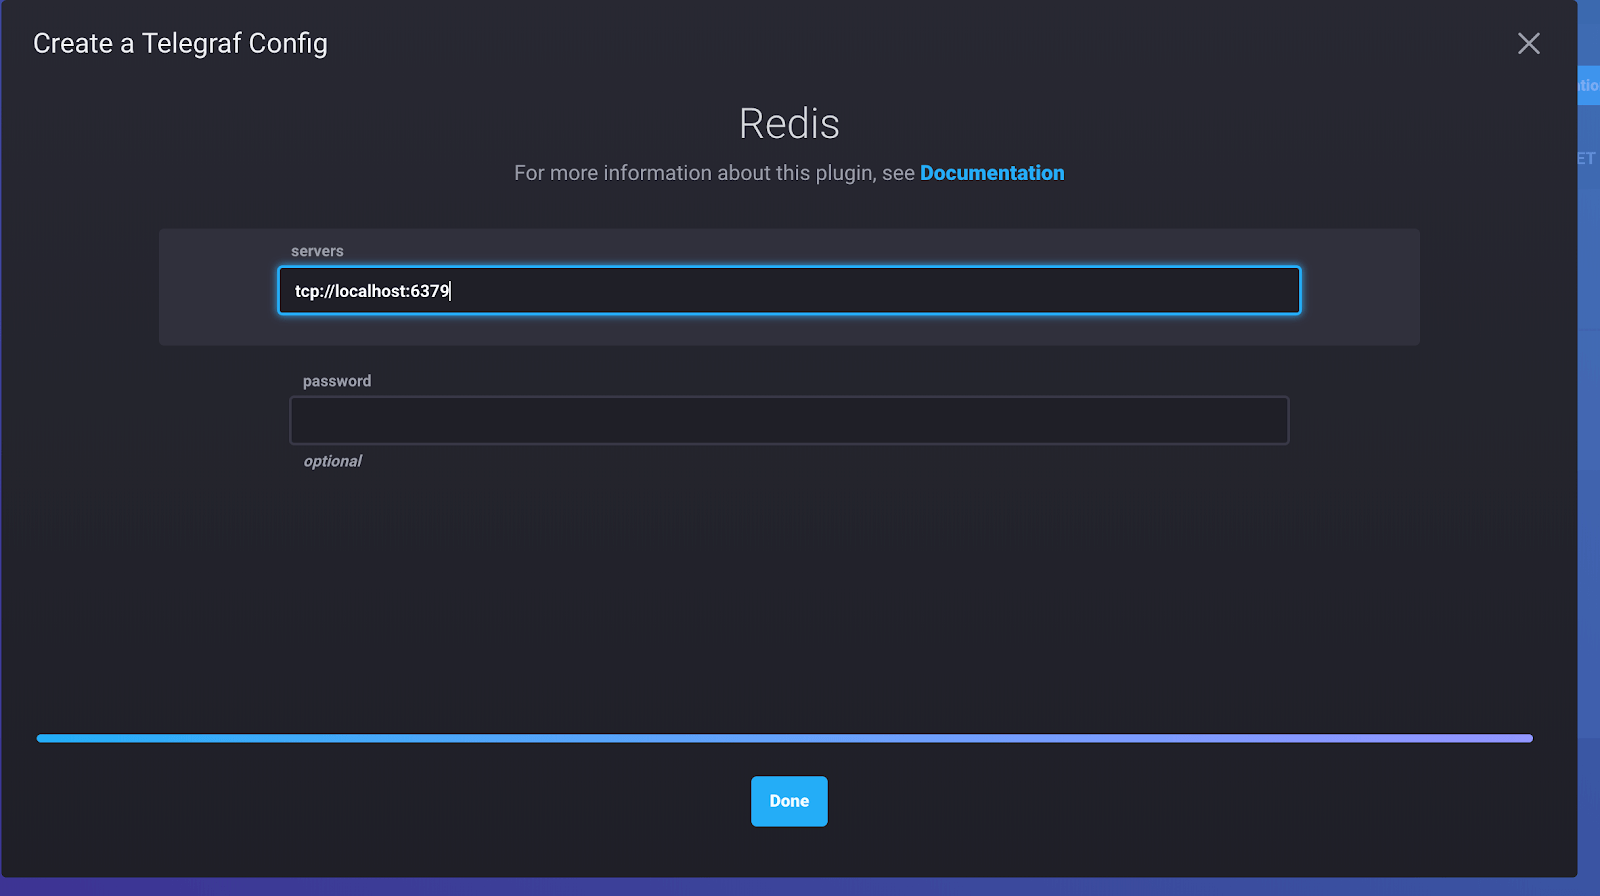 <figcaption> Running things locally since 1987</figcaption>
When we run the command in step 3 (telegraf --config http://localhost:9999/***/***), we’re running the Telegraf service and telling it where to find the config file for the right input and output (in our case, system and InfluxDB, respectively). The config file itself lives within the platform (in BoltDB), which is why the configuration instructions conveniently give us the file’s address. We can also view the actual toml file by clicking the name of the Telegraf config (in the Telegraf tab) and even download it for safekeeping or reuse.
If we make changes to our Telegraf config after we’ve started collecting data, we have to restart the Telegraf service for the changes to take effect. If you can’t remember the instructions for running it, you can visit the Telegraf plugins list to see the instructions again.
Time to awesome
Telegraf remains separate from the InfluxData 2.0 platform so that we can keep using it in all of the places we find useful; after all, it’s nice to have an open source agent to rely on. The goal in 2.0 is to make sure that we’re maximizing developer happiness, which means that integrating Telegraf with the platform should be as easy as 1, 2, 3.
 <figcaption> See what I did there?</figcaption>
