Using A Telegraf Gateway
By
Rick Brown
Nov 18, 2019
Use Cases
Product
Developer
Navigate to:
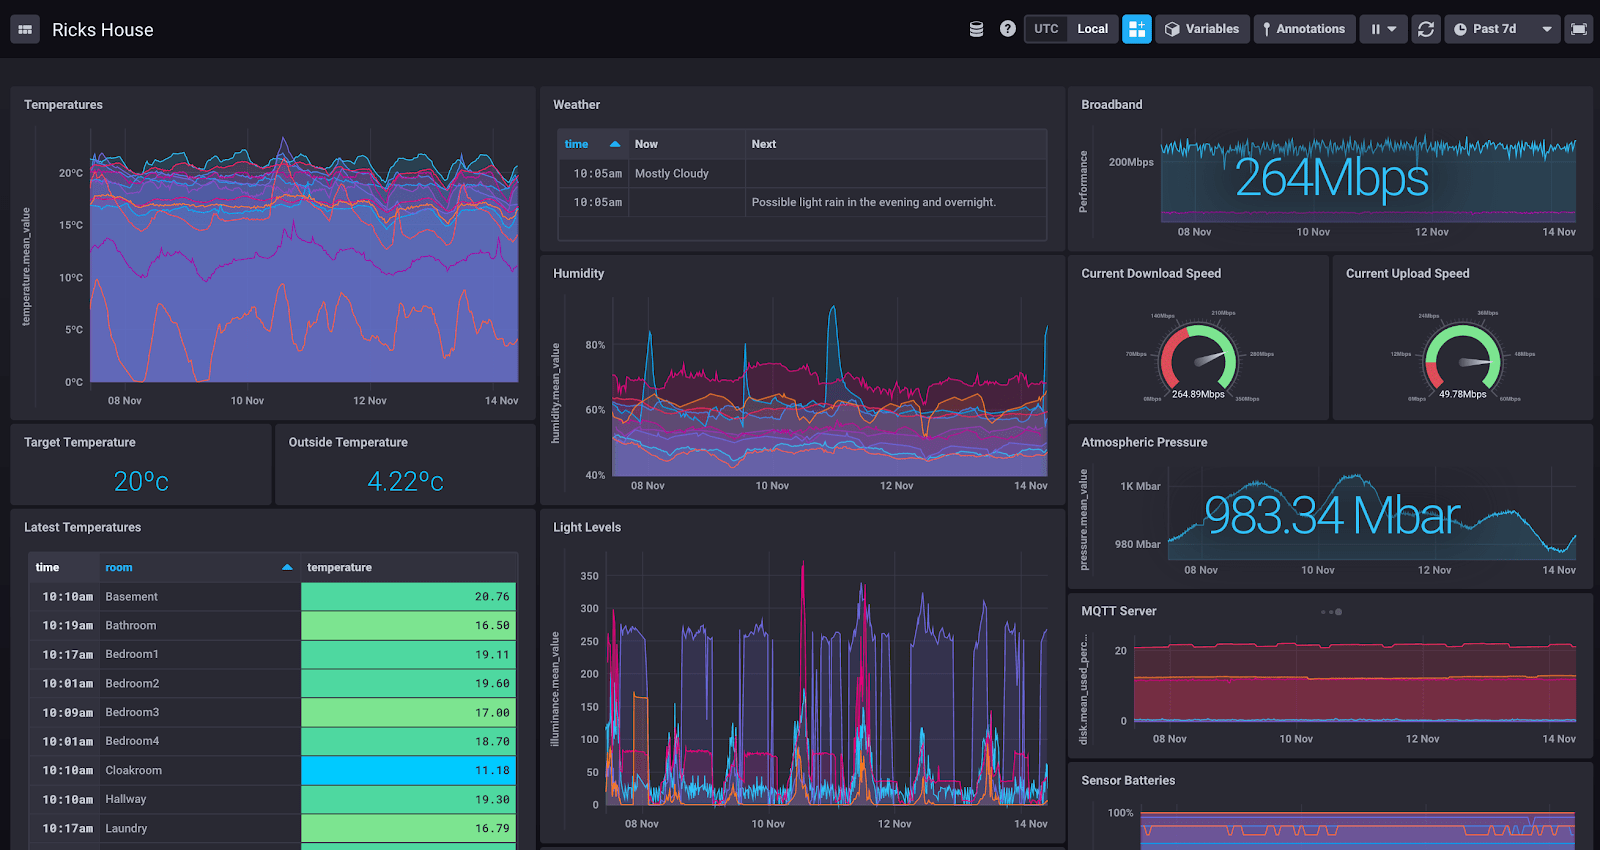
If you meet InfluxData at a trade show, or we provide you with a demo, you might be shown the dashboard called “Rick’s House”. I’m that “Rick”, and this is how I’m sending my data to InfluxDB Cloud, which currently looks like this:
My home network contains numerous servers (many of them LXC containers in Proxmox), lots of software components (Node-Red, MQTT, MariaDB, etc), and a variety of smart-home sensors (SmartThings, Xiaomi, IKEA). It’s grown over many years, and I now find that I want to monitor the whole set-up in one place, because without monitoring everything I can’t visualize what’s happening, and without visualizing what’s happening, it’s difficult to understand what automations to execute or what maintenance I might need to do. It’s been a long-running vanity project, and I discovered InfluxDB during my journey. It’s partly because I found my “time to awesome” was so fast when implementing the software that I applied to join InfluxData!
So, I want to visualize my home network from data stored in InfluxDB. I want everything to write directly into my local instance of InfluxDB OSS, but I also want to be able to write to remote instances, such as InfluxDB Cloud. I also want this to be usable for larger use cases than mine. To do this, there are some restrictions:
- InfluxDB Cloud can only accept HTTP ingest. Any UDP messages (Proxmox writes UDP to an InfluxDB endpoint) will be dropped before they get through the Internet.
- Usernames and passwords might change, so I will need to edit every Telegraf configuration file on every machine on my LAN.
- Access tokens might change over time (especially as I migrate to InfluxDB Cloud v2), so I will need to edit every Telegraf configuration file on every machine on my LAN.
- I've had instances in corporate networks where I had to go through long security processes to open an outgoing TCP port from a host in a data centre. If I need to do this for many hosts in order to get Telegraf data sent to a remote InfluxDB, the elapsed time for security clearance would be correspondingly longer.
- I want to be efficient sending data to remote instances of InfluxDB. This means that I should look at concepts like batching my outputs. If I write to InfluxDB with a Telegraf Gateway, batching and associated settings can be configured in that collator, and those settings are used for all writes. If I write directly to InfluxDB from client libraries, each one might have a different mechanism for batching, so I'll need to configure it in multiple places.
If I can collate all my updates into one place, all the administration of the points above goes away.
Therefore, implementing an interstitial instance of Telegraf a Telegraf Gateway is a good solution for these use cases. To create it, I’ll need to do some things:
-
- Install a container for Telegraf
- Enable Telegraf inputs for UDP & HTTP
- Enable Telegraf outputs for wherever I'll be writing my data
So, I need to create a configuration for my Telegraf gateway.
Telegraf reads default configurations from /etc/telegraf/telegraf.conf and /etc/telegraf/telegraf.d/.conf, so let’s create these.
Firstly, here is my /etc/telegraf/telegraf.conf for global settings
[[global_tags]]

[[agent]]
  interval = "10s"
  round_interval = true

  metric_batch_size = 1000
  metric_buffer_limit = 10000

  collection_jitter = "3s"
  flush_interval = "10s"
  flush_jitter = "5s"

  precision = ""

  debug = false
  quiet = false

  logfile = "/var/log/telegraf/telegraf.log"
  logfile_rotation_interval = "0d"
  logfile_rotation_max_size = "1MB"
  logfile_rotation_max_archives = 5

  hostname = ""
Now some specific config files for providing endpoints for Telegraf to act as an InfluxDB server:
/etc/telegraf/telegraf.d/socket_listener.conf
[[inputs.socket_listener]]
  service_address = "udp://:8089"
/etc/telegraf/telegraf.d/influxdb_listener.conf
# Influx HTTP write listener
[[inputs.influxdb_listener]]
  service_address = ":8086"

  read_timeout = "10s"
  write_timeout = "10s"

  max_body_size = "500MiB"
  max_line_size = "64KiB"

  database_tag = "bucket_name"
Note the use of database_tag = "bucket_name" in the config above. When I write directly to an InfluxDB HTTP endpoint using its URL, which I do from Node-Red, I select a database to write to. I don’t want to lose this information, so Telegraf stores it in a tag called bucket_name. Of course, I don’t want that sent as a tag to InfluxDB, because it’ll increase my cardinality for no purpose, so the output configuration will need to remove it. Telegraf does this by the configuration line exclude_database_tag = true. Here’s the output configuration:
/etc/telegraf/telegraf.d/output_influxdb.conf
# Local InfluxDB
[[outputs.influxdb]]
  urls = ["http://ip_address_of_local_InfluxDB_server:8086"]
  database_tag = "bucket_name"
  exclude_database_tag = true

# SE Cloud
[[outputs.influxdb]]
  urls = ["https://FQDN_of_Influx_Cloud:8086"]
  database = "database_name_to_write_to"
  username = "my_username"
  password = "my_password"
  timeout = "30s"

# Cloud 2 instance
[[outputs.influxdb_v2]]
  urls = ["https://FQDN_of_Influx_Cloud_2"]
  token = "The_Token_Generated_within_Influx_Cloud_2"
  organization = "my_registered_email_address_on_Influx_Cloud_2"
  bucket = "my_bucket_to_write_to"
At this point, this gives me a working Telegraf gateway. However, it also gives me an extra thing to monitor on my LAN, so capturing internal Telegraf metrics seems like the thing to do. As this is a LXC container, and I want to monitor all my containers in the same way, I should add my usual set of OS monitoring configurations. I shouldn’t enable SMART monitoring or temperature monitoring, as those should come from the underlying server on which I’m running the container. Additionally, if this was a Windows machine rather than a LXC container, I would want to replace “processes” and “system” with “win_processes” and “win_perf_counters”. These are the defaults that I try and use with every server I include in my dashboards:
/etc/telegraf/telegraf.d/cpu.conf
[[inputs.cpu]]
  percpu = true
  totalcpu = true
  collect_cpu_time = false
  report_active = false
/etc/telegraf/telegraf.d/disk.conf
[[inputs.disk]]
  ignore_fs = ["tmpfs", "devtmpfs", "devfs", "iso9660", "overlay", "aufs", "squashfs"]

[[inputs.diskio]]
/etc/telegraf/telegraf.d/internal.conf
[[inputs.internal]]
  collect_memstats = true
/etc/telegraf/telegraf.d/kernel.conf
[[inputs.kernel]]
  # no configuration
/etc/telegraf/telegraf.d/mem.conf
[[inputs.mem]]
  # no configuration
/etc/telegraf/telegraf.d/net.conf
[[inputs.net]]/etc/telegraf/telegraf.d/swap.conf
[[inputs.swap]]
  # no configuration
The final two sections are for capturing Linux metrics - see the equivalents mentioned above for Windows metrics.
/etc/telegraf/telegraf.d/processes.conf
[[inputs.processes]]
  # no configuration
/etc/telegraf/telegraf.d/system.conf
[[inputs.system]]
  ## Uncomment to remove deprecated metrics.
  # fielddrop = ["uptime_format"]
So now Telegraf will write to all three of my outputs, collating data from all three of the types of input I commonly use (Telegraf, HTTP custom endpoint, UDP).
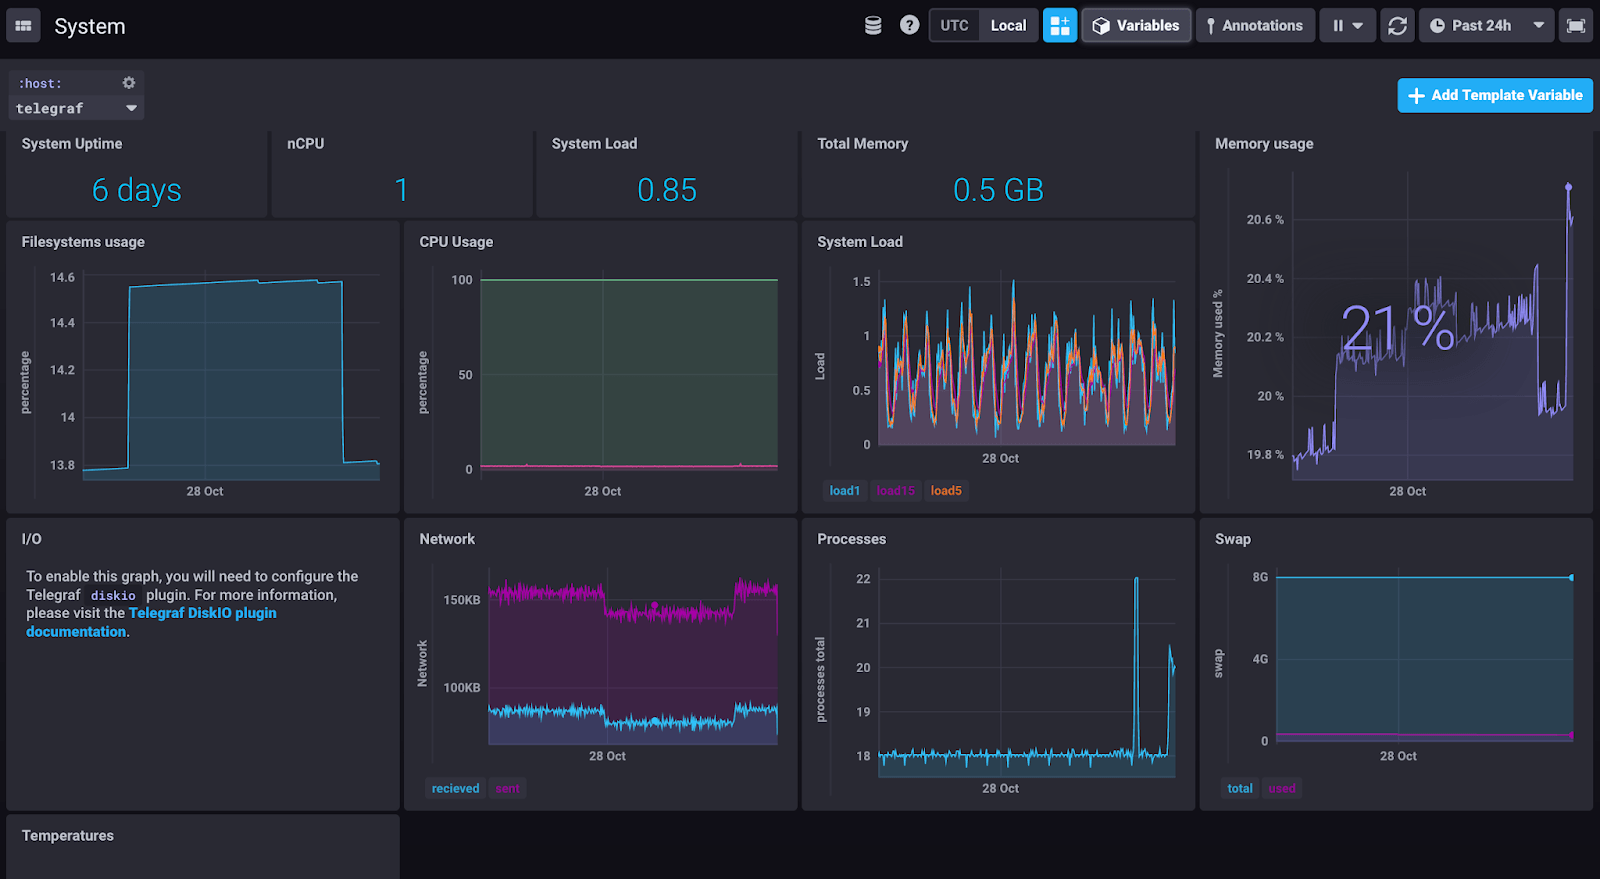
This is what my Telegraf gateway looks like, showing a system view:
I’ll be running my Telegraf implementation like this for a while, to see if this meets my needs as-is, or if it needs extra configuration. If you deploy Telegraf like this, or use alternative ways to get your data through Telegraf into InfluxDB, let me know - I’m interested in Telegraf deployment patterns!
