WP Engine Uses InfluxDB to Power Observability on a Global Scale
By
Jason Myers
updated December 14, 2025
Product
Use Cases
Developer
Navigate to:
The WP Engine platform provides brands the solutions they need to create remarkable sites and apps on WordPress that drive their business forward faster. It hosts over 1.5 million websites, serving over 175,000 customers in more than 150 different countries, and processes 5.2 billion requests per day. In total, WP Engine’s footprint comprises about 8 percent of the entire web.
Searching for reliability
With those statistics in mind, you can imagine what happened when the company had an outage and its monitoring solution went down at the same time. WP Engine used to pride itself on running one of the largest Zabbix monitoring instances in production, which monitored 15,000 hosts backed by a single Zabbix database. That single database server was a critical failure point for their monitoring during an outage.
To fix this issue, WP Engine developers started looking for alternatives. They needed something that could handle the scale of their data needs on a global level. This meant a solution that supported at least 5 million queries per minute, and trigger alerts every six minutes. They considered Datadog as a turnkey option, but it was cost prohibitive for their business.
Building a custom observability platform
WP Engine built a multi-layered metrics platform. The outermost layer, the Fleet layer, is where WP Engine’s 15,000 hosts exist, spread out across a range of services and cloud providers. WP Engine considered Fluentd for data collection in this layer, but opted for Telegraf because it uses fewer resources and has a large plugin library. WP Engine collects metrics like CPU and memory utilization at both the server and container level, server response time, disk utilization, and more.
Collected data then goes to an aggregation layer, which runs on Kubernetes, where the data gets cleaned and filtered. Clean data then goes to the alerting layer, where a combination of Kapacitor and InfluxDB OSS handle alerts. This layer sends alerts to a variety of endpoints such as Slack, PagerDuty, and Amazon SNS. Kapacitor is also configured to send signals back to the Fleet layer to carry out automatic tasks that don’t require human intervention.
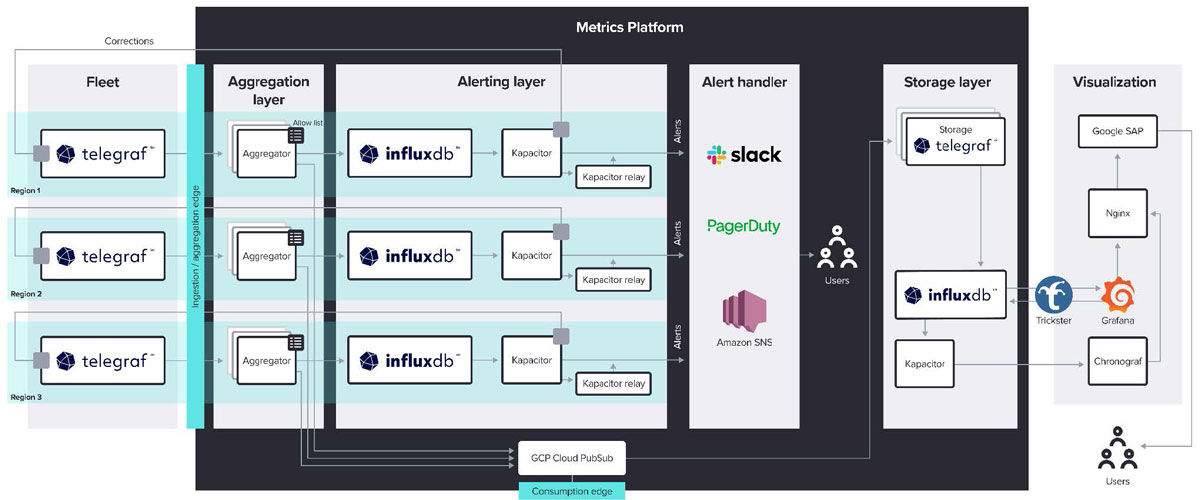
From the aggregation layer, metrics move via Google Pub/Sub to the storage layer, where WP Engine runs six nodes of InfluxDB Enterprise. The data from this central time series storage repository also feeds the visualization layer. WP Engine builds dashboards with Chronograf and Grafana for internal users.
Results
Using this new system, WP Engine created a solution that meets its current needs and has the capability to grow along with the company. The company eliminated the single point of failure issue that existed in its old solution. It also invested in interconnectivity and redundancy with InfluxDB Enterprise. The WP Engine metrics platform ingests 5 million points every minute, twenty times more metrics than the old system, and stores that data in multiple locations. WP Engine thoughtfully migrated to their new alerting system and reduced human cognitive overhead by half.
To learn more about how WP Engine uses InfluxDB, check out the full case study.
