Prometheus System Monitoring Tool
Powerful performance with an easy integration, powered by Telegraf, the open source data connector built by InfluxData.
5B+
Telegraf downloads
#1
Time series database
Source: DB Engines
1B+
Downloads of InfluxDB
2,800+
Contributors
Table of Contents
Powerful Performance, Limitless Scale
Collect, organize, and act on massive volumes of high-velocity data. Any data is more valuable when you think of it as time series data. with InfluxDB, the #1 time series platform built to scale with Telegraf.
See Ways to Get Started
What is Prometheus?
Prometheus is an open source systems monitoring and alerting toolkit originally built at SoundCloud by ex-Googlers who wanted to monitor metrics on their servers and applications. Prometheus joined the Cloud Native Computing Foundation in 2016 as the second hosted project, after Kubernetes. Prometheus is an open source offering that is provided independently from any company and is very popular as the monitoring solution for Kubernetes metrics. Prometheus, like InfluxDB, is written in Go.
How does Prometheus Work as a Monitoring Solution?
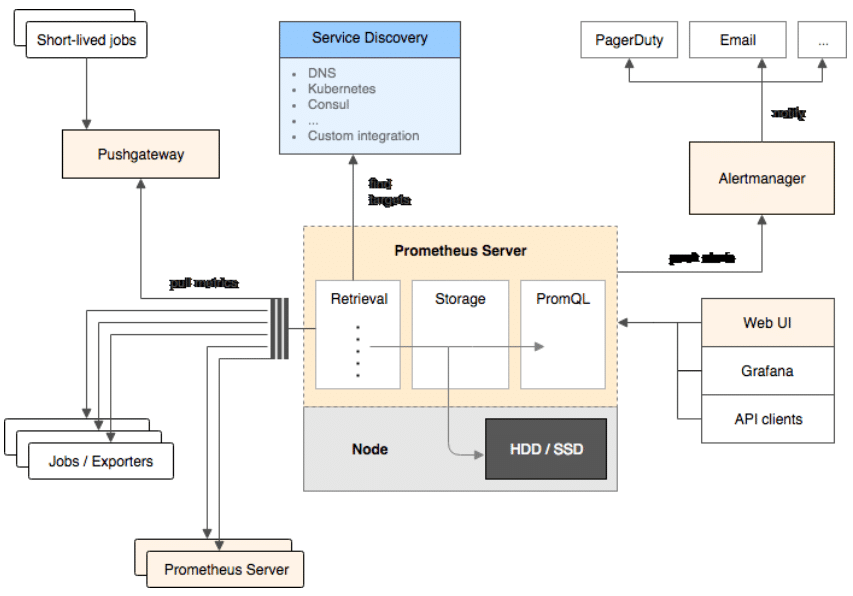
The Prometheus website provides a great overview for the Prometheus Monitoring solution and the underlying time series infrastructure. Basically to monitor your services using Prometheus, your services need to expose a Prometheus endpoint. This endpoint is an HTTP interface that exposes a list of metrics and the current value of the metrics. The Prometheus server then polls the metrics interface on the services and stores the data. This architecture is referred to as polling-based monitoring, or pull-based monitoring.
For Kubernetes environments, the service discovery is well-integrated and Prometheus will poll the metrics endpoints and gather the metrics into the Prometheus Server for monitoring and alerting. The pull approach is nice because it does not require the installation of an agent to collect the metrics, although you still need to deploy "exporters" to expose the metrics from the system you are collecting metrics from.
Push vs. Pull Based Metric Collection and Monitoring
In the pull-based method, the monitoring agent polls the targets being monitored periodically and alerts based on that data. In the push method, telemetry and metrics are pushed to the monitoring agent (or more frequently a time series database), and monitoring is done either through the agent or other processes querying the database. When instrumenting your own application code, there is a choice to be made between push and pull. Either you send metrics out to another service via a client library, or you make them available to others through some network addressable target (like an HTTP API, for example).
The real strength of formalizing the pull method, as Prometheus has done, is that it gives a standard language for services and applications of all kinds to expose targets with a standard format to pull metrics data from. Prometheus has become the standard language for pull-based metrics for Kubernetes.
The primary disadvantage of pull-based methods is that they don't work well for event-driven time series (like individual requests to an API, or events in your infrastructure). Another disadvantage is that all metric endpoints have to be reachable from the server, implying a more elaborate secure network configuration. This can also become an issue for large-scale deployments, or where clustering is required for high availability.
For Kubernetes only, monitoring pull-based metrics collection might be just fine, but for distributed environments, especially in IoT architectures, push-based monitoring is preferable. In most environments, there is usually the need to monitor and alert on both metrics (regular time intervals) and events (irregular time intervals), and it becomes preferable to support both push and pull. This is currently a limitation of Prometheus, but this is where InfluxData's Telegraf and Kapacitor can be used to enhance the Prometheus environment.
Augmenting Prometheus to Support Monitoring Using Push and Pull
All the metrics generated following the Prometheus standard can be read by Kapacitor. This means that any service discovery target that works with Prometheus will work with Kapacitor. In addition, with InfluxDB's native support for the Prometheus remote read and write protocol, Prometheus can be used as the collector and have InfluxDB be its long-term, highly available, scalable data store.
Using Kapacitor to monitor Prometheus scrape targets allows for further streaming analytics, advanced anomaly detection or the ability to add custom logic that gets triggered on the streaming data before it is even stored in the underlying data store.
Prometheus Server Architecture
One of the core values and primary design objectives of Prometheus is simplicity. To achieve this, Prometheus focuses on a single-node architecture and enhances the server to achieve more and more performance in this single-node infrastructure. Prometheus doesn't have clustering in their roadmap probably because of the additional complexity this would create, and this is against their design objective of simplicity.
Augmenting Prometheus for High Availability
InfluxData's InfluxDB has a similar single-node approach with some similar design objectives, but InfluxDB Enterprise includes clustering to support environments where high availability is required. Since InfluxDB Enterprise includes Kapacitor and Telegraf, all the investment in building Prometheus end-points is maintained, but the data can be stored on multiple nodes in a clustered InfluxDB Enterprise deployment. InfluxData is working on a new query language that will support PromQL to further reduce the headache of having to write queries to both data stores.
Conclusion
Using Prometheus for monitoring is a good choice in Kubernetes environments where pull-based monitoring and alerting of metrics are required. For environments that require monitoring or alerting of both metrics and events or where high availability is a requirement, then consider augmenting your architecture to include InfluxData's InfluxDB Enterprise or InfluxDB and Kapacitor. InfluxData will continue to enhance the support for Prometheus going forward. To keep abreast of the latest developments, please follow the project on GitHub.
More Resources:
- Blog: InfluxDB Now Supports Prometheus Remote Read & Write Natively
- GitHub: Prometheus remote read and write API Support
- Blog: InfluxDB and Kapacitor: An Enhanced Data Model and Functional Query Language
- GitHub: Supporting PromQL in InfluxDB's New Query Language
- Press Release: Latest InfluxData Release Introduces Industry's First Advanced Kubernetes Auto Scaling and Prometheus Read/Write Support
- In the News: IoT Innovator | New InfluxData Update Adds Advanced Kubernetes Auto Scaling, Prometheus Read/Write Support
- Press Release: InfluxData Releases Updated Prometheus Support; Selected to Present at KubeCon + CloudNativeCon Europe 2018
- In the News: Container Journal | InfluxData Gives Prometheus Monitoring a Real-Time Analytics Edge
- Blog: Monitoring the Kubernetes Nginx Ingress with the Nginx InfluxDB Module
- Blog: Monitoring Kubernetes Architecture
- Blog: Monitoring with Push vs. Pull: InfluxDB Adds Pull Support with Kapacitor
- Blog: InfluxDB 1.4 Now Available: InfluxQL Enhancements, Prometheus Read/Write, Better Compaction and a lot more!
- Blog: Percona Live Dublin recap
- Blog: Prometheus + InfluxDB: Thoughts After the Austin Monitoring Meetup
- Glossary: Edge Computing
Telegraf Input Plugin Telegraf Output Plugin
Powerful Performance, Limitless Scale
Collect, organize, and act on massive volumes of high-velocity data. Any data is more valuable when you think of it as time series data. with InfluxDB, the #1 time series platform built to scale with Telegraf.
See Ways to Get Started

