Creating an IoT Data Pipeline Using InfluxDB and AWS
By
Jason Myers
updated October 20, 2023
Use Cases
Product
Navigate to:
This post was originally published in The New Stack and is reposted here with permission.
Reliable data pipelines are critical to industry, providing key information about the state of machinery and to train predictive models to improve operations.

The Internet of Things (IoT) and operations technology (OT) spaces are awash in time series data. Sensors churn out time-stamped data at a steady and voluminous pace, and wrangling all that data can be a challenge. But you don’t want to collect a bunch of data and let it just sit there, taking up storage space without providing any value.
So, in the spirit of gaining value from data for IoT/OT, let’s look at how to configure a sensor using InfluxDB and Amazon Web Services (AWS) to collect the type of time-stamped data generated by industrial equipment. You can adapt, expand and scale the concepts here to meet the needs of full industrial production needs. Here’s what we’ll use in the example and why.
- InfluxDB: This time series database just released an updated version that outperforms previous versions in several key areas, such as query performance against high cardinality data, compression and data ingest. Critically for this example, InfluxDB’s cloud products are available in AWS. Having everything in the same place reduces the number of data transfers and data-latency issues in many instances.
- Telegraf: Telegraf is an open source, plugin-based data-collection agent. Lightweight and written in Go, you can deploy Telegraf instances anywhere. With more than 300 available plugins, Telegraf can collect data from any source. You can also write custom plugins to collect data from any source that doesn’t already have a plugin.
- AWS: Amazon Web Services has a whole range of tools and services geared toward IoT. We can tap into some of these services to streamline data processing and analysis.
- M5stickC+: This is a simple IoT device that can detect a range of measurements, including position, acceleration metrics, gyroscope metrics, humidity, temperature and pressure. This device provides multiple data streams, which is similar to what industrial operators face with manufacturing equipment.
InfluxDB and AWS IoT in action
The following example illustrates one of many possible data pipelines that you can scale to meet the needs of a range of industrial equipment. That may include machines on the factory floor or distributed devices in the field. Let’s start with a quick overview; then we’ll dive into the details.
The basic data flow is:
Device → AWS IoT Core → MQTT (rules/routing) → Kinesis → Telegraf → InfluxDB → Visualization
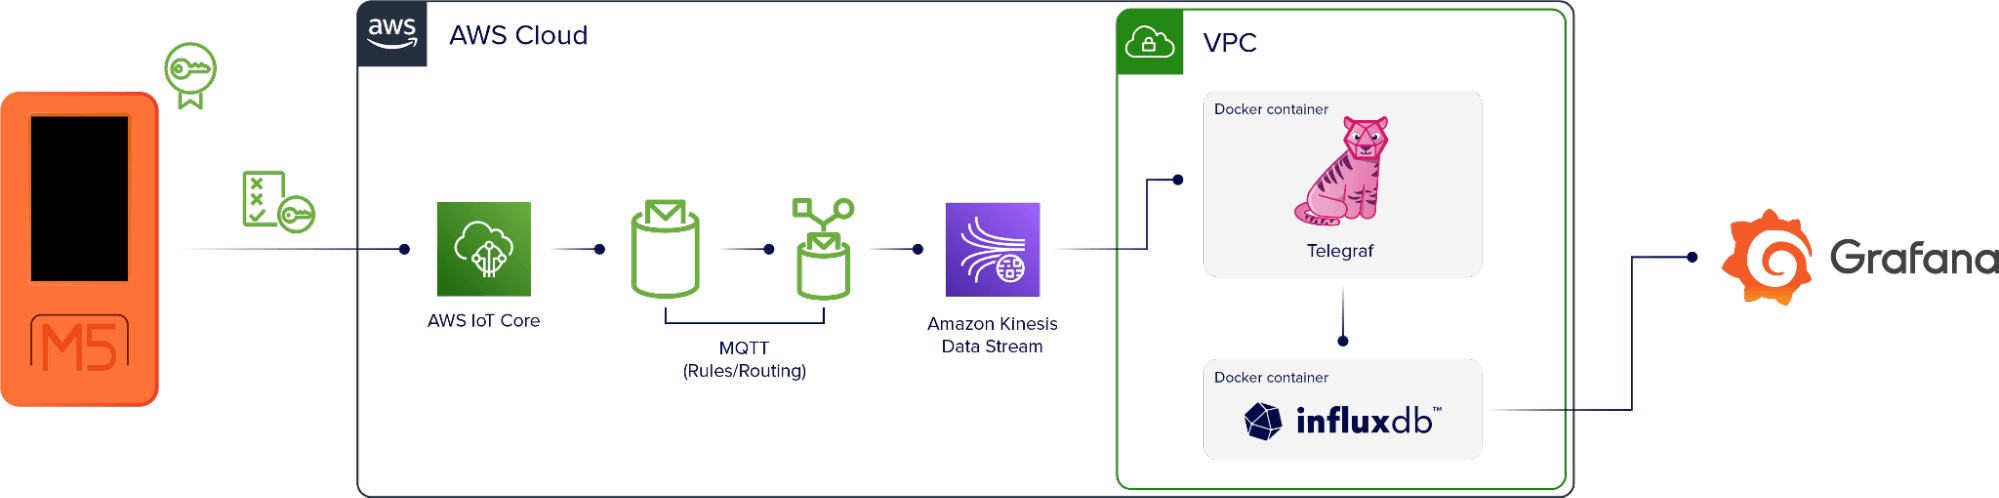
The M5stickC+ device is set up to authenticate directly with AWS. The data comes into AWS IoT Core, which is an AWS service that uses MQTT to add the data to a topic that’s specific to the device. Then there’s a rule that selects any data that goes through the topic and redirects it to the monitoring tool, Amazon Kinesis.
A virtual machine running in AWS also runs two Docker containers. One contains an instance of Telegraf and the other an instance of InfluxDB. Telegraf collects the data stream from Kinesis and writes it to InfluxDB. Telegraf also uses a DynamoDB table as a checkpoint in this setup so if the container or the instance goes down, it will restart at the correct point in the data stream when the application is up again.
Once the data is in InfluxDB, we can use it to create visualizations.
OK, so that’s the basic data pipeline. Now, how do we make it work?
Device firmware
The first step is creating a data connection from the M5 device to AWS. To accomplish this we use UI Flow, a drag-and-drop editor that’s part of the M5 stack. Check out the blocks in the image below to get a sense for what the device is collecting and how these things map to our eventual output.
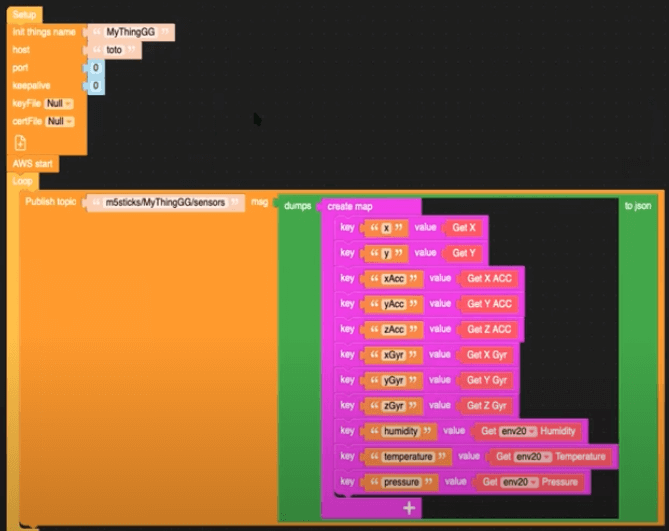
We can see here that this data publishes to the MQTT topic m5sticks/MyThingGG/sensors.
AWS IoT Core rules
With the device data publishing to an MQTT broker, next we need to subscribe to that topic in AWS IoT Core. In the topic filter field, enter m5sticks/+/sensors to ensure that all the data from the device ends up in the MQTT topic.
Next, we need to create another rule to ensure that the data in the MQTT topic goes to Kinesis. In IoT Core, you can use a SQL query to accomplish this:
SELECT *, topic(2) as thing, 'sensors' as measurement, timestamp() as timestamp FROM 'm5sticks/+/sensors'In an industrial setting, each device should have a unique name. So, to scale this data pipeline to accommodate multiple devices, we use the + wildcard in the MQTT topic to ensure that all the data from all devices end up in the correct place.
This query adds a timestamp to the data so that it adheres to line protocol, InfluxDB’s data model.
Telegraf policy
Now that data is flowing from the device to Kinesis, we need to get it into InfluxDB. To do that, we use Telegraf. The code below is the policy that determines how Telegraf interacts with Kinesis. It enables Telegraf to read from the Kinesis stream and enables read and write access to DynamoDB for checkpointing.
{
 "Version": "2012-10-17"
 "Statement": [
 {
 "Sid": "AllowReadFromKinesis",
 "Effect": "Allow",
 "Action": [
 "kinesis:GetShardIterator",
 "kinesis:GetRecords",
 "kinesis:DescribeStream"
 ],
 "Resource": [
 "arn:aws:kinesis:eu-west-3:xxxxxxxxx:stream/InfluxDBStream"
 ]
 },
 {
 "Sid": "AllowReadAndWriteDynamoDB",
 "Effect": "Allow",
 "Action": [
 "dynamodb:PutItem",
 "dynamodb:GetItem"
 ],
 "Resource": [
 "arn:aws:kinesis:eu-west-3:xxxxxxxxx:table/influx-db-telegraf"
 ]
 }
 ]
}
Telegraf Config
The following Telegraf config uses Docker container networking, the Telegraf Kinesis Consumer plugin to read the data from Kinesis and the InfluxDB v2 output plugin to write that data to InfluxDB. Note that the string fields match the values from the device firmware UI.
[agent]
debug = true

[[outputs.influxdb_v2]]

## The URLs of the InfluxDB Cluster nodes.
##
## Multiple URLs can be specified for a single cluster, only ONE of the
## urls will be written to each interval.
## urls exp: http://127.0.0.1:8086
urls = ["http://influxdb:8086"]

## Token for authentication.
token = "toto-token"

## Organization is the name of the organization you wish to write to; must exist.
organization = "aws"

## Destination bucket to write into.
bucket = "toto-bucket"

[[inputs.kinesis_consumer]]
## Amazon REGION of kinesis endpoint.
region = "eu-west-3"

## Amazon Credentials
## Credentials are loaded in the following order
## 1) Web identity provider credentials via STS if role_arn and web_identity_token_file are specified
## 2) Assumed credentials via STS if role_arn is specified
## 3) explicit credentials from 'access_key' and 'secret_key'
## 4) shared profile from 'profile'
## 5) environment variables
## 6) shared credentials file
## 7) EC2 Instance Profile

## Endpoint to make request against, the correct endpoint is automatically
## determined and this option should only be set if you wish to override the
## default.
##   ex: endpoint_url = "http://localhost:8000"
# endpoint_url = ""

## Kinesis StreamName must exist prior to starting telegraf.
streamname = "InfluxDBStream"

## Shard iterator type (only 'TRIM_HORIZON' and 'LATEST' currently supported)
# shard_iterator_type = "TRIM_HORIZON"

## Max undelivered messages
## This plugin uses tracking metrics, which ensure messages are read to
## outputs before acknowledging them to the original broker to ensure data
## is not lost. This option sets the maximum messages to read from the
## broker that have not been written by an output.
##
## This value needs to be picked with awareness of the agent's
## metric_batch_size value as well. Setting max undelivered messages too high
## can result in a constant stream of data batches to the output. While
## setting it too low may never flush the broker's messages.
# max_undelivered_messages = 1000

## Data format to consume.
## Each data format has its own unique set of configuration options, read
## more about them here:
## https://github.com/influxdata/telegraf/blob/master/docs/DATA_FORMATS_INPUT.md
data_format = "json"

## Tag keys is an array of keys that should be added as tags.
tag_keys = [
 "thing"
]

## String fields is an array of keys that should be added as string fields.
json_string_fields = [
 "pressure",
 "xGyr",
 "yAcc",
 "batteryPower",
 "xAcc",
 "temperature",
 "zAcc",
 "zGyr",
 "y",
 "x",
 "yGry",
 "humidity"

]

## Name key is the key used as the measurement name.
json_name_key = "measurement"

## Time key is the key containing the time that should be used to create the
## metric.
json_time_key "timestamp"

## Time format is the time layout that should be used to interpret the
## json_time_key. The time must be 'unix', 'unix_ms' or a time in the
## "reference_time".
##   ex: json_time_format = "Mon Jan 2 15:04:05 -0700 MST 2006"
##       json_time_format = "2006-01-02T15:04:05Z07:00"
##       json_time_format = "unix"
##       json_time_format = "unix_ms"
json_time_format = "unix_ms"

## Optional
## Configuration for a dynamodb checkpoint
[inputs.kinesis_consumer.checkpoint_dynamodb]
## unique name for this consumer
app_name = "default"
table_name = "influx-db-telegraf"
Docker Compose
This Docker compose file gets uploaded to an EC2 instance using SSH.
version: '3'

services:
  influxdb:
    image: influxdb:2.0.6
    volumes:
      # Mount for influxdb data directory and configuration
      - influxdbv2:/root/.influxdbv2
    ports:
      - "8086:8086"
# Use the influx cli to set up an influxdb instance
  influxdb_cli:
    links:
      - influxdb
    image: influxdb:2.0.6
# Use these same configurations parameters in you telegraf configuration, mytelegraf.conf
 # Wait for the influxd service in the influxdb has been fully bootstrapped before trying to set up an influxdb
   restart: on-failure:10
   depends_on:
   - influxdb
  telegraf:
    image: telegraf:1.25-alpine
    links:
      - influxdb
    volumes:
      # Mount for telegraf config
      - ./telegraf.conf:/etc/telegraf/telegraf.conf
    depends_on:
      - influxdb_cli

volumes:
  influxdbv2:
Visualization
Once your data is in InfluxDB, users running InfluxDB can create visualizations and dashboards using your tool of choice. InfluxDB offers a native integration with Grafana and supports SQL queries using Flight SQL-compatible tools.
Conclusion
Building reliable data pipelines is a critical aspect of industrial operations. This data provides key information about the current state of machinery and equipment, and can train predictive models used to improve machinery operations and effectiveness. Combining leading technologies like InfluxDB and AWS provides the tools necessary to capture, store, analyze and visualize this critical process data.
The use case described here is just one way to build a data pipeline. You can update, scale and amend it to accommodate a wide range of industrial IoT/OT operations or build something completely custom using the range of IoT solutions available for InfluxDB and AWS.
