Getting Started With the InfluxDB Template for NGINX Ingress Controller
By
Charles Mahler
updated December 14, 2025
Product
Use Cases
Developer
Getting Started
Navigate to:
Today, many of the internet’s busiest websites and applications rely on NGINX to run smoothly. And many of those websites and apps are run as cloud-native services in Kubernetes. In particular, the NGINX Ingress Controller is a best-in-class traffic management solution for cloud?native apps in Kubernetes and containerized environments that uses NGINX as a reverse proxy, load balancer, API gateway, cache, or web application firewall. In fact, the NGINX Ingress Controller is more popular than all other Kubernetes ingress controllers combined, with more than 10 million downloads.
If you are an InfluxDB user running cloud-native apps in Kubernetes or other containerized environments, NGINX Ingress Controller may be the solution for you. To monitor your NGINX Controller setup inside your Kubernetes cluster, the InfluxDB community has created an InfluxDB Template that allows you to get up and running quickly. In this blog post, you’ll learn how to set it up.
Understanding InfluxDB Templates
If you’re new to InfluxDB Templates, then now is the time to learn more. InfluxDB Templates let you quickly define your entire monitoring configuration (data sources, dashboards and alerts) for any technology in one easily shared, open-source text file that can be imported into InfluxDB with a single command.
InfluxDB Templates are:
- Comprehensive: Define and package the entire monitoring solution by configuring the data sources, dashboards and alerts. This level of sophistication makes getting started right away possible with no time-consuming back-and-forth.
- Developer-oriented: InfluxDB Templates work with modern developer tooling used in today's developer teams. Written in YAML, distributed via GitHub, and open-source licensed under Apache 2.0, the templates are easy for developers to create and share.
- Faster to deliver value: Build and share templates that cover a variety of monitoring solutions to get better insights faster and easier. Templates can be combined or changed to ensure they work for your project leaving you more time to focus on it.
How to install ingress-NGINX
Quick Install - InfluxDB UI
In the InfluxDB UI, go to Settings > Templates and enter the following URL: https://raw.githubusercontent.com/influxdata/community-templates/master/nginx-ingress-controller/nginx-ingress-controller.yml
Influx CLI
If you have your InfluxDB credentials configured in the CLI, you can install this template with the following code:
influx apply -u https://raw.githubusercontent.com/influxdata/community-templates/master/nginx-ingress-controller/nginx-ingress-controller.yml

Other installations
General instructions on using InfluxDB Templates can be found in the use a template document. Resources include the following:
- 2 Labels:
nginx-ingress - 1 Telegraf Configuration:
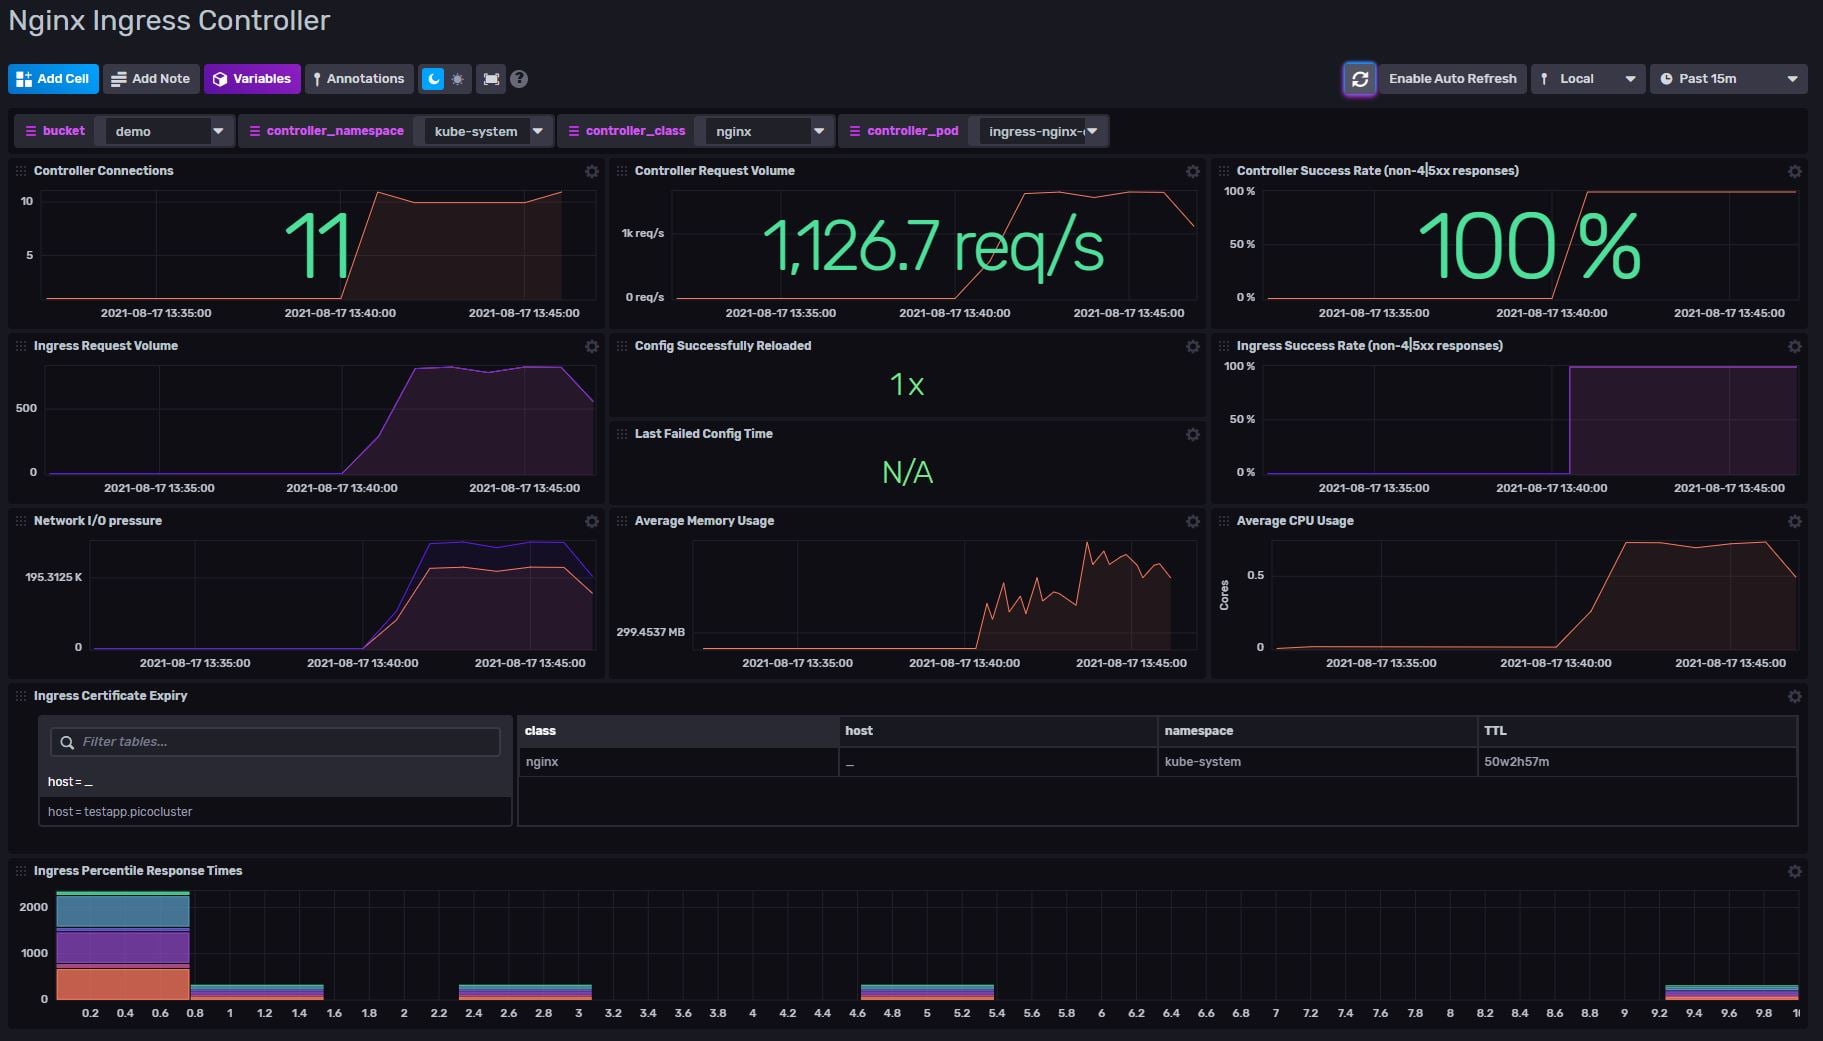
nginx-ingress-controller - 1 Dashboard:
Nginx Ingress Controller - 4 Variables:
bucket,controller_namespace,controller_pod,controller_class
You can also get more installation options at GitHub (https://github.com/kubernetes/ingress-nginx) and helm chart resources (https://github.com/kubernetes/ingress-nginx/tree/main/charts/ingress-nginx).
Note: Flux queries rely on Prometheus Input Plugin v2 metric version format. It is not compatible with v1 or with UI Scraper metric format.
If possible, use the Telegraf Prometheus Input Plugin to scrape Prometheus metrics from the Controller service endpoint. The plugin can also be configured to scrape Controller pod(s) directly via annotations. Telegraf configuration requires the following environment variables:
INFLUX_HOSTINFLUX_BUCKETINFLUX_TOKEN- The token with the permissions to read Telegraf configs and write data to the telegraf bucket. You can just use your operator token to get started.INFLUX_ORG- The name of your OrganizationCONTROLLER_SVC_URLS - URLsto Ingress Controller metrics endpoint service(s) e.g. http://ingress-nginx-controller-metrics.default.svc.cluster.local:10254/metrics.
To reflect specific Kubernetes or Ingress Controller setup, it may require additional Telegraf plugin configuration.
NOTE: You MUST set these environment variables before running Telegraf using something similar to the following commands:
- This can be found on the Load Data > Tokens page in your browser:
export INFLUX_TOKEN=TOKEN - Your Organization name can be found on the Settings page in your browser:
export INFLUX_ORG=my_org
Conclusion
Whether you’re using the quick install or implementing the longer approach, InfluxDB has the tools for you to get started right away. If you’re ready to combine the comprehensive capabilities of NGINX with the power of InfluxDB, then install the NGINX Ingress Controller Template with a free InfluxDB account today.
