How Playtech Fixed Metrics Over-Collection with Observability
By
Caitlin Croft
updated December 14, 2025
Product
Use Cases
Developer
Navigate to:
According to Forbes, 2.5 quintillion bytes of data are created every day. Data volumes have grown exponentially in recent years due to the growth of the Internet of Things (IoT) and sensors. The majority of data collected has been collected in the last two years alone. For example, the U.S. generates over 2.5 million gigabytes of Internet data every minute, and over half of the world’s online traffic comes from mobile devices.
Gartner defines dark data as data that “organizations collect, process and store during regular business activities, but generally fail to use for other purposes.” While companies sometimes have to store data for compliance reasons, it is also kept for analysis that never happens. According to Bob Picciano, IBM’s Senior vice president of analytics, 90% of data generated by sensors never gets used and 60% loses its value within milliseconds. CIO.com pointed out that unstructured data counts for about 90% of dark data in organizations, yet businesses are aware that their unstructured data has the potential to improve their operations.
Companies are keen to collect more information about their website, products, operations and customers. But it’s in the best interest of companies to only collect data that they will use, and ensure that they are using it effectively.
Playtech uses InfluxDB to improve observability
Playtech is the world’s largest online gaming software vendor and is traded on the London Stock Exchange. Since 1999, it has been striving to create the industry’s best products and content through continuous innovative development. Playtech was founded in Tartu, Estonia and it has 5,000 employees spread across 17 countries. Throughout the years, it has launched new products, acquired organizations, entered new markets and created partnerships to maintain its position as a leader within the online gaming industry.
InfluxDB is an important part of Playtech’s operations, as it gives their team observability into all of its systems. Playtech has over 50 multibranded sites, which are distributed worldwide. InfluxDB is used by Playtech for production system-level monitoring and organizational monitoring. In addition to monitoring typical back end systems, like network and CPU usage, it also tracks customer experience. By mapping all of its products, customers, sites and brands, they are able to tie certain issues to the engineering team who developed it.
From data spaghetti to data clarity
At InfluxDays London 2019, Aleksandr Tavgen, a technical architect from Playtech and an InfluxAce, pointed out that it’s easier to start off trying to solve one small critical problem rather than trying to solve all issues at once. He said to start by trying to solve one critical part, by adding new measurements. By doing incremental changes, it will be easier for everyone to understand the data. “If you have nine billion metrics, nobody will look at them,” said Tavgen.
While collecting the right data is important, the way the data is presented is equally important. As Tavgen pointed out, if a dashboard shows all of a company’s metrics it is very hard to understand the dashboard it looks like “data spaghetti.” Confusing dashboards that are oversaturated with data can actually make life worse.
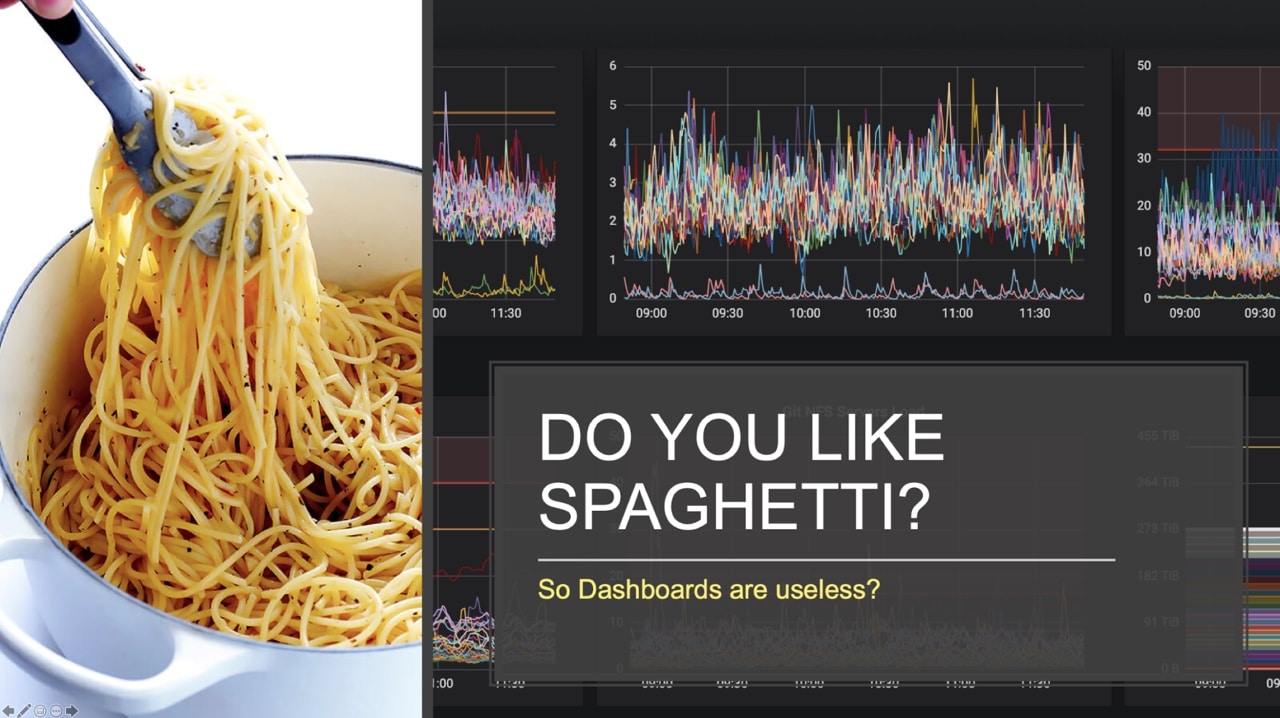
As seen in the above dashboard, the amount of metrics shown on one graph is less than helpful. Dashboards and visualizations are quite useful when organizations know how to use them effectively. Tavgen pointed out that human brains recognize patterns easily. “It is easier for us,” said Tavgen, “to have a quick look at a dashboard rather than making complex queries.”
Queries take a long time and dashboards should be able to provide anyone with a quick snapshot of the data. During his InfluxDays London 2019 presentation, Tavgen made the point that not all metrics or logs are needed. Sometimes it is possible to solve a company’s problems with a subset of data, rather than deal with millions of metrics and events.
Playtech has discovered that it’s very hard to operate dealing with millions of metrics, for a variety of reasons: It is hard for any team to comprehend millions of metrics all at once and the operational costs associated are too high. So its team has determined which metrics are most critical to the business. Playtech isn’t interested in a huge number of events; if everything is working with their “normal behavior” parameters, they don’t want to process everything. Also, not all anomalous readings are cause for concern. There can be false negatives and false positives, partially due to outliers. If there is a legitimate problem, Playtech wants to be able to delve into the metrics and event data.
Playtech has over 76 data centers spread across the world with local instances of InfluxDB:
- An agent collects vital metrics every minute.
- Data is collected and stored in InfluxDB as the central single version of the truth.
- Metrics help with KPI's for their worldwide operations.
- They use machine learning to help predict when issues arise.
- As operations are distributed globally, they deal with unpredictable network latency.
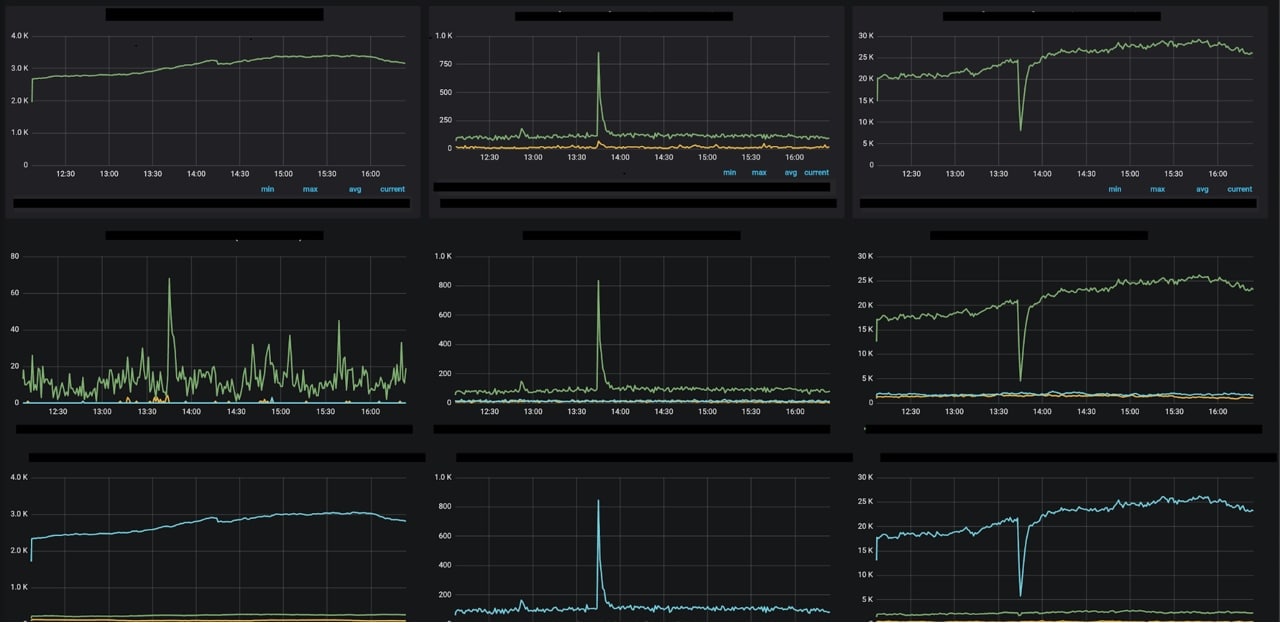
As seen in the screenshot below, having multiple simple dashboards is more usable and effective than one dashboard filled with “data spaghetti.”
Playtech doesn’t always need to correlate or fetch all of its data. Tavgen stated that they just need to be able to access their event data on demand. For example, if they deploy changes on the organizational level, they can query the data if incidents arise. For Playtech, it’s okay to lose a few data points if it means better performance. While it’s alluring to keep all data points just in case, over time the metrics will grow so quickly that it will be hard for anyone to understand all of the metrics.
Tavgen also pointed out that other companies are facing these problems as well. For example, Uber has collected around nine billion metrics spread across over a thousand databases. Tavgen said, “if you have nine billion metrics – nobody looks at that.” If Playtech was to show all of its metrics on a dashboard, it would look like “data spaghetti.” High quantities of metrics can lead to unusable dashboards.
Using InfluxDB as a central metric store
Playtech chose InfluxData’s time series database platform for a variety of reasons. InfluxDB provided the company with centralized storage for its metrics, events and traces. The company’s engineers are able to drill into the historical data to prepare better for the future. They rely on Kafka to ensure the order of events remains unchanged. They are utilizing Flux to combine data from different sources. They are able to test their theories out.
Playtech is a great example of utilizing the data that is most important to the organization. Rather than dealing with too much data which can lead to dashboards that look like “data spaghetti,” it wants to make sure its dashboards are showing the important data.
To learn more about how Playtech is using InfluxData, check out the full story. If you’re interested in sharing your InfluxDB story, click here.
