How to Setup InfluxDB, Telegraf and Grafana on Docker: Part 2
By
Community
updated October 18, 2023
Product
Developer
Navigate to:
This article, written by InfluxAce Antoine Solnichkin, was originally published in The New Stack and is reposted here with permission. Scroll down for the author’s photo and bio.
This tutorial describes how to install the Telegraf plugin as a data-collection interface with InfluxDB 1.7 and Docker.
In Part 1 of this tutorial series, we covered the steps to install InfluxDB 1.7 on Docker for Linux instances. We describe in Part 2 how to install the Telegraf plugin as a data-collection interface with InfluxDB 1.7 and Docker.
Installing Telegraf on Docker
For those who are not familiar with Telegraf, it is a plugin-driven agent that periodically collects metrics from a variety of different systems. The metrics are pushed to InfluxDB and they can be later analyzed in Chronograf or Grafana. Luckily, Telegraf also belongs to the official Docker images.
In this section, we are going to configure Telegraf to gather system metrics on our Linux host (in this case, a Debian 10, but it works in the same way for Ubuntu-based hosts).
Prepare Telegraf for InfluxDB and Docker
Similarly to our InfluxDB setup, we are going to create a Telegraf user for our host. It ensures that correct permissions are set for our future configuration files.
$ sudo useradd -rs /bin/false telegraf
In your etc directory, create a new folder for your Telegraf configuration files.
$ sudo mkdir -p /etc/telegraf
Creating a configuration file for Telegraf and Docker
Again, we don’t have to create a Telegraf configuration file by ourselves.
The Telegraf Docker image is built very closely to the InfluxDB one.
As a consequence, it is able to run a simple telegraf config command to generate a configuration on the fly.
The Telegraf configuration file has the following defaults:
- Interval: 10 seconds. Telegraf is going to gather and send metrics to InfluxDB every 10 seconds.
- Round_interval : true. The agent is going to collect metrics on :00, :10, or :(00 + n*interval)
- The InfluxDB output plugin is enabled by default.
- The CPU, disk, diskio, kernel, memory, processes, swap and system inputs plugins are enabled. As those inputs use the /proc mountpoint to gather metrics, we will have to remap volumes on the container.
To create a Telegraf configuration file using Docker, run the following command.
docker run --rm telegraf telegraf config | sudo tee /etc/telegraf/telegraf.conf < /dev/null

Next, reassign the correct permissions to your Telegraf configuration folder. This will ensure that only Telegraf itself and the root account are able to write to the configuration file.
$ sudo chown telegraf:telegraf /etc/telegraf/*
Modify your Telegraf configuration file
With Telegraf, most of the time, you will want to send metrics directly to InfluxDB itself. This is why the InfluxDB output is enabled by default in your Telegraf configuration file. By default, Telegraf will send metrics to a database named “telegraf” on InfluxDB. This is a customizable parameter; however, in this case, we are only going to specify the InfluxDB authentication parameters.
Edit your Telegraf configuration file, and locate the [[outputs.influxdb]] section.

In this configuration file, locate the “HTTP Basic Auth” section and modify the credentials accordingly.
## HTTP Basic Auth
username = "admin"
password = "admin123"
Of course, you are free to create a dedicated administrator account for Telegraf by using the method we described above (using docker exec).
Save and exit your file. Now it is time to run the container.
Running the Telegraf Container on Docker
As stated above, Telegraf enables system inputs by default. As a consequence, we will have to remap the /proc host folder to the /host folder on our Docker image.
This is to ensure that Telegraf is not gathering metrics from the Docker container itself, and that the container filesystem is not altered in any way.
To achieve this, unless you gave a name to your InfluxDB container, run this command to get your InfluxDB container ID. It will be used to connect Telegraf and InfluxDB to the same virtual network.
$ docker container ls | grep influxdb
1939ba611410   influxdb   "/entrypoint.sh -conf..."   24 minutes ago    Up 30 minutes    0.0.0.0:8086-<8086/tcp    ecstatic_moore
Isolate your Telegraf user ID by running the following command:
$ getent passwd | grep telegraf
telegraf:x:998:998::/etc/telegraf:/bin/false
Next, to run the Telegraf Docker image, run the following command:
$ docker run -d --user 998:998 --name=telegraf \
      --net=container: \
      -e HOST_PROC=/host/proc \
      -v /proc:/host/proc:ro \
      -v /etc/telegraf/telegraf.conf:/etc/telegraf/telegraf.conf:ro \
      telegraf
Note: the net option can be replaced by –net=influxdb if you chose to create your InfluxDB container with a name.
Great! To make sure your Telegraf instance is running correctly, run the following command:
$ docker container logs -f --since 10m telegraf

Telegraf seems not to raise any error messages, but let’s double-check the correctness of our setup by inspecting the InfluxDB database:
$ docker exec -it influx -username admin -password admin123
InfluxDB shell version 1.7.8
< SHOW DATABASES
name: databases
name
----
weather
_internal
telegraf
< USE telegraf
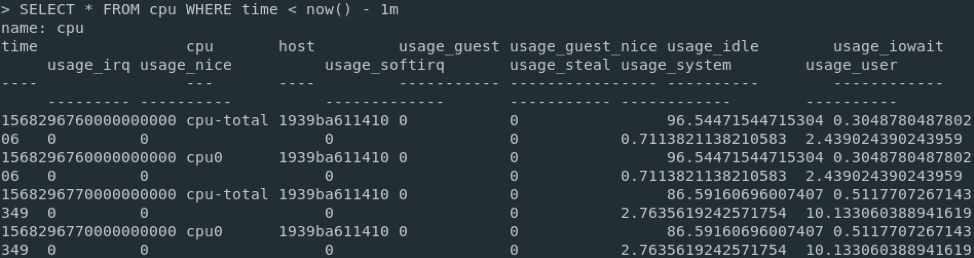
< SELECT * FROM cpu WHERE time > now() - 1m
If you are seeing data points, congratulations! Your Telegraf instance is correctly sending metrics to your InfluxDB server:
Now that all metrics are stored in Telegraf, for one week, we can install a modern dashboarding tool in order to visualize them: Grafana.
Visualizing Telegraf metrics in Grafana
For those who are unfamiliar with Grafana, it is a dashboarding tool that pulls from a wide variety of different datasources in order to create beautiful graphs and dashboards. It can pull from traditional SQL databases, but it can also pull from a variety of time series databases, which is what we are going to do in this section.
Installing Grafana on Docker
The Grafana docker image is stored under the Grafana repository:
To create a Grafana container, run the following command on your host:
$ docker run -d --name=grafana -p 3000:3000 grafana/grafana
A Grafana server container should now be up and running on your host. To confirm that, run the following command.
$ docker container ls | grep grafana
You can also make sure that it is correctly listening on port 3000.
$ netstat -tulpn | grep 3000
Configuring Grafana for InfluxDB
With your web browser, head over to http://localhost:3000.
You should be redirected to Grafana homepage. The default credentials for Grafana are admin/admin. Immediately, you are asked to change your password. Choose a strong password and click on “Save.”

You should now be redirected to the Grafana default Web UI:

Click on “Add data source” to add an InfluxDB datasource:

Next, select the InfluxDB option and click on “Select.”
For this tutorial, we are not using InfluxDB images as Docker services. As a consequence, we have to isolate InfluxDB public IP on our bridge network.
To do that, run the following command:
$ docker network inspect bridge | grep influxdb -A 5
"Name": "influxdb",
"EndpointID": "7e4eb0574a346687efbb96b6b45",
"MacAddress": "02:42:ac:11:00:04",
"IPv4Address": "172.17.0.2/16",
"IPv6Address": ""
Copy the IPv4 address and paste it in the InfluxDB configuration for Grafana. Select the Basic Auth option, specify your administrator credentials, and fill the details about your InfluxDB database. Here is the final configuration:
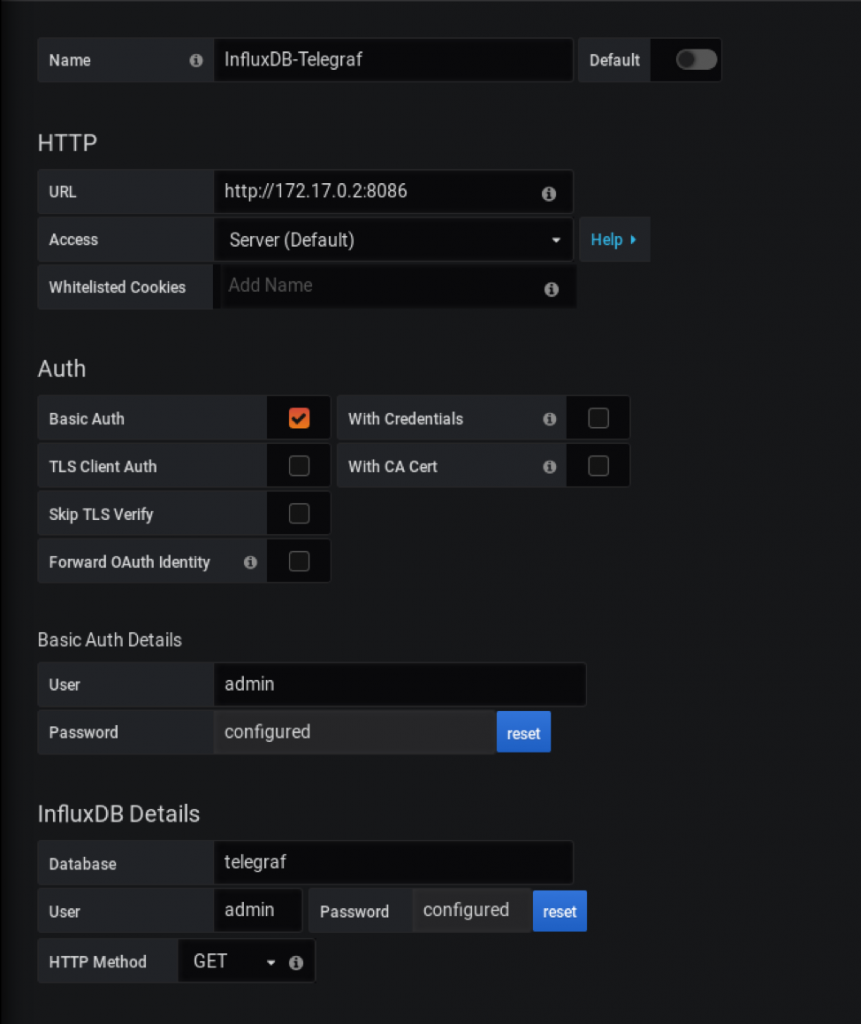
Click on “Save and Test” to make sure that your configuration is working properly.
Awesome! Now that everything is set up in Grafana, let’s import a dashboard designed for Telegraf host metrics.
Importing a Grafana dashboard
To import a Grafana dashboard, select the “Plus” icon in the left menu, and click on “Import“:

In the import text box, put 1443 as a dashboard ID:

In the next window, make sure that the information is correct and bind it to your newly created datasource:


Conclusion
Congratulations, you have learned how to install InfluxDB 1.7.x, Telegraf and Grafana using Docker. As you probably realized, this tutorial focuses on a fully customizable installation of your images. If you want to automate your container setups, it might be a good idea to use docker-compose. Also, make sure to read through the entire list of Telegraf input plugins to start getting ideas about what to monitor.
More is yet to come: InfluxDB will soon become InfluxDB 2.0, which will serve as a single platform to manage all the components of the TICK Stack. Another tutorial about how to install and set up InfluxDB 2.0 will be coming soon.
Until then, have fun, as always.
About the author

Antoine is an experienced software engineer and aspiring enterprise architect in Luxembourg. On a daily basis, he is involved in architecting, developing and maintaining large industrial projects with complex needs. He specializes in distributed systems built around messaging patterns, leveraging tools such as Kafka or MQs to meet demanding business needs. He regularly writes technical articles on devconnected, a blog specialized in DevOps, open source software and time series databases.
