Webinar Highlights: How Texas Instruments Uses InfluxDB
By
Caitlin Croft
updated December 14, 2025
Product
Use Cases
Developer
Navigate to:
It’s back to school season, and oftentimes, that means people are purchasing TI-84 calculators for their kids. But did you know that Texas Instruments makes so much more than calculators?
Michael Hinkle, a Probe Engineering and Manufacturing Supervisor at Texas Instruments, recently presented on “How Texas Instruments Uses InfluxDB to Upload Product Standards and to Improve Efficiencies”. I originally met Mike as he started using InfluxDB to monitor, collect and analyze the time-stamped data from his daughter’s pulse oximeter. I realized that he took his personal knowledge of InfluxDB and began to apply it at work. If you missed attending the live session, we have shared the recording and the slides for everyone to review and watch at your leisure.
Webinar highlights
Overview of Texas Instruments
Mike started off the webinar with providing the audience with a quick overview of who Texas Instruments is and their history. In addition to calculators, they create electronic systems for a myriad of industries. Texas Instruments also designs, manufactures, tests, packages and sells semiconductor devices.
Key terms
Mike provided a fantastic overview of all of the terms he would be using during the webinar. A wafer is usually made with silicon, and 25 wafers is called a lot. There are 25 or less wafers in one lot. During his presentation, he used the term “tool”. While most of us think of tools as small handheld devices, the tools at Texas Instruments are large equipment pieces including furnaces, ion implanters, epi reactors, plasma etchers, metrology and testers. Mike and his team are interested in the state of their tools. States are numerical or character codes used to classify tools based on their current status. Modules is the term used to describe a set of common tools and processes.

(phosphorus doping)
Challenges and goals
Texas Instruments is striving to become more data-driven. Mike is interested in knowing the time it takes to manufacture a product and how long it takes to get to their customers. Mike pointed out that in addition to collecting data, it’s important to ensure that the data being collected is correct.
"Inaccurate or misinterpreted data can lead to waste, yield loss and deadlines not being met – which all ultimately results in losing valuable business." - Michael Hinkle
As their offices run 24x7, he needed a way to better understand the status of the machines and operational efficiencies even when he’s not in the office. They need to know ASAP if there is an issue with a tool or process. Better reporting means less time spent preparing for meetings and provides interested parties with high-level metrics.
Most of Texas Instruments’ employees aren’t developers. Most have an electrical engineering, mechanical engineering, chemical engineering or physics background. So Mike was aware they needed a system that everyone could use effectively.
InfluxDB at Texas Instruments
After using InfluxDB, the purpose-built time series database, to monitor his daughter’s health, he realized that he could apply the same technology at work. He was impressed that InfluxDB only took minutes to download, install, configure and fine-tune. Mike explained that having set up many relational databases in the past, which all took over an hour, he was impressed with the ease-of-use of InfluxDB.
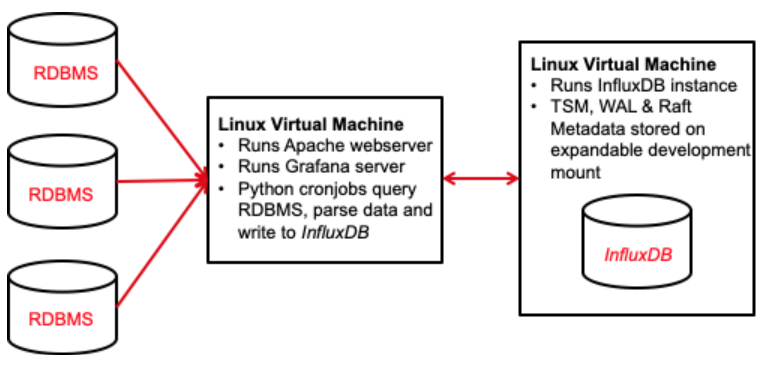
His implementation of InfluxDB primarily uses the Python client library and the command line interface (CLI). He has InfluxDB installed on a Linux VM. Mike is impressed with the myriad of client libraries available. He appreciates that InfluxQL is SQL-like, so he didn’t have to learn a new querying language. Mike is currently using Grafana to visualize all of his data and he’s starting to experiment with Chronograf.
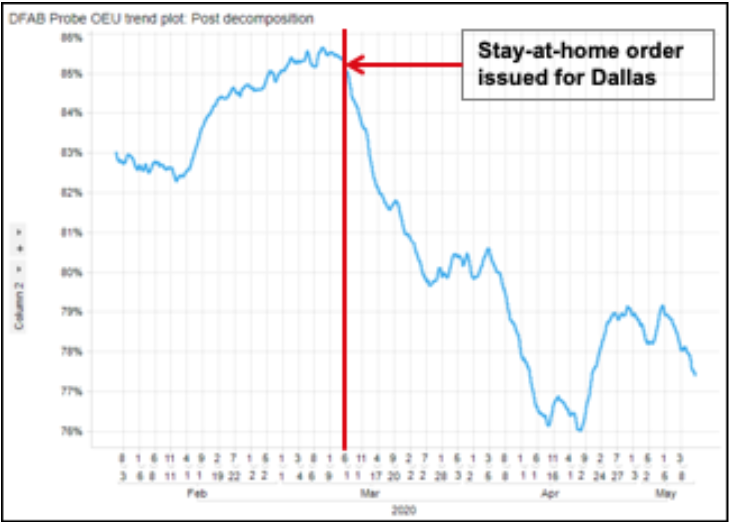
Mike Hinkle wants to understand the general behaviors and the productivity of their manufacturing plants. As shown below, production levels significantly dropped in early 2020 when COVID-19 caused Dallas to issue stay-at-home orders. Mike understands that there are going to be natural fluctuations in output; he’s more concerned if there is a sudden change as it could indicate a bigger problem.
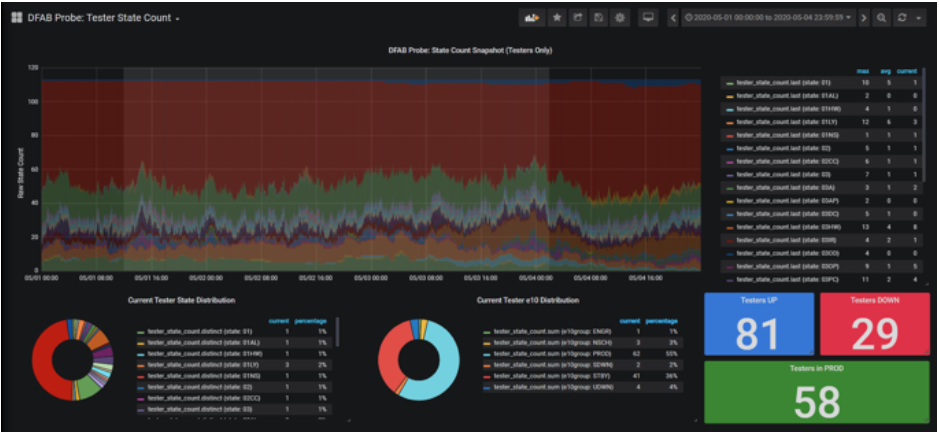
As shown in the right-hand table below, Mike is interested in the current state of each tester. Thanks to his Grafana dashboard, he’s quickly able to understand how many testers are in production and how many are down.
Challenges and next steps
Whenever implementing a new tool, there are always challenges that arise. For example, Mike realized that InfluxDB stored timestamps in a different time zone than Grafana. InfluxDB was expecting UTC time and Grafana was displaying the data according to Mike’s local time zone Central time. He realized that he needed to add data into InfluxDB using UTC time.
Mike is interested in learning more about Flux so he can group data based on time periods. For example, he’d like to aggregate data by the month. He’s also interested in doing more advanced analytics and forecasting, including using Holt-Winters for machine learning.
Q&A Time
Attendees had a bunch of questions for Mike – here are a few selected questions and their answers.
Question: Before InfluxDB, what were you using to collect this data? Answer: We have tons of tools and applications accessible to us. However, not all tools address everyone’s needs. Everyone looks at data a little differently, so making sure the data is actually useful to all interested parties is an interesting challenge. But there’s no point in collecting data if it isn’t useful for people.
Question: How were you analyzing efficiencies prior to InfluxDB? Answer: I used to rely on tools which would provide me with an automated report. However, the reports only provide me with a snapshot of my data. I’ve put together my own web-based reports as well. It’s frustrating when you spent hours building a report that works for you and then having someone come up and say “this report isn’t helpful for me”. I want to have all of the data available and to be able to build reports for people’s needs.
Question: What retention policy do you plan on using? Answer: Currently I’m using the default auto-generated policy. When I initially pitched the idea of using InfluxDB to our admins, I suggested we try it for six months. I’m still trying to demonstrate the capability of InfluxDB to management. Some of Texas Instruments’ data is kept for years, and some of it is only kept a year or two. As of right now, I still have data collected every minute. However, I realize that years from now, I likely won’t need the data down to the minute.
If you’re interested in checking out the full webinar and listening to the rest of the Q&A, click here!
