The What, Why, and How of Time Series Databases
By
Community
updated October 20, 2023
Product
Use Cases
Navigate to:
This article was written by Thamatam Vijay Kumar. Scroll down for author bio and photo.
Modern-day websites are filled with dashboards featuring enriched charts, line graphs, radar as well as multigraphs. The world is fascinated with such charts and graphs, which deliver much value to millennial web applications. There are many such chart libraries which provide interactive visualization and deliver data insights for users.
The charts plot the lines using data points. These chart libraries help us analyze data from hundreds to millions of data points ranging from minutes to years, and also show additional information using tooltips, legends, and aggregations.

The above example shows the capability of charts to show thousands of data points, helping users analyze engine data more informatically and understand engine health.
In this post, we cover how to store and query time series data, a major data source of modern charts.
What is time series?
Time series data is a series of data points collected over time intervals for variables, giving us the ability to track changes over time. A time series is a time-oriented or chronological sequence of observations on a variable.
Because data points in time series are collected at various time periods, there is potential for correlation between observations. This is one of the features that distinguishes time series data from other data.
Time series data can be found in finance, health, manufacturing, IoT, physical sciences, etc.
Examples include:
- Stock value of a company
- Health monitor values of a patient for various health parameters like blood pressure, blood sugar, oxygen
- Values of various car engine sensors like speed, torque, oil, coolant
- Smart home monitor to regulate temperature and identify intruders
Below is sample data, for car engine sensors, in time series format:
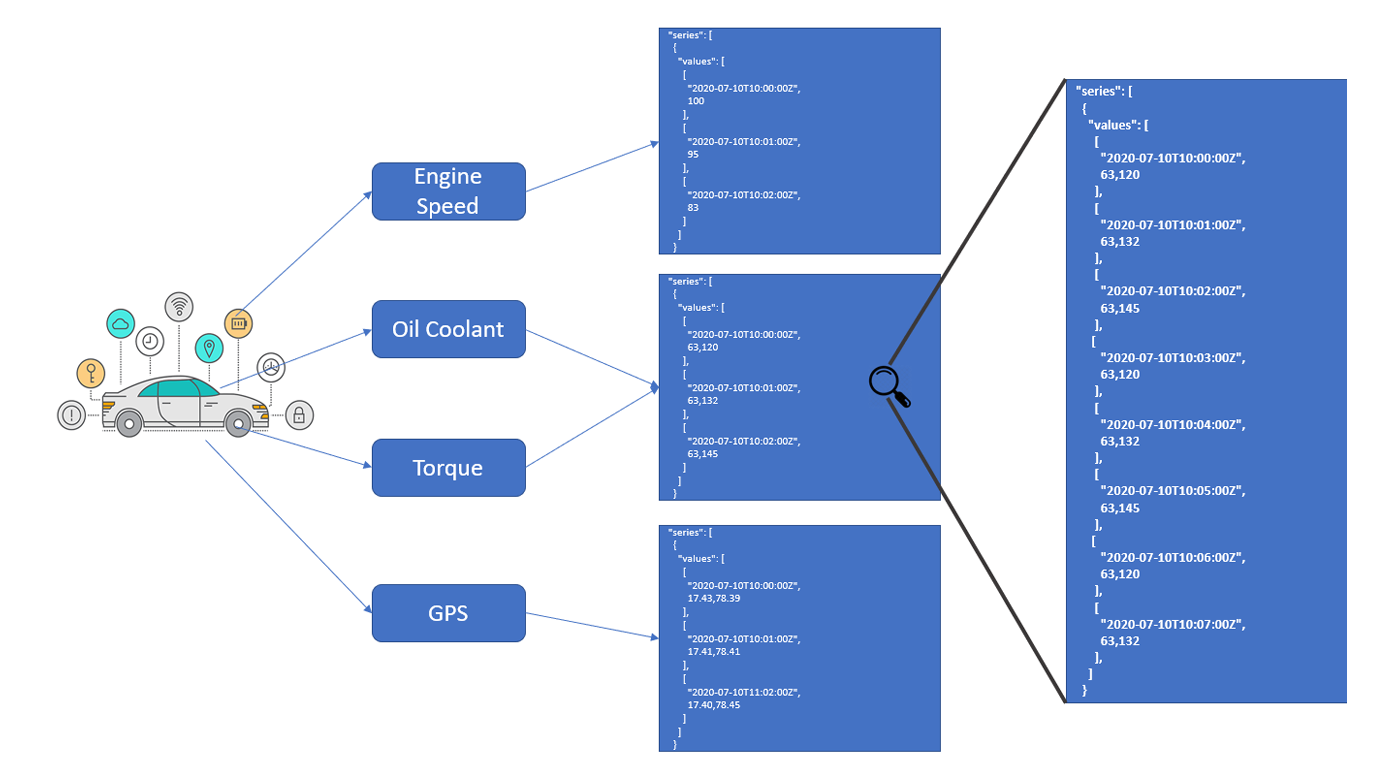
As shown above, the data is for multiple sensors in a car engine over different intervals. This data helps us to understand and analyze the engine over different periods of time ranging from minutes to years.
When to use time series
But when can we use time series, and in what use cases do we store data in a time series database?
As mentioned above and when you have a continuous data stream to store values over a period of concurrent or different timestamps, these applications require a special kind of database.
Common time series database use cases include:
- Accessing IoT data (engines, smart appliances, etc.)
- Monitoring web services, applications, and infrastructure
- Financial movements
- Self-driving car data
- Autonomous trading algorithms
- Retail industry deliveries
Also, if you foresee the need to store any stream of data for continuous timestamps for different values, a purpose-built time series database is most advisable for storing time series data.
You might ask: Why can’t we store this data in a relational database instead of a time series database?
Why use a time series database
Over a period of time, the volume of time-stamped data keeps growing, and it is difficult to store a continuous stream of data in a regular database.
We are observing the instrumentation of every available exterior in the physical world — cars, medical instruments, power plants, phones, home appliances, human bodies and many others. Everything has, or will have, a sensor emitting a relentless stream of time series data. This requires a platform able to handle such data loads.
Consider if sensors send out data for every second and you own 10000 engines with each engine having 100 sensor values. This will result in storing 8 billion+ records in the database. Over a month and year, it becomes impossible to store such a high volume of data in a traditional database, and impossible to query such a database for a simple query such as fetch data for 10 sensors for a year. This is why the world is racing towards adopting time series databases for storing and retrieving data, for time series use cases and continuous data streams.
The two alternatives to time series databases are RDBMS and NoSQL.
Relational database management systems (RDBMS) can be used to store and retrieve time series data. With the flexibility of RDBMSs, they can store the same data as a TSDB. The one key difference is that RDBMSs are not optimized for time series data and tend to be slower for inserting and retrieving time series data as data volumes keep growing as discussed in the example above.
Another type of database, NoSQL, is also often used to store time series data. Since NoSQL databases are more flexible in terms of the data format for each record, they are good for capturing time series data from a number of distinct sources. However, to query a NoSQL database means carefully examining the schema and writing a custom query against it. Complex operations such as different kinds of joins, which have benefited from decades of innovation on the SQL side, are likely to be slow and even buggy in the NoSQL camp.
Choosing a time series database
Now that we covered the what and why of time series, let’s compare some popular time series databases available on the market and how to store and retrieve data for a continuous stream of data.
- InfluxDB
- Graphite
- OpenTSDB
- TimescaleDB
| Name | InfluxDB | Graphite | OpenTSDB | TimescaleDB |
| Description | DBMS for storing time series metrics and events | Data logging and graphing tool for time series data | Scalable time series DBMS based on HBase | A time series database optimized for fast ingest and complex queries, based on PostgreSQL |
| Primary database model | Time Series DBMS | Time Series DBMS | Time Series DBMS | Time Series DBMS |
| Secondary database models | Spatial DBMS | Relational DBMS | ||
| Cloud-based only | No | No | No | No |
| Implementation language | Go | Python | Java | C |
| Data scheme | Schema-free | Yes | Schema-free | Yes |
| Typing | Numeric data and strings | Numeric data only | Numeric data for metrics, strings for tags | Numerics, strings, booleans, arrays, JSON blobs, geospatial dimensions, currencies, binary data, other complex data types |
| XML support | No | No | No | Yes |
| Secondary indexes | No | No | No | Yes |
| Query language | SQL-like query language | No | No | Yes |
| APIs and other access methods | HTTP API JSON over UDP | HTTP API Sockets | HTTP API Telnet API | ADO.NET JDBC Native C library ODBC Streaming API for large objects |
| Supported programming languages | .Net, Clojure, Erlang, Go, Haskell, Java, JavaScript, JavaScript (Node.js), Lisp, Perl, PHP, Python, R, Ruby, Rust, Scala | JavaScript (Node.js), Python | Erlang, Go, Java, Python R, Ruby | .Net, C, C++, Delphi, Java, JavaScript, Perl, PHP, Python, R, Ruby, Scheme, Tcl |
| Server-side scripts | No | No | No | user defined functions, PL/pgSQL, PL/Tcl, PL/Perl, PL/Python, PL/Java, PL/PHP, PL/R, PL/Ruby, PL/Scheme, PL/Unix shell |
| Triggers | No | No | No | Yes |
| Partitioning methods | Sharding | None | Sharding | Yes, across time and space (hash partitioning) attributes |
There are several factors to consider when evaluating a time series database for your workloads:
- Data model
- Query language
- Reliability
- Performance
- Ecosystem
- Operational management and support
Typically, database evaluations are based on performance targets. However, performance is just a part of the overall evaluation. If the database lacks in its data model, query language, or reliability required for your production workloads, it won’t perform efficiently. The above table compares time series databases on qualitative dimensions (data model, query language, and reliability).
Currently in the growing market of time series databases, InfluxDB stands out as promising an overall time series database. With good technical documentation it is easy to install, configure, and get started with InfluxDB. As it is a NoSQL-like database, we insert the data and we are good to go.
Before making a decision, take a step back and study your stack, your team’s skills, and your needs now and in the near future.
How to store and query time series data
Let’s examine how to store and query time series data in InfluxDB.
Store data:
Download and install InfluxDB. (Note that the latest version at the time of writing this article was InfluxDB 2.2).
Once InfluxDB is installed and set up with user permissions, we are good to write and query the data.
Before writing to InfluxDB, it’s important to learn a few key terms:
-
Measurement: Part of the InfluxDB data structure that describes the data stored in the associated fields
-
Tags: Strictly speaking, tags are optional but most series include tags to differentiate data sources and to make querying both easy and efficient. Both tag keys and tag values are strings.
-
Fields (required): Field keys are required and are always strings; by default, field values are floats.
-
Timestamp: Supplied at the end of the line in Unix time in nanoseconds since January 1, 1970 UTC - is optional. If you do not specify a timestamp, InfluxDB uses the server’s local nanosecond timestamp in Unix epoch. Time in InfluxDB is in UTC format by default.
These terms may be a little difficult to understand if you’re new to time series, so here is an explanation:
An InfluxDB measurement is similar to an SQL database table.
InfluxDB tags are like indexed columns in an SQL database.
InfluxDB fields are like unindexed columns in an SQL database.
InfluxDB points are similar to SQL rows.
InfluxDB provides several mechanisms to write and query data.
-
Telegraf plugins
-
InfluxDB API
-
Influx command line
Here we use the API mechanism to write and store the data using write endpoint provided:
/write HTTP endpoint:
POST http://localhost:8086/write
We can use the above API to write the data into InfluxDB. The syntax for writing data is as follows: ‘Measurement, tagkey = ’tag value’, fieldkey = ’fieldvalue’, Epoch timestamp‘.
$ curl -i -XPOST "http://localhost:8086/write?db=mydb" --data-binary 'enginespeed,serialnumber=10001 value=129 1463689152000000000
 enginespeed,serialnumber=10001 value=84 1463689152000000000
 enginespeed,serialnumber=10001 value=79 1463689152000000000
 torque,serialnumber=10001 value=11 1463689152000000000
 torque,serialnumber=10001 value=23 1463689152000000000
 torque,serialnumber=10001 value=32 1463689152000000000
 power,serialnumber=10001 value=1200 1463689152000000000
 power,serialnumber=10001 value=1100 1463689152000000000
 power,serialnumber=10001 value=1000 1463689152000000000

HTTP/1.1 204 No Content
Content-Type: application/json
Request-Id: [...]
X-Influxdb-Version: 1.4.x
Date: Wed, 08 Nov 2017 18:04:02 GMT
This write will insert the data into multiple measurements (engine speed, torque, power).
Here we are saving data related to car engine values for a series of epoch timestamps.
In this way, we can store the continuous stream of data into InfluxDB for further query.
Similarly, data can also be written into InfluxDB using CLI and Telegraf plugins as well.
Query data:
With the data written to InfluxDB, querying can be performed with simple InfluxDB queries using the query endpoint:
GET http://localhost:8086/query
We can use the above API to query the data from InfluxDB; the syntax for writing data is as follows:
‘Measurement, tagkey = ’tag value’, fieldkey = ’fieldvalue’, Epoch timestamp‘.
$ curl -G 'http://localhost:8086/query?db=mydb' --data-urlencode 'q=SELECT * FROM "enginespeed"'The result can be retrieved in JSON format as shown below:
"results": [
        {
            "statement_id": 0,
            "series": [
                {
                    "name": "engiespeed",
                    "columns": [
                        "time",
                        "value",
                        "serialnumber"
                    ],
                    "values": [
                        [
                            "2017-03-01T00:16:18Z",
                            129,
                            10001
                        ],
                        [
                            "2017-03-01T00:17:18Z",
                            84,
                            10001
                        ],
                        [
                            "2017-03-01T00:17:18Z",
                            79,
                            10001
                        ]

                    ]
                }
            ]
        }
    ]
}
We can also perform all aggregations and grouping in the queries to retrieve the data as desired. A sample query having a mix of select and aggregator clauses will look as shown below
Select the maximum field value associated with a field key and include several clauses
> SELECT MAX("water_level") FROM "h2o_feet" WHERE time >= '2015-08-17T23:48:00Z' AND time <= '2015-08-18T00:54:00Z' GROUP BY time(12m)

name: h2o_feet
tags: location=coyote_creek
time                   max
----                   ---
2015-08-17T23:48:00Z   9.01
2015-08-18T00:00:00Z   8.12
2015-08-18T00:12:00Z   7.887
2015-08-18T00:24:00Z   7.635
This way, we can perform queries using different clauses as per our needs and fetch the data in a time series format. As shown in the beginning, the same data can be used to plot a variety of charts using the data, which can be used to generate more insights and forecasting on that data. Further, this data can also be used for troubleshooting and understanding the stream of metrics and events.
In this article, I have tried to cover the what, why, and how of time series databases using InfluxDB as an example. As experts recognize the emerging need for a time series database, I recommend learning more about time series, as storing your projects in a time series format can be a gamechanger.
About the author

Thamatam Vijay Kumar is a data architect at Bosch with 11+ years of experience in building cloud solutions and data management. He is passionate about building solutions and products and has a strong desire to architect them. He has worked on multiple technologies majorly pertaining to cloud services and data management and worked on designing, developing, and deploying solutions.
