Community Highlight: How to Build an InfluxDB Template
By
Community
Product
Use Cases
Developer
Nov 13, 2020
Navigate to:
 This article was written by InfluxAce Ignacio Van Droogenbroeck.
Ignacio is a Technical Marketing Engineer based in Uruguay. He started a blog about ten years ago, and writes about IT Infrastructure, Cloud, Docker, Linux and Observability.
For the last few months, I have been actively contributing to the InfluxDB community by building InfluxDB Templates for InfluxDB 2.0. InfluxDB is the purpose-built time series database used for metric collection and storage. Let’s build an InfluxDB Template to monitor PostgreSQL together! ????????
In this tutorial, I will show you how to create an InfluxDB Template for InfluxDB 2.0. “InfluxDB Templates” refer not only to the dashboard but also include other elements such as “labels”, “buckets” (where you save information), and Telegraf configurations.
You can use this tutorial as a guide to create other InfluxDB Templates and contribute to this project. Let’s get started!
Requirements for building an InfluxDB Template
One of the first steps to creating an InfluxDB Template is to look at all the available Telegraf input plugins. Using the list as a springboard, I’m able to narrow down InfluxDB Template candidates. On this occasion, I chose to build an InfluxDB Template for PostgreSQL. You can find the Telegraf plugin for PostgreSQL database on GitHub.
Another requirement for building InfluxDB Templates is to have an InfluxDB 2.0 instance running. For example, I have a dedicated Docker container for experimenting and building new InfluxDB Templates.
Setting up InfluxDB 2.0 and Telegraf
One of the main reasons to create an InfluxDB Template is to understand how metrics are exposed by the software. In this case, I dug into the PostgreSQL documentation. It is simple to understand and it is easy to start monitoring the database. As you can see from the Telegraf input below, it’s very easy to understand how it works.
Next, I create a “bucket” in InfluxDB to store these PostgreSQL metrics. I just head up to my instance and navigate to “Load Data/Buckets” and create a Bucket called ‘postgres’. I also set up a label to that resource with the same name (postgres).
Here is my Telegraf configuration which uses the Postgres plugin. You can get the output configuration from InfluxDB GUI:
[[outputs.influxdb_v2]]
  ## The URLs of the InfluxDB cluster nodes.
  ##
  ## Multiple URLs can be specified for a single cluster, only ONE of the
  ## urls will be written to each interval.
  ## urls exp: http://127.0.0.1:9999
  urls = ["http://localhost:9999"]

  ## Token for authentication.
  token = "$INFLUX_TOKEN"

  ## Organization is the name of the organization you wish to write to; must exist.
  organization = "$INFLUX_ORG"

  ## Destination bucket to write into.
  bucket = "postgres"

  [agent]
  interval = "1m"

 [[inputs.postgresql]]
  address = "postgres://postgres:mysecretpassword@localhost:5432"
  ignored_databases = ["template0", "template1"]
Before running Telegraf using this config file, we need to pass some data as variables in this case, the Token and the Organization. You can do so by using the following examples:
export INFLUX_TOKEN='your-token'

export INFLUX_ORG='your-organization'
Once this is done, we’re ready to run Telegraf! ????
Monitoring PostgreSQL with InfluxDB
Let’s start monitoring our database by running Telegraf with debug mode “on” to understand what’s happening.
telegraf --config psql.conf --debugThe result is something like this:
2020-06-12T14:38:35Z I! Starting Telegraf 1.14.3
2020-06-12T14:38:35Z I! Loaded inputs: postgresql
2020-06-12T14:38:35Z I! Loaded aggregators:
2020-06-12T14:38:35Z I! Loaded processors:
2020-06-12T14:38:35Z I! Loaded outputs: influxdb_v2
2020-06-12T14:38:35Z I! Tags enabled: host=thelab
2020-06-12T14:38:35Z I! [agent] Config: Interval:1m0s, Quiet:false, Hostname:"thelab", Flush Interval:10s
2020-06-12T14:38:35Z D! [agent] Initializing plugins
2020-06-12T14:38:35Z D! [agent] Connecting outputs
2020-06-12T14:38:35Z D! [agent] Attempting connection to [outputs.influxdb_v2]
2020-06-12T14:38:35Z D! [agent] Successfully connected to outputs.influxdb_v2
2020-06-12T14:38:35Z D! [agent] Starting service inputs
2020-06-12T14:38:50Z D! [outputs.influxdb_v2] Buffer fullness: 0 / 10000 metrics
2020-06-12T14:39:00Z D! [outputs.influxdb_v2] Buffer fullness: 0 / 10000 metrics
2020-06-12T14:39:10Z D! [outputs.influxdb_v2] Wrote batch of 2 metrics in 145.099172ms
As you can see, Telegraf is running and has started to send metrics to InfluxDB. After a few minutes, you can go to the InfluxDB GUI, specifically to Data Explorer, pick the Bucket “postgres” and see that the measurements and fields are there.
It worked everything is going smoothly and data is being collected. ????????
Visualizing the data
We’re ready to create our dashboard and to consume data. First, I go to Dashboard and then click on Create Dashboard. After that, I name and assign a label. It’s best to use the same name that we used before in this case, the postgres label.
Next, I start playing with the data I already have in InfluxDB. I also take a look at other dashboards created. For example, I check out Grafana dashboards and get ideas from there. The completed dashboard should look like this:
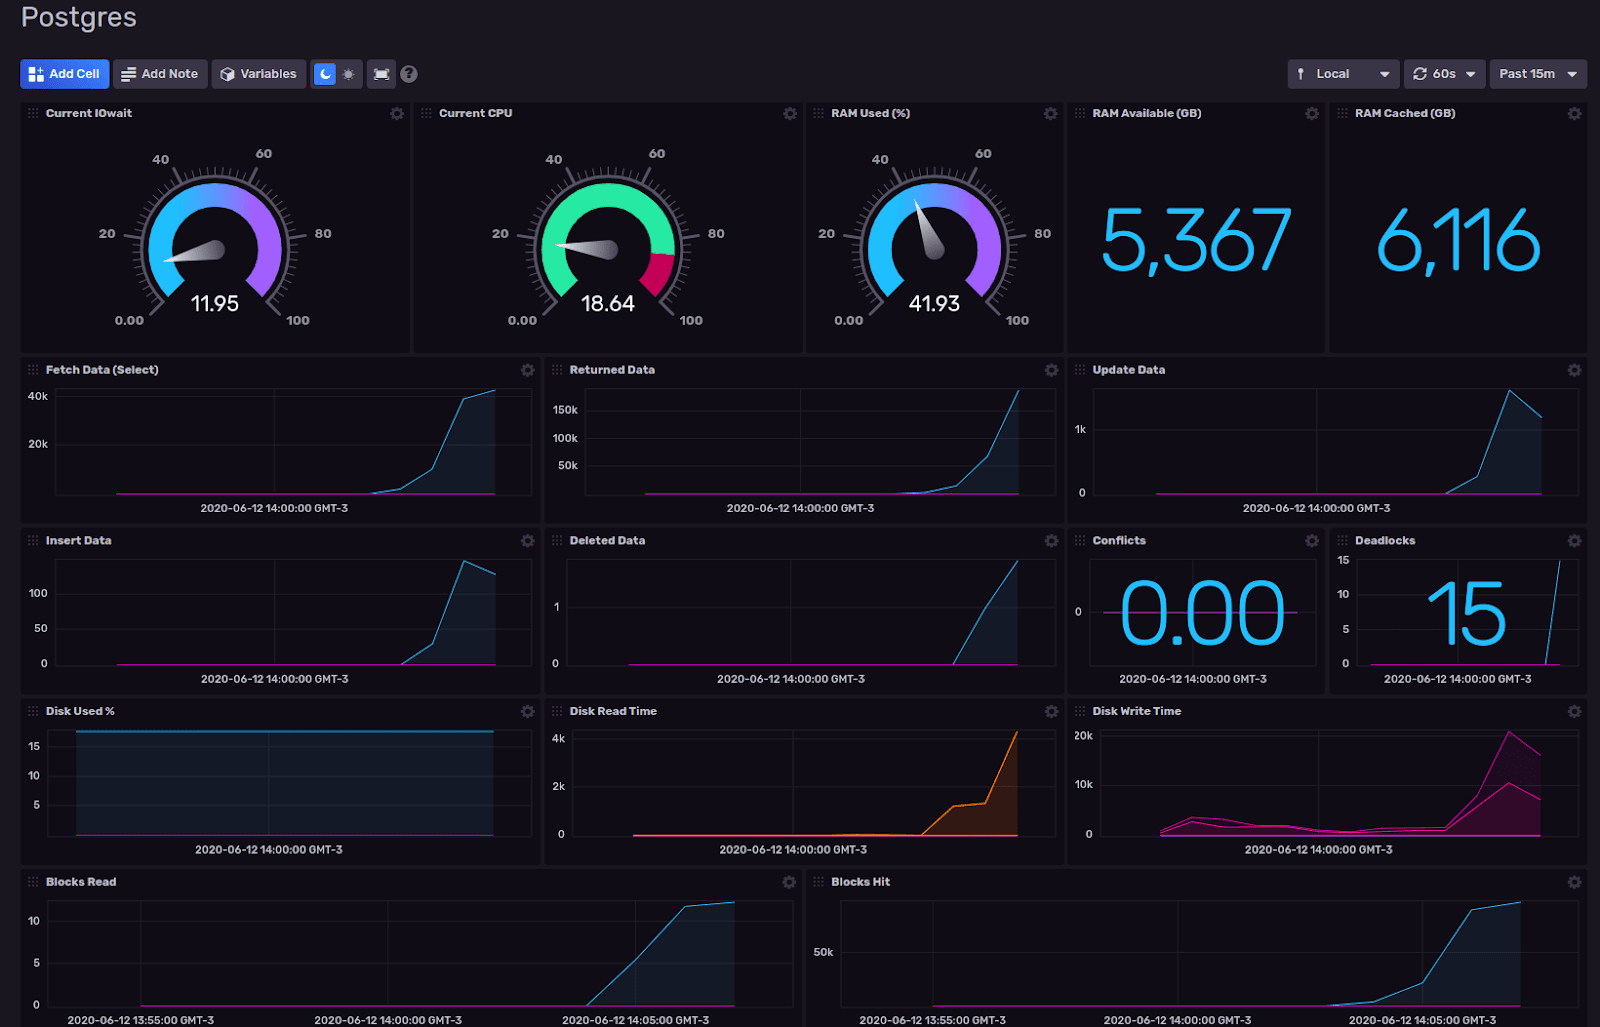
This step is very important because we need to create a dashboard with data that is helpful for the community. If you create a graph with “random” data in any order, the dashboard isn’t going to be used.
Now, for the next fun part, let’s package this template to ship!
Packaging InfluxDB Templates
When I talk about packaging or exporting the template, I mean not only the dashboard but also the Bucket, Telegraf configuration and labels.
We now have our Dashboard, Label, and Bucket in InfluxDB, but we have our Telegraf configuration in a separate file. We need to merge all in one awesome YAML file.
As I run InfluxDB in a Docker container, I need to run the export command as seen below. (Remember: the label that we assigned to the resources, in this process, makes a lot of sense.)
docker exec -it 4d410b0f82ba influx pkg export all --filter labelName=postgres -f postgres.yml -o $INFLUX_ORG -t $INFLUX_TOKENNext, I need to pull out the file from my container to my machine to start editing and merge the Telegraf configuration:
docker cp 4d410b0f82ba:/postgres.yml
The file I just exported looks like this (this is an extract):
apiVersion: influxdata.com/v2alpha1
kind: Label
metadata:
    name: flamboyant-dubinsky-332001
spec:
    color: '#F95F53'
    name: postgres
---
apiVersion: influxdata.com/v2alpha1
kind: Bucket
metadata:
    name: vivid-heisenberg-732003
spec:
    associations:
      - kind: Label
        name: flamboyant-dubinsky-332001
    name: postgres
---
apiVersion: influxdata.com/v2alpha1
kind: Dashboard
metadata:
    name: jovial-montalcini-f32001
spec:
    associations:
      - kind: Label
        name: flamboyant-dubinsky-332001
    charts:
      - colors:
          - hex: '#00C9FF'
            name: laser
            type: min
          - hex: '#9394FF'
            name: comet
            type: max
            value: 100
        decimalPlaces: 2
        height: 3
        kind: Gauge
        name: Current IOwait
        queries:
          - query: |-
                from(bucket: "postgres")
                  |> range(start: v.timeRangeStart, stop: v.timeRangeStop)
                  |> filter(fn: (r) => r["_measurement"] == "cpu")
                  |> filter(fn: (r) => r["_field"] == "usage_iowait")
At the end of the file, we are going to add the Telegraf configuration with some tweaks. Remember that this is a YAML file, so the indents are very important.
The Telegraf config section looks like this:
apiVersion: influxdata.com/v2alpha1
kind: Telegraf
metadata:
    name: postgres-config
spec:
    config: |

        [[outputs.influxdb_v2]]
          ## The URLs of the InfluxDB cluster nodes.
          ##
          ## Multiple URLs can be specified for a single cluster, only ONE of the
          ## urls will be written to each interval.
          ## urls exp: http://127.0.0.1:9999
          urls = ["$INFLUX_HOST"]

          ## Token for authentication.
          token = "$INFLUX_TOKEN"

          ## Organization is the name of the organization you wish to write to; must exist.
          organization = "$INFLUX_ORG"

          ## Destination bucket to write into.
          bucket = "postgres"

          [agent]
          interval = "1m"

        [[inputs.postgresql]]
          # address = "postgres://postgres:mysecretpassword@localhost:5432"
          address = "$PSQL_STRING_CONNECTION"
          ignored_databases = ["template0", "template1"]

        [[inputs.cpu]]
          ## Whether to report per-cpu stats or not
          percpu = true
          ## Whether to report total system cpu stats or not
          totalcpu = true
          ## If true, collect raw CPU time metrics.
          collect_cpu_time = false
          ## If true, compute and report the sum of all non-idle CPU states.
          report_active = false

        [[inputs.disk]]
          ## By default stats will be gathered for all mount points.
          ## Set mount_points will restrict the stats to only the specified mount points.
          # mount_points = ["/"]

          ## Ignore mount points by filesystem type.
          ignore_fs = ["tmpfs", "devtmpfs", "devfs", "iso9660", "overlay", "aufs", "squashfs"]

        # Read metrics about disk IO by device
        [[inputs.diskio]]
          ## By default, telegraf will gather stats for all devices including
          ## disk partitions.
          ## Setting devices will restrict the stats to the specified devices.
          # devices = ["sda", "sdb"]
          ## Uncomment the following line if you need disk serial numbers.
          # skip_serial_number = false
          #
          ## On systems which support it, device metadata can be added in the form of
          ## tags.
          ## Currently only Linux is supported via udev properties. You can view
          ## available properties for a device by running:
          ## 'udevadm info -q property -n /dev/sda'
          ## Note: Most, but not all, udev properties can be accessed this way. Properties
          ## that are currently inaccessible include DEVTYPE, DEVNAME, and DEVPATH.
          # device_tags = ["ID_FS_TYPE", "ID_FS_USAGE"]
          #
          ## Using the same metadata source as device_tags, you can also customize the
          ## name of the device via templates.
          ## The 'name_templates' parameter is a list of templates to try and apply to
          ## the device. The template may contain variables in the form of '$PROPERTY' or
          ## '${PROPERTY}'. The first template which does not contain any variables not
          ## present for the device is used as the device name tag.
          ## The typical use case is for LVM volumes, to get the VG/LV name instead of
          ## the near-meaningless DM-0 name.
          # name_templates = ["$ID_FS_LABEL","$DM_VG_NAME/$DM_LV_NAME"]

        # Read metrics about memory usage
        [[inputs.mem]]
          # no configuration
Note: I converted the PostgreSQL string connection to a variable. The credentials were originally hard-coded in the file, but now can be set through an environment variable.
$ export PSQL_STRING_CONNECTION=postgres://postgres:mysecretpassword@localhost:5432
After saving the file, we’re ready to test to see if the import process goes well and to see if the InfluxDB Template is ready to ship. First, I copy the new YAML file in the container.
docker cp postgres.yml 4d410b0f82ba:/
Then I run the import process:
docker exec -it 4d410b0f82ba influx pkg -f postgres.yml -o $INFLUX_ORG -t $INFLUX_TOKEN
Once everything is set, the response from my terminal should look like this:
LABELS    +add | -remove | unchanged
+-----+----------------------------+------------------+---------------+---------+-------------+
| +/- |        PACKAGE NAME        |        ID        | RESOURCE NAME |  COLOR  | DESCRIPTION |
+-----+----------------------------+------------------+---------------+---------+-------------+
|     | flamboyant-dubinsky-332001 | 05d639e9629a9000 | postgres      | #F95F53 |             |
+-----+----------------------------+------------------+---------------+---------+-------------+
|                                                                        TOTAL  |      1      |
+-----+----------------------------+------------------+---------------+---------+-------------+

BUCKETS    +add | -remove | unchanged
+-----+-------------------------+------------------+---------------+------------------+-------------+
| +/- |      PACKAGE NAME       |        ID        | RESOURCE NAME | RETENTION PERIOD | DESCRIPTION |
+-----+-------------------------+------------------+---------------+------------------+-------------+
|     | vivid-heisenberg-732003 | 05d639b5fdf32000 | postgres      | 0s               |             |
+-----+-------------------------+------------------+---------------+------------------+-------------+
|                                                                         TOTAL       |      1      |
+-----+-------------------------+------------------+---------------+------------------+-------------+

DASHBOARDS    +add | -remove | unchanged
+-----+--------------------------+----+---------------+-------------+------------+
| +/- |       PACKAGE NAME       | ID | RESOURCE NAME | DESCRIPTION | NUM CHARTS |
+-----+--------------------------+----+---------------+-------------+------------+
| +   | jovial-montalcini-f32001 |    | Postgres      |             | 17         |
+-----+--------------------------+----+---------------+-------------+------------+
|                                                          TOTAL    |     1      |
+-----+--------------------------+----+---------------+-------------+------------+

TELEGRAF CONFIGURATIONS    +add | -remove | unchanged
+-----+-----------------+----+-----------------+-------------+
| +/- |  PACKAGE NAME   | ID |  RESOURCE NAME  | DESCRIPTION |
+-----+-----------------+----+-----------------+-------------+
| +   | postgres-config |    | postgres-config |             |
+-----+-----------------+----+-----------------+-------------+
|                                   TOTAL      |      1      |
+-----+-----------------+----+-----------------+-------------+

LABEL ASSOCIATIONS    +add | -remove | unchanged
+-----+---------------+--------------------------+---------------+------------------+----------------------------+------------+------------------+
| +/- | RESOURCE TYPE |  RESOURCE PACKAGE NAME   | RESOURCE NAME |   RESOURCE ID    |     LABEL PACKAGE NAME     | LABEL NAME |     LABEL ID     |
+-----+---------------+--------------------------+---------------+------------------+----------------------------+------------+------------------+
|     | buckets       | vivid-heisenberg-732003  | postgres      | 05d639b5fdf32000 | flamboyant-dubinsky-332001 | postgres   | 05d639e9629a9000 |
+-----+---------------+--------------------------+---------------+------------------+----------------------------+------------+------------------+
+-----+---------------+--------------------------+---------------+------------------+----------------------------+------------+------------------+
| +   | dashboards    | jovial-montalcini-f32001 | Postgres      |                  | flamboyant-dubinsky-332001 | postgres   | 05d639e9629a9000 |
+-----+---------------+--------------------------+---------------+------------------+----------------------------+------------+------------------+
|                                                                                                                    TOTAL    |        2         |
+-----+---------------+--------------------------+---------------+------------------+----------------------------+------------+------------------+
As you can see, the import process made some checks and recognized our template our PostgreSQL InfluxDB Template is ready! ????
Ready to build your own InfluxDB Template?
I find building InfluxDB Templates very fun and interesting, and I’m happy to share my process to make one. I hope this article was helpful I can’t wait to see what the community is capable of building!
Want to contribute to InfluxDB Templates? Take a look at this GitHub Repo and read the contribution guidelines. Click here to discover other InfluxDB Templates that have already been developed.
If you have any issues, I’m happy to help. Find me on the InfluxDB Community Slack workspace @Ignacio Van Droogenbroeck. Be sure to check out the #Templates channel come say hi! Or let me know on Twitter if you’re using this dashboard and how.
Additional resources
- How to Start a Docker Instance for InfluxDB (in Spanish)
- How to Monitor Linux with InfluxDB 2.0 Beta (in Spanish)
- Tracking COVID-19 Data in South America Using Telegraf and InfluxDB
- Not ready to try InfluxDB 2.0? Try InfluxDB v1.8, Chronograf and Kapacitor - TICK Stack (in Spanish)
