Introduction to InfluxData's InfluxDB and TICK Stack
By
Gunnar Aasen
updated October 13, 2023
Product
Developer
Company
Navigate to:
InfluxData provides a Modern Time Series Platform, designed from the ground up to handle metrics and events. InfluxData’s products are based on an open source core. This open source core consists of the projects Telegraf, InfluxDB, Chronograf, and Kapacitor - collectively called the TICK Stack.
What is a Time Series?
A time series is simply any set of values with a timestamp where time is a meaningful component of the data. The classic real world example of a time series is stock currency exchange price data. For example, the chart below (from Coinbase Charts) shows the US dollar to bitcoin exchange price for the past month.
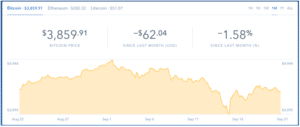
As you can see in the graph above, the USD price of Bitcoin is displayed over time. The underlying data set used to create this graph is composed of many timestamped values, which together form a set of values. This set of values is a time series.
At this point you may be wondering…
Why is This Special?
The graph above displays a couple of thousand points across a month’s worth of data. However, cryptocurrencies like Bitcoin are traded frequently, so the underlying data set used to derive the graph likely contains several tens of millions of data points. In fact, there is usually so much data in most time series that it’s almost always summarized when it is displayed, and a screen doesn’t have enough pixels to display the full granularity of the data. There are other cryptocurrencies too, and thousands of regular currencies being exchanged.
The amount of time series data being generated is simply enormous. This scale has been one of the primary drivers behind the creation of specialized data stores for time series data.
What Exactly is a Time Series Database?
Time Series Databases typically need to solve two problems: high write throughput and high query rates. Let’s go into more depth on these points.
- Write throughput: The amount of time series generated by, say, monitoring a fleet of servers can quickly grow from thousands of new values per second to millions of new values per second. Inserting that amount of data into a regular relational database, like MySQL and PostgreSQL, quickly knocks over most systems without careful tuning. Even then, there are limits to the amount of data a system can accept at any one time.
- Query throughput: One aspect of time series data is that new data is almost always more valuable than the old data. Again, think of a fleet of servers. Knowing that one server has started to use up all its CPU is much more useful than looking at the evidence even minutes after the CPU spiked. The real-time nature of time series makes it necessary to expose new data in queries as fast as possible. Additionally, not every point matters in a time series. Like the bitcoin chart above, most time series data is summarized into intermediate values because trends provide more information than individual data points.
Because a Time Series Database specializes in processing timestamped data, there are many optimizations available to address the two fundamental issues above along with a few others.
- Compression: Since all time series consist of timestamped data, a significant amount of compression is possible.
- Query functions: Speed is not the only important thing in queries.
What is InfluxDB?
InfluxDB is a high performance Time Series Database. It can store hundreds of thousands of points per second. The InfluxDB SQL-like query language was built specifically for time series. Check out the InfluxDB documentation to start learning more.
What is the TICK Stack?
The TICK Stack is an acronym for a platform of open source tools built to make collection, storage, graphing, and alerting on time series data incredibly easy. The “I” in TICK stands for InfluxDB. The other components in the platform are:
- Telegraf: A metrics collection agent. Use it to collect and send metrics to InfluxDB. Telegraf's plugin architecture supports collection of metrics from 100+ popular services right out of the box.
- Chronograf: A UI layer for the whole TICK stack. Use it to set up graphs and dashboards of data in InfluxDB and hook up Kapacitor alerts.
- Kapacitor: A metrics and events processing and alerting engine. Use it to crunch time series data into actionable alerts and easily send those alerts to many popular products like PagerDuty and Slack.
The entire TICK Stack is interoperable, yet each component can provide significant value as a standalone installation.
The rest of this guide will explain how to set up the TICK stack on macOS for development and testing.
Step 1: Install the TICK Stack
On macOS, installation of the TICK stack is a breeze using the Homebrew package manager.
brew install telegraf

brew install influxdb

brew install chronograf

brew install kapacitor
The above commands will install several binaries into your path. The important ones are telegraf, influxd (the InfluxDB server), influx (the InfluxDB CLI), chronograf, kapacitord (the Kapacitor server), and kapacitor (the Kapacitor CLI).
Step 2: Configure the TICK Stack
Telegraf, InfluxDB, and Kapacitor all use configuration files. Most configuration values in the TICK Stack do not need to be changed out of the box on macOS. In fact, Chronograf does not require a configuration file and can be configured entirely via CLI flags. Here are the commands to generate a new config file for the other three components:
# The telegraf config generated here will be already set up to only gather CPU, memory, and system metrics.

telegraf --input-filter cpu:mem:system --output-filter influxdb config > /usr/local/etc/telegraf.conf

influxd config > /usr/local/etc/influxdb.conf

kapacitord config > /usr/local/etc/kapacitor.conf
On macOS, InfluxDB, Chronograf, and Kapacitor will store their data in the default directories at ~/.influxdb, ~/.chronograf, and ~/.kapacitor, respecitvely. These locations can be overridden in the configuration files, but do not need to be changed right now.
Step 3: Run the TICK Stack
Now that configuration files have been generated, spinning up the TICK Stack is very easy using Homebrew services.
brew services start telegraf

brew services start influxdb

brew services start chronograf

brew services start kapacitor
This will start all the TICK component processes in the background. The logs for Homebrew services can be found in the /usr/local/var/log directory if you run into any trouble.
Voilà! The TICK Stack is now running. In this setup, Telegraf is collecting CPU and memory metrics and writing them to InfluxDB’s telegraf database, which was automatically created.
There are several ways to interact with the stack. InfluxDB and Kapacitor have APIs available, along with CLI tools to make it easier to interact with their APIs. Additional Telegraf plugins can be configured to gather additional data as well. Finally, Chronograf provides a UI for data in InfluxDB.
Let’s open Chronograf in the browser to see the data being collected. Navigate to http://localhost:8888. This will bring up a configuration page. Using the default settings will automatically connect InfluxDB to Chronograf and allow you to begin exploring the local system data you’ve started collecting in InfluxDB.
Next Steps
To learn more about InfluxDB and the TICK Stack, read through the InfluxDB Getting Started guide. Then take a look at the InfluxDB key concepts doc, which is a great overview of the InfluxDB data model.
Check out the Getting Started guides for Telegraf and Kapacitor. If you have questions or hit errors, we recommend checking out the InfluxData Community. Finally, the TICK Stack is open source and always welcomes new contributors.
