PTC Kepware and InfluxDB: Collecting and Storing Your Automation Data
By
Jay Clifford
updated December 14, 2025
Product
Use Cases
Developer
Navigate to:

If you have worked in the automation sector for some time, it is likely you have come across or at least heard of PTC Kepware. They provide one of the largest connectivity suites for automation devices such as PLC’s easing the bridge between the OT (Operation Technology) and IT (Information Technology) world.
The best part? You can store, transform and visualize this data using InfluxDB. This blog post will take you through the different ways of connecting your Kepware instance to InfluxDB.
Kepware Edge
A small disclaimer for this tutorial: I used ThingWorx Kepware Edge. It is a slimline cousin to KEPServerEX. Just a few things to keep in mind:
- It's headless (no user GUI, interaction is via a REST API)
- Runs on Ubuntu 18.04
- Has a smaller driver set to KEPServerEX (Modbus Ethernet, Allen-Bradley, ControlLogix Ethernet, Siemens TCP/IP Ethernet and more drivers are being added over time)
- Supports OPC UA Server interface, publishing MQTT messages, and ThingWorx AlwaysOn protocol for a native connection to ThingWorx.
- While the instance was installed directly to the Linux OS, it is also available as a Microsoft Azure IoT Edge Runtime Module, and as a generic Docker Container
Since under the hood KEPServerEX and Edge share a similar core architecture this tutorial will work for both (I will highlight any key differences if required).
Setup
Note: This tutorial will make use of the default loaded sample project for Kepware Edge. To connect your own devices consult the official Kepware documentation.

We will use Telegraf to stream our data from Kepware to InfluxDB. There are two protocols we can use to configure this connection:
- OPC UA
- MQTT
Telegraf has plugins that support both these protocols no coding is required.
Before we begin, you need to install Telegraf. Install instructions can be found here.
Option 1 - OPC UA
OPC UA (Unified Architecture) is a machine to machine industrial protocol that has become extremely popular within the automation sector in recent years. This has largely been driven by the OPC UA Foundation who promote open connectivity, interoperability and integrated security as part of the standard. In its infancy, OPC UA was primarily used to connect devices such as PLC’s to SCADA (Supervisory Control and Data Acquisition) systems.
Under the hood, Kepware is built on top of an OPC UA server. This means we can use our Telegraf client to directly interface with Kepware. Here is the rundown:
1. First, we need to generate our Telegraf config. To do this, we will use the OPC UA Client Input Plugin. Here is our config (You can find the full config here to send your data to InfluxDB with the InfluxDB Output Plugin):
[[inputs.opcua]]
  name = "opcua"
  endpoint = "opc.tcp://localhost:49330"

   security_policy = "auto"
   security_mode = "auto"

   certificate = ""
   private_key = ""

auth_method = "UserName"
   username = "########"
   password = "########"

   nodes = [
    {name="Tag1", namespace="2", identifier_type="s", identifier="Channel1.Device1.Tag1"},
    {name="Tag2", namespace="2", identifier_type="s", identifier="Channel1.Device1.Tag2"},
  ]
The breakdown:
- First, we specify a name and an endpoint. The name is arbitrary as it will act as our measurement name. The endpoint is required to point to your Kepware Server. Note the default OPC UA endpoint port for Kepware is 49330.
- Next, we establish our security policy and mode. Our client and the Kepware server are smart enough to communicate their requirements with one another so we can leave these set to auto (note it may be the case that your instance of Kepware has restricted discovery which might require manual selection of the security policy).
- Since we are establishing a security policy which in most cases will be Basic256Sha256, signed and encrypted we require a certificate and private key. For our use case, we can leave the paths empty. The client will generate a self-signed certificate.
- The final layer of security requires an authentication method. This can be done via a user, certificate or anonymously (not recommended for production). In our use case, we will use a username and password to connect to Kepware securely. I would advise looking into user management via the official Kepware documentation.
- Lastly, we identify our Tags. Not to be confused with InfluxDB's tag notation. Kepware uses tags to represent data variables (can closely be associated with fields in InfluxDB terms). Since we are using the default project we only have two tags to collect from (Tag1 and Tag2).
2. We can now start our Telegraf service pointing to our OPC-UA config:
telegraf --config ./telegraf-opcua.conf
Notice how we currently receive this error:
2021-11-16T11:57:48Z E! [inputs.opcua] Error in plugin: error in Client Connection: EOF
2021-11-16T11:57:50Z E! [inputs.opcua] Error in plugin: error in Client Connection: EOF
Not a great error message, I know! Essentially what is happening here is our client is generating a certificate and sending it to Kepware. From there Kepware places the certificate within its trust store where it is rejected by default. For security reasons, it is our action to manually approve this connection.
3. To accept our self-signed certificate you need to run the following command on the system running your Kepare Edge Server:
sudo /opt/tkedge/v1/edge_admin manage-truststore uaserver --list
This will present you with a list of certificates currently stored within Kepware:
Thumbprint                                  Status       Common Name
5a5d2c63283b6ad8cd1bd0ad4137f4fd93706124    Trusted      UaBrowser
9ccd3ed34655e0dce281e1e52b971b2c3391475b    Rejected     Telegraf OPC UA client
As you can see our client as predicted is rejected. To approve our client we run the following command:
sudo /opt/tkedge/v1/edge_admin manage-truststore uaserver --force --trust 9ccd3ed34655e0dce281e1e52b971b2c3391475bNote: Since we are using self-signed certificates generated by Telegraf heed these warnings:
- You must use the force flag to accept a self-signed certificate as it's considered an insecure method of connection.
- Since Telegraf is auto-generating our certificate on start, you will be required to accept a new certificate on restarting Telegraf. It is highly recommended to use your own certificates.
Certificates can be approved via the OPC UA Configuration Manager for KEPServerEX.
4. Telegraf will now start writing data to your InfluxDB instance.
Option 2 - MQTT
MQTT is an open-source lightweight pub/sub protocol heavily used within IoT based applications. It is worth noting that although popular MQTT is not considered an OT protocol like Modbus, OPC UA or CAN. Luckily Kepware provides a bridge called the IoT Gateway which automatically transforms data from the Kepware server into JSON and sends this data to an MQTT broker of your choice.
We will use Telegraf’s built-in MQTT client to pull this data from the broker and automatically store it in InfluxDB:
1. First, we need to generate our Telegraf config. To do this we will use the MQTT Consumer Input Plugin. Here is our config (You can find the full config here to send your data to InfluxDB with the InfluxDB Output Plugin):
[[inputs.mqtt_consumer]]

  servers = ["tcp://192.168.1.220:1883"]
  topics = [
    "iotgateway",
  ]
  data_format = "json_v2"

 [[inputs.mqtt_consumer.json_v2]]
     measurement_name = "kepware_edge5"
       [[inputs.mqtt_consumer.json_v2.object]]
        path = "@this"
        disable_prepend_keys = true
        timestamp_path = "timestamp"
        timestamp_format = "unix"
        excluded_keys = ["timestamp"]

[[processors.starlark]]
  source = '''
def apply(metric):
    v = metric.fields.get('id')

    if v == None:
      return metric

    metric.tags['id'] = v
    return metric
'''
The breakdown:
- First, we specify a server. The server is required to point to your MQTT broker. Note that I am running a Mosquitto server on the same machine as my Kepware server using the default port 1883.
- Next, we establish the topic we wish to subscribe to. By default, Kepware IoT gateway will publish its data on the following topic: iotgateway.
- Lastly, since the data being sent by the IoT gateway is in JSON format we set our own data format accordingly using the json_v2 parser.
- Since our data comes in as an array of objects we have to be slightly clever. First, we disable_prepend_key in order to get the exact key name. We then use timestamp_path to assign the Kepware timestamp as our metric timestamp. Lastly we use exclude_key to remove timestamp as a field.
- A slight issue, since each object is part of the same array and we have disabled prepend keys the metrics are essentially overwriting one another. To solve this, I use a processor plugin called Starlark to change the id field into a tag, thus separating our data.
2. If you haven’t already, make sure your MQTT broker is installed and running. I am using Mosquitto. For install instructions, check out this page.
3. We can now start our Telegraf service pointing to our OPC-UA config:
telegraf --config ./telegraf-mqtt.conf
4. Lastly, we need to configure the Kepware IoT gateway (Search for IoT Gateway in the following documents):
- Kepware Server EX can be configured through the configuration UI
- Kepware Server Edge can be configured via the REST API
Conclusion
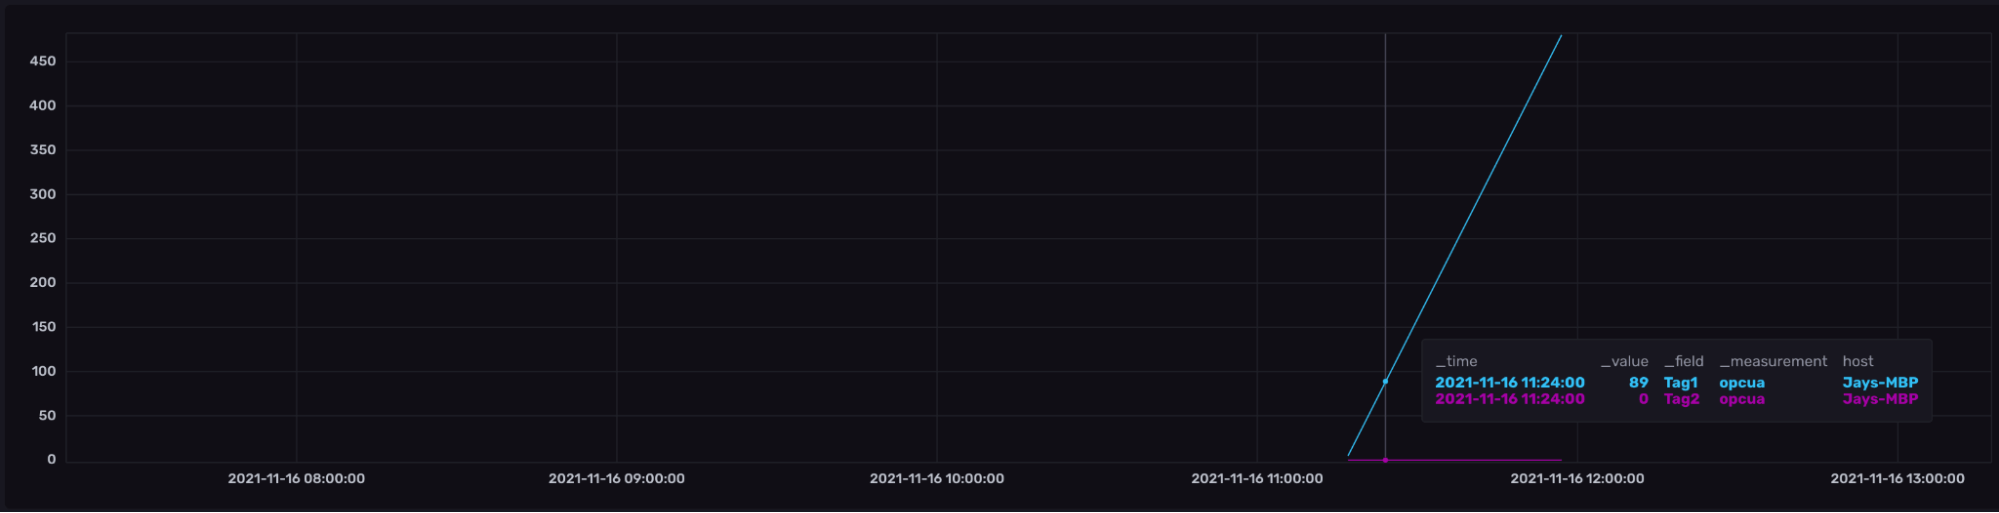
As you can now see, we are collecting data from our Kepware Server and storing the tags directly into InfluxDB. Once you start to collect your own machine data, your visualizations will look far more interesting than mine.
I would also recommend checking out the following blog posts to see what you could do next with your automation data:
- Storing, Processing and Visualizing Data with the ogamma Visual Logger for OPC and InfluxDB.
- IoT Prototyping with InfluxDB Cloud (Part 2): Queries, Tasks and Dashboards
- InfluxDB and GeoData – Emergency Generators
If you would like to trial ThingWorx Kepware Edge or KEPServerEX, then check out this website. Trials are free and come with a time-limited license. If you get stuck or want to discuss your own use case, head over to the InfluxData Slack and Community forums (just make sure to @Jay Clifford). Let’s continue the discussion there!
