Querying Data in InfluxDB Using Flux and SQL
By
Anais Dotis-Georgiou
updated February 21, 2024
Product
Navigate to:
(Update: InfluxDB 3.0 moved away from Flux and a built-in task engine. Users can use external tools, like Python-based Quix, to create tasks in InfluxDB 3.0.)
With the release of InfluxDB’s new storage engine for InfluxDB Cloud, InfluxDB Cloud now supports SQL. This is because the updated InfluxDB uses the Apache Arrow DataFusion project as a key building block for its query execution engine. DataFusion’s sophisticated query optimizations support near unlimited cardinality data in InfluxDB Cloud. Another benefit of DataFusion is that it offers a PostgreSQL-compatible SQL implementation, which is how InfluxDB Cloud now supports SQL for querying your time series data, in addition to Flux. Using SQL to query in InfluxDB Cloud offers the following advantages:
- Many technologies leverage PostgreSQL, which means incorporating the PostgreSQL wire protocol in InfluxDB offers query compatibility with the following databases (and more):
- Postgresql
- QuestDB
- CockroachDB
- CrateDB
- YugabyteDB
- Timescale
To learn more about this topic, I encourage you to read The world of PostgreSQL wire compatibility. Additionally, you can use PostgreSQL database adapters with the language of your choice, like Psycopg to execute SQL in a Python script.
-
You can migrate SQL queries from another PostgreSQL compatible database.
-
If you’re already familiar with SQL and you don’t want to learn Flux, then you have a viable option for querying InfluxDB.
-
You want to take advantage of an extremely performant columnar database. To learn more about how the new InfluxDB uses Rust, Apache Arrow, DataFusion, and Parquet to support unlimited cardinality use cases, read InfluxDB IOx and the Commitment to Open Source and Querying Parquet with Millisecond Latency.
- You can query all data to quickly return global last, first, min, and max values without specifying a time range. This functionality has been a long-requested feature by Flux users.
To learn more about the languages that InfluxDB supports and their advantages, take a look at The Best Query Language to Use with InfluxDB.
In this post we’ll learn how to write basic Flux queries using equivalent SQL queries. In the process we’ll also learn how to perform basic queries with SQL. This post aims to help users leverage SQL, whether they are Flux users familiar with InfluxDB or newcomers. To try SQL queries in InfluxDB Cloud, sign up here.
For this post we’ll use the air sensor sample dataset. You can write this sample dataset to a bucket with in the Data Explorer after creating a bucket:
import "influxdata/influxdb/sample"
sample.data(set: "airSensor")
|> to(bucket: "example-bucket")
The air sensor sample dataset contains the following schema:
-
1 measurement: airSensors
-
3 fields: co, humidity, and temperature
-
1 tag: sensor_id
-
8 sensor_id tag values: TLM0100, TLM0101, TLM0102, TLM0103, TLM0200, TLM0201, TLM0202, TLM0203
In order to take advantage of SQL in InfluxDB Cloud, toggle on the new Script Editor. The new Script Editor in InfluxDB Cloud has the following new features:
-
The ability to save and open scripts.
-
Create SQL or Flux scripts.
-
Use the Query Builder as a no code solution that populates the Script Editor with code or use the Script Editor directly.
-
View your results in a table or graph.

Basic Flux query
If you’re not a Flux user, skip this section.
Let’s query for temperature data from one tag, TLM0100. Our Flux query would look like this:
from(bucket: "anais-iox")
    |> range(start: 2022-12-01T19:05:41.000Z, stop: now())
    |> filter(fn: (r) => r._measurement == "airSensors")
    |> filter(fn: (r) => r._field == "temperature")
    |> filter(fn: (r) => r.sensor_id == "TLM0100")
Now let’s take a look at the results:

Everything returns as expected, except that the query removes the _start and _stop columns from the query result. The resulting table still splits data into _field and _value columns. Next, let’s take a look at how to query for the same data with SQL.
Basic SQL query
Let’s query for temperature data from one tag, TLM0100. Our SQL query would look like this:
SELECT "sensor_id", "temperature", "time" FROM "airSensors"
where time >= ('2022-12-01 19:05:41.000')::TIMESTAMP
and time < now()::TIMESTAMP and sensor_id = 'TLM0100'
Note: you can also use SELECT * to return all columns simultaneously.
We select for the columns we want from the measurement. We also apply a where clause to specify a time range as well as to filter for a particular sensor ID. We can use the panel to the left of the Script Editor in the UI to select the bucket.
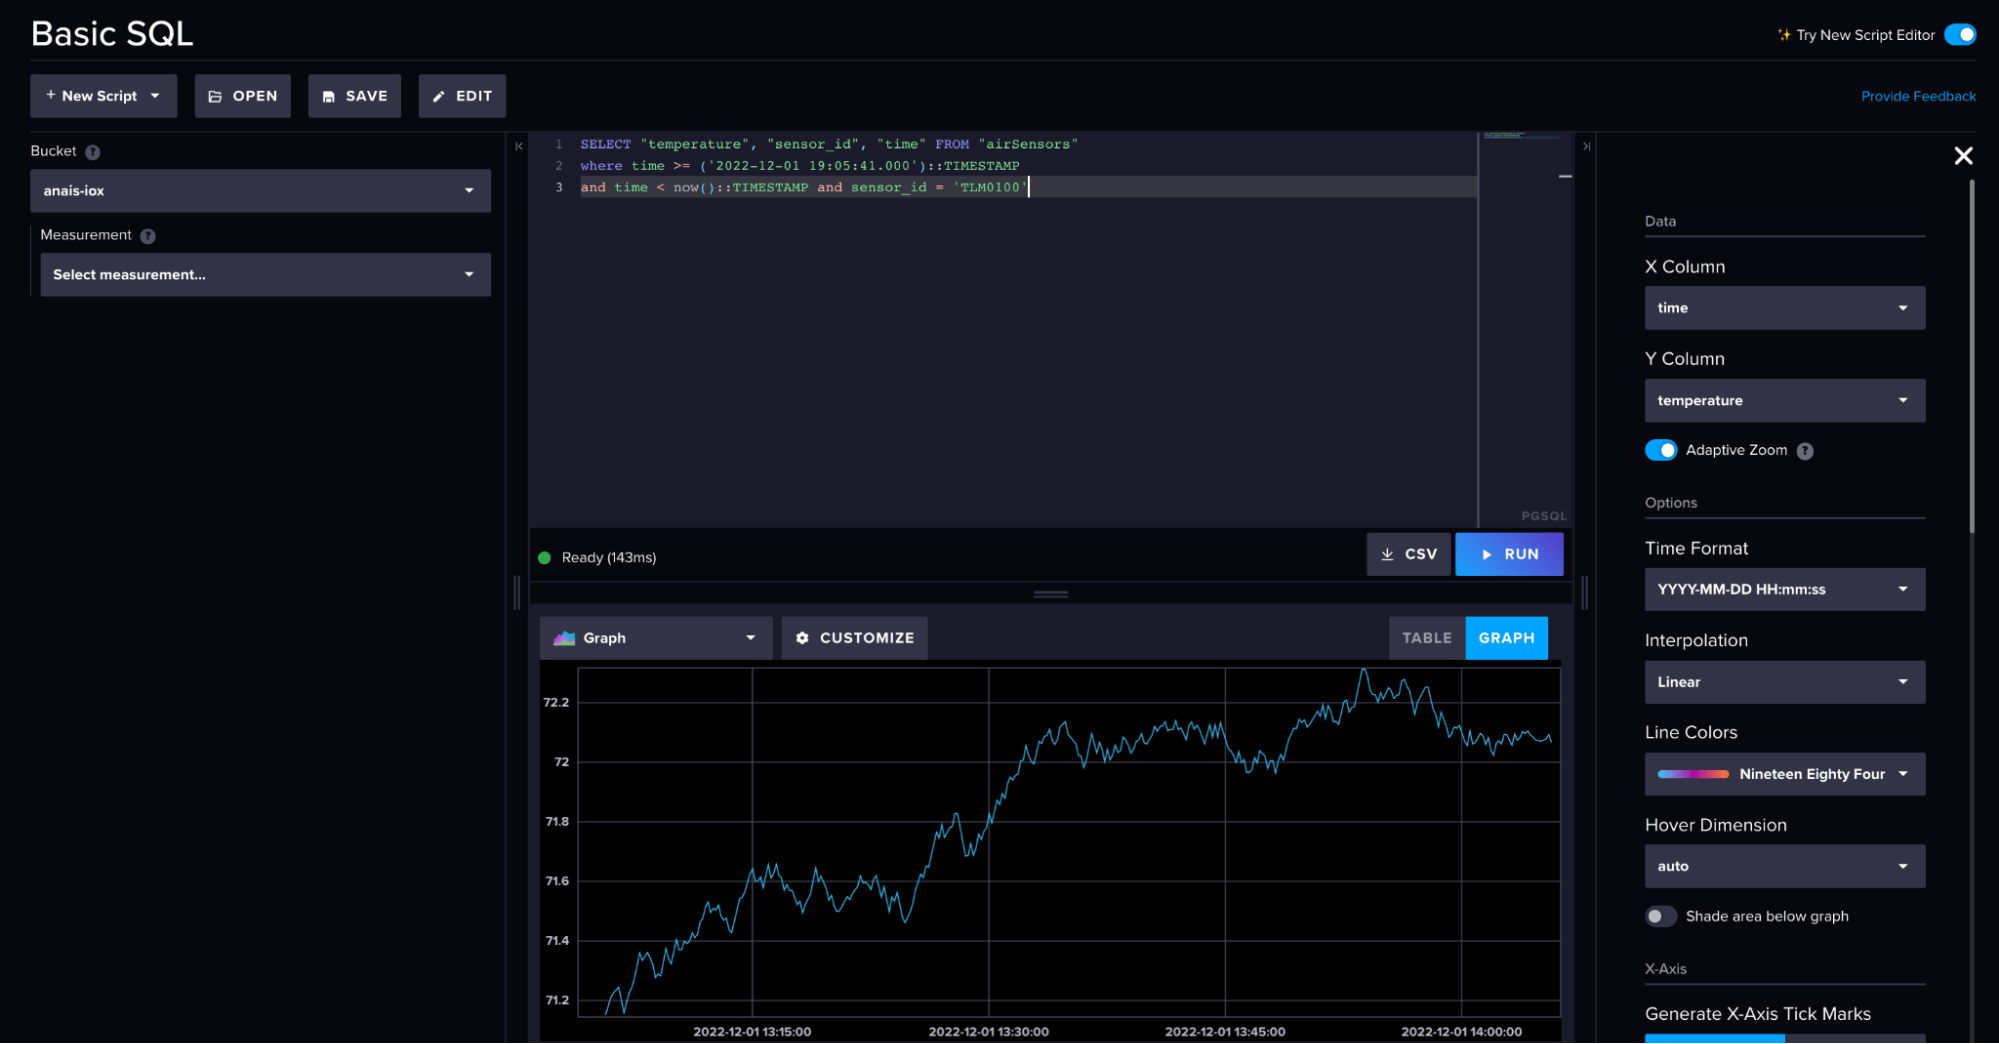
Let’s take a look at the table results:

If you come from a Flux background, you’ll notice some surprising differences. First, you can see that the returned data looks like the SQL query pivoted it, or applied a fieldsAsCols() function. The second thing to notice is that results return only the columns that we queried. Since we didn’t select a measurement, the result stream doesn’t include a measurement. Additionally, the query renamed the _time column to time. Finally, notice that the number of tables and rows the query returned (left of the Table button) matches the Flux query above. This is helpful for confirming result expectations and understanding the shape of the data.
Basic Flux query with the iox.from() function
To query the new InfluxDB Cloud engine with Flux and return output that looks the same as SQL queries, use the iox.from() function. The iox.from() function returns the data as though it were pivoted on time.
import "experimental/iox"
data = iox.from(bucket: "anais-iox", measurement: "airSensors")
|> range(start: 2022-12-01T19:05:41.000Z, stop: now())
|> filter(fn: (r) => r.sensor_id == "TLM0100")
|> yield()
Now let’s take a look at the results:

The iox.from() function returns all fields by default. To reduce the result to include only your desired fields (i.e. temperature, like we did in the previous section) use the keep() or drop() functions.
Flux to SQL query translations
Now that we understand some of the basics behind querying with SQL, let’s take a look at some functionally equivalent queries. In this section we’ll use the iox.from() function. Flux results will vary from the SQL results in that the Flux results contain other field data (temperature, co, humidity). Additionally, the shape of the data differs slightly between SQL and Flux. SQL queries always return one table while Flux can return multiple tables. You need to use additional functions, like group(), union(), or keep() to yield identical results between the two queries.
| SQL | Flux |
|---|---|
| 1. Temperature from the last 5 minutes | |
SELECT "temperature" FROM "airSensors" WHERE time > (NOW() - INTERVAL '5 MINUTES') |
import "experimental/iox" iox.from(bucket: "anais-iox", measurement: "airSensors") |> range(start: -5m, stop: now()) |
| 2. Min, max, mean temperature for one sensor | |
SELECT min("temperature"),
max("temperature"), a
vg("temperature") FROM "airSensors"
WHERE time >= ('2022-12-01
19:05:41.000')::TIMESTAMP
and time < now()::TIMESTAMP and
sensor_id = 'TLM0100'
|
import "experimental/iox" data = iox.from(bucket: "anais-iox", measurement: "airSensors") |> range(start: 2022-12-01T19:05:41.000Z, stop: now()) |> filter(fn: (r) => r.sensor_id == "TLM0100") data |> min(column: "temperature") |> yield(name: "min") data |> max(column: "temperature") |> yield(name: "max") data |> mean(column: "temperature") |> yield(name: "mean") |
| 3. Min, max, mean temperature for each sensor | |
SELECT min("temperature"),
max("temperature"),
avg("temperature"),
"sensor_id" FROM "airSensors"
WHERE time >= ('2022-12-01
19:05:41.000')::TIMESTAMP
and time < now()::TIMESTAMP GROUP
BY "sensor_id"
ORDER BY "sensor_id"
|
import "experimental/iox" data = iox.from(bucket: "anais-iox", measurement: "airSensors") |> range(start: 2022-12-01T19:05:41.000Z, stop: now()) data |> min(column: "temperature") |> yield(name: "min") data |> max(column: "temperature") |> yield(name: "max") data |> mean(column: "temperature") |> yield(name: "mean") |
| 4. Min, max, mean temperature for all sensors | |
SELECT min("temperature"),
max("temperature"),
avg("temperature") FROM "airSensors"
WHERE time >= ('2022-12-01
19:05:41.000')::TIMESTAMP
and time < now()::TIMESTAMP
|
import "experimental/iox" data = iox.from(bucket: "anais-iox", measurement: "airSensors") |> range(start: 2022-12-01T19:05:41.000Z, stop: now()) |> group() data |> min(column: "temperature") |> yield(name: "min") data |> max(column: "temperature") |> yield(name: "max") data |> mean(column: "temperature") |> yield(name: "mean") |
| 5. Filter for a temperature value > 72.0 for one sensor | |
SELECT "temperature" FROM
"airSensors"
WHERE time >= ('2022-12-01
19:05:41.000')::TIMESTAMP
and time < now()::TIMESTAMP and
sensor_id = 'TLM0100' and
temperature > 72.0
|
import "experimental/iox" iox.from(bucket: "anais-iox", measurement: "airSensors") |> range(start: 2022-12-01T19:05:41.000Z, stop: now()) |> filter(fn: (r) => r.sensor_id == "TLM0100") |> filter(fn: (r) => r.temperature > 72.0) |
| 6. Truncate timestamps to the second | |
SELECT "temperature",
date_trunc('second',
time::timestamp) as time  FROM
"airSensors"
WHERE time > (NOW() - INTERVAL '5 MINUTES')
and sensor_id = 'TLM0100'
|
import "experimental/iox"
import "date"
iox.from(bucket: "anais-iox",
measurement: "airSensors")
|> range(start: -5m, stop: now())
|> filter(fn: (r) => r.sensor_id
== "TLM0100")
|> map(fn: (r) => ({r with _time:
date.truncate(t: r._time, unit: 1s))
|
| 7. Calculating the mean temperature every hour across all sensors | |
SELECT
DATE_BIN(INTERVAL '1' minute,
time, TIMESTAMP '2022-01-01
00:00:00Z') AS time,
avg("temperature")  as mean
FROM "airSensors"
GROUP BY 1
ORDER BY 1 DESC
// The ORDER BY function is optional.
It’s like adding a sort() function with Flux.
|
import "experimental/iox" iox.from(bucket: "anais-iox", measurement: "airSensors") |> range(start: 2022-12-01T19:05:41.000Z, stop: now()) |> aggregateWindow(every: 1h, fn: mean, createEmpty: false) //The window bounds are different between SQL and Flux. SQL returns the start of the window. Flux returns to the end of the window. |
Aggregate Window in SQL
Now that we understand how to perform some basic SQL queries, let’s take a look at one last example, how to translate an aggregateWindow() function to SQL, in more detail. The aggregateWindow() function is a Flux function that groups data in time periods and applies a function to those groups. We often aggregate by time windows to perform downsampling tasks or to create materialized views of our data. Imagine we want to calculate the mean for 1-hour intervals for one sensor from the air sensor sample dataset.
Our Flux query would look like this:
import "experimental/iox"
iox.from(bucket: "anais-iox", measurement: "airSensors")
    |> range(start: 2022-12-01T19:05:41.000Z, stop: now())
    |> filter(fn: (r) => r.sensor_id == "TLM0100")
    |> aggregateWindow(every: 1h, fn: mean, createEmpty: false)
The functionally equivalent SQL query employs the date_bin function and looks like this:
SELECT
  DATE_BIN(INTERVAL '1' hour, time, TIMESTAMP '2022-01-01 00:00:00Z') AS time,
  avg("temperature")  as mean
FROM "airSensors"
GROUP BY 1
ORDER BY 1
The date_bin function creates time “bins” of data according to fixed periods or intervals provided as the first parameter (stride) to the function. The second parameter (source) specifies the time value which is placed into a bin. The third parameter (origin) helps determine if the bins will round up or round down relative to your source time. Here are some more examples on how to use the date_bin function. Here we group by 1 column, which is the first column of your result set as specified by the SELECT clause. In other words, group by bins to find the average across values in the same time bin.
Summary and next steps
To take advantage of querying with SQL in InfluxDB Cloud, sign up here.
If you would like to contact the InfluxDB developers behind this new data engine, join the InfluxData Community Slack and look for the #influxdb_iox channel. To learn more, please message that channel.
Does the inclusion of SQL as a query language for InfluxDB excite you? Or do you plan to continue to use Flux? I’d love to get your feedback through the community. Please reach out using our community site or Slack channel. I hope this blog post inspires you to give querying SQL in InfluxDB Cloud a try.
Finally, if you’re developing a cool IoT application on top of InfluxDB, we’d love to hear about it, so make sure to share it on social using #InfluxDB! You can reach out to me directly in our community Slack channel to share your thoughts, concerns, or questions. I’d love to get your feedback and help you with any problems you run into! Or share your story and get a free InfluxDB hoodie.
