Visualizing Time Series Data with ECharts and InfluxDB
By
Community
updated October 20, 2023
Use Cases
Product
Navigate to:
This article was originally published on The New Stack and is reposted here with permission. Scroll down for the author’s bio and photo.
How to set up a basic React app, query data from InfluxDB Cloud and use the queried data to populate results using Apache ECharts.
Every app, device or service that you use requires specific software architectures to function efficiently. One of the most important is a database layer.
The type of database chosen depends on the kind of data you’re dealing with, the latency you expect in retrieving it and the kind of operations you will perform.
A lot of data invariably has a time attribute, or in other words, it’s naturally ordered by time. This natural time order can be beneficial in optimizing performance for data that requires search and aggregation over time. Time series databases aim to capitalize on this natural time order.
InfluxDB tackles the problem of handling time series data at scale with a distinctive approach to storage engine, time series indexes, sharding techniques, fast data ingestion, and more. On top of that, InfluxDB seamlessly integrates with most programming frameworks and languages, like Python, Node.js, Scala and Go.
In this article, you’ll learn how to set up a basic React app, query data from InfluxDB Cloud and use the queried data to populate results using Apache ECharts. You’ll also learn how to set up an InfluxDB Cloud account, create storage buckets and write Flux queries.
What is InfluxDB?
As mentioned above, InfluxDB has a set of features with official client libraries for the most popular languages and frameworks. You can query your data using well-designed and mature query languages, like InfluxQL and Flux. However, the fastest way to ingest data into InfluxDB is the lightweight, text-based protocol InfluxDB Line Protocol.
InfluxDB shines when dealing with data for real-time financial systems, like stock markets and cryptocurrencies, and IoT applications used for GPS, astronomy, traffic and weather data.
Because InfluxDB is an open source database, you can deploy it yourself, or you can use InfluxDB Cloud to deploy InfluxDB on the cloud platform of your choice, such as Azure, Google Cloud or Amazon Web Services (AWS).
What is Apache ECharts?
Apache ECharts is an open source JavaScript library based on zrender. It allows you to render a wide variety of charts using progressive rendering and stream loading. You can render your charts either in Canvas or SVG formats. Apache ECharts is especially known for its low memory footprint, making it a great choice for mobile apps.
Setting up InfluxDB
Creating a free InfluxDB Cloud account is simple. You can either sign up for an account with an email and password pair, or you can use Google or Microsoft Single Sign-On (SSO):

Create a bucket
Once you’ve logged into your cloud account using the login method of your choice, you need to create a bucket with some sample data. Click on Create Bucket on the right-hand side of the console, and you’ll see the following pop-up prompting you to assign a name to the bucket:

Import sample data
This tutorial uses a dataset that captures a five-minute average memory usage for five instances over a few hours. You can find all of the data for this tutorial in this GitHub repository, or you can get the sample data and paste it into the text box that opens once you click the Enter Manually option. Alternatively, you can upload a file with data stored in the InfluxDB Line Protocol format.

Click the Write Data button after pasting the data to be uploaded using the Line Protocol method in the following window:
As mentioned previously, the dataset contains memory usage data for five instances averaged over five minutes for the duration of a few hours. The raw data will look something like the following in InfluxDB Line Protocol:

mem,host=host5 used_percent=8.22 1650881400
mem,host=host5 used_percent=1.7 1650911400
mem,host=host5 used_percent=7.36 1650941400
mem,host=host5 used_percent=6.82 1650971400
Create a new API token
Now, navigate to the API Tokens tab, and create an API token so that you can access the data from your app. Then, you’ll be prompted with the API token, as shown here:

Store the token in a config file since you won’t be able to view the token again. If you do end up losing this information, you can request a new token later on in the process.
In a production setting, you would be better off rotating the tokens every now and then. You can use a tool like Vault for that purpose.
Clone the GitHub repository
After loading the data and creating the token, you’re ready to connect with the InfluxDB Cloud database. To connect, clone the GitHub repository:
git clone https://github.com/kovid-r/influxdb-echarts-react
Before installing the Node.js application, you’ll need to change the following variables in the src/App.js file:
const token = INFLUXDB_API_TOKEN;
const org = INFLUXDB_ORGANIZATION;
const url = INFLUXDB_URL;
const bucket = INFLUXDB_BUCKET;
You can find the name of the organization for the INFLUXDB_ORGANIZATION variable and the cluster URL for the INFLUXDB_URL variable under the Name and Cluster URL sections respectively in your organization settings, as shown in the image below:
To retrieve the name of the bucket, navigate to Load Data in the left panel and click on Buckets and InfluxDB will list all the buckets in your organization:
Using ECharts with InfluxDB
The React app in the GitHub repository uses the following dependencies to enable you to work with InfluxDB and Apache ECharts together:
- ECharts for React: a npm package that interacts with the ECharts native library.
- Reactive Extensions Library for JavaScript (RxJS): enables reactive programming using observables. This makes it easier to write asynchronous or callback-based code.
- Node.js client library: for InfluxDB along with the Flux query language.
// fetches all the data in the influxdb-echarts-react bucket
    const fluxQuery = `from(bucket: "influxdb-echarts-react")|> range(start: 0)`;

    // function that uses RxJS Observables to get a stream of data from InfluxDB
    functionfetchData() {
       queryApi.queryRows(fluxQuery, {
  next: (row, tableMeta) => {
     const o = tableMeta.toObject(row);
     setChartData((v) => [...v, o]);
     },
  error: (error) => {
     window.console.error(error);
     window.console.log('\nFinished ERROR');
    },
  complete: () => { setCompleted(true);
  window.console.log('\nFinished SUCCESS');
       },
    });
    }
After cloning the repository, head over to the root directory where the package.json file resides. This file will help you with installing all the above-mentioned dependencies when you use the Node.js package manager to install your app. Using npm ci, perform a clean install and start your application using the following commands:
npm ci && npm startAfter a couple of seconds, you’ll be able to see the following message on your terminal screen:

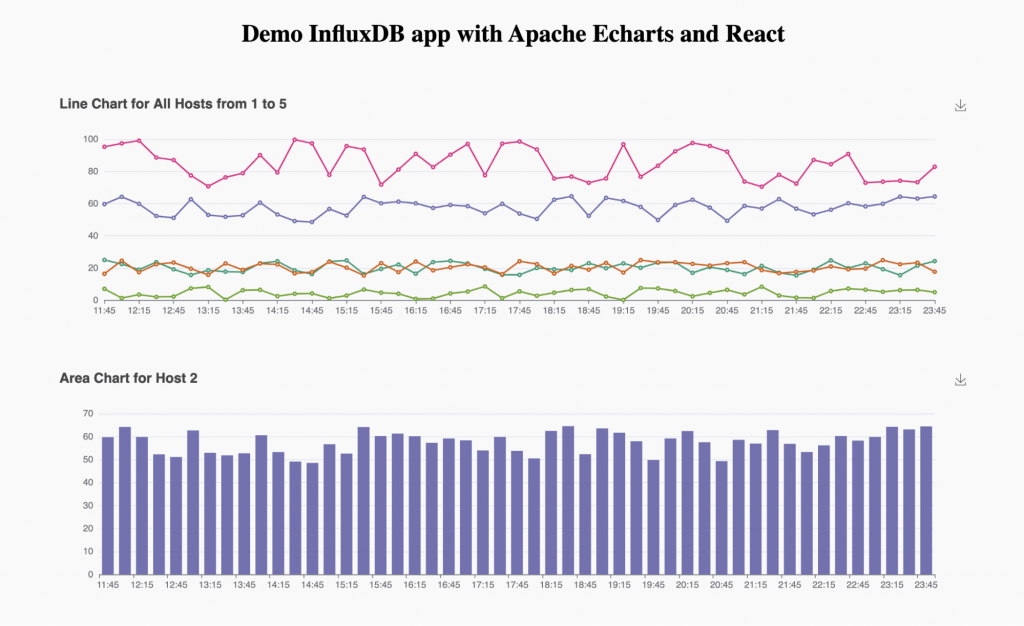
Once the installation is complete, log onto localhost:3000 to view two out-of-the-box charts that you’ll learn about in the next section. Feel free to play around with the app by loading your own sample data and changing the chart types.
Plotting the data on ECharts
In Apache ECharts, there are hundreds of charts that you can explore, but this tutorial focuses on two of those: multiline charts and bar charts. Apache ECharts also provides you with an in-browser option preview section where you can try out other things before making them a part of your app.
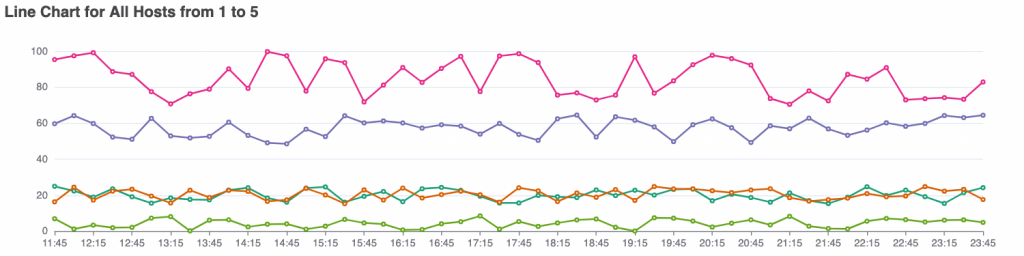
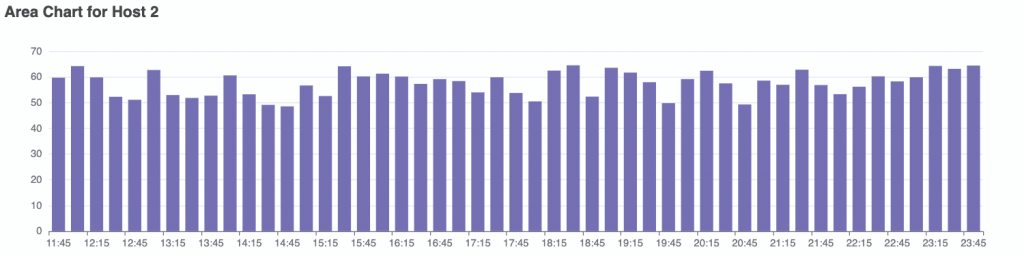
A line chart is a chart with multiple lines, each representing average memory usage at fixed intervals for one of the five instances in the sample data. A bar chart consists of data for only one instance, showing average memory usage at fixed intervals.
Multiline chart
A multiline chart plots the memory usage of all five instances simultaneously. The five different colors here have been populated using a color palette. If you don’t specify colors, Apache ECharts will color the default values for you.
Following is the function that’s responsible for generating this chart:
function Chart({ chartData })
    { return (
    <> <ReactECharts
        option = {{
            title: {
                text: 'Line Chart for All Hosts from 1 to 5'
                },
            color: colorPalette,
            tooltip: {
                trigger: 'axis'
                },
            grid: { left: '3%',
                    right: '4%',
                    bottom: '3%',
                    containLabel: true
                },
            toolbox: {
                feature: {
                    saveAsImage: {}
                    }
                },
        xAxis: { type: 'category',
                 boundaryGap: false,
                 data: arr
               }
        yAxis: {
            type: 'value'
            },
        series: [
            { name: 'Host 1',
              type: 'line',
              data: chartData.filter(function (chartData) {
                  return chartData.host === "host1"; }).map((val) => val._value)
                  },
            { name: 'Host 2',
              type: 'line',
              data: chartData.filter(function (chartData) {
                  return chartData.host === "host2"; }).map((val) => val._value)
                  },
            { name: 'Host 3',
              type: 'line',
              data: chartData.filter(function (chartData) {
                  return chartData.host === "host3"; }).map((val) => val._value)
                  },
            { name: 'Host 4',
              type: 'line',
              data: chartData.filter(function (chartData) {
                  return chartData.host === "host4"; }).map((val) => val._value)
                  },
            { name: 'Host 5',
              type: 'line',
              data: chartData.filter(function (chartData) {
                  return chartData.host === "host5"; }).map((val) => val._value)
                  }
               ]
           }}
        />
     </>
   );
}
Note that you’re using the ECharts for React library.
You can view a simplified example of a line chart on the official Apache ECharts website.
Bar chart
In this example, the bar chart plots the memory usage of one of the host machines, Host 2. As you can see in the sample data and the image below, the range of memory usage for Host 2 is between ~45 and ~65, and the chart automatically resizes to a range of 0 to 70.
The code for both the line and the bar chart goes in the same function, which has the following general structure:
<pre><code class="language-javascript">function Chart({ chartData }) {
    return (
        <>
            <ReactECharts
                // code for line chart
            />
            <ReactECharts
                // code for bar chart
            />
        </>
    );
}</code></pre>
When you make changes and update the chart types, sample data, React configuration, etc., you can log onto localhost:3000 to see your changes. Here’s what the default view of the app looks like if you deploy it as it is from the GitHub repository:
Conclusion
Often combined, search, aggregation and visualization are crucial for getting the most out of time series data.
Charting and graphing are pivotal to any time series data analysis use case. Apache ECharts provides you with a simple and efficient way to plot charts and graphs.
About the author

Kovid Rathee is a data and infrastructure engineer working as a senior consultant at Servian in Melbourne, Australia. Previously he worked as an assistant professor at an engineering college and as a full-stack developer before moving into the data space, where he has been working for the past eight years. He enjoys writing about data engineering, infrastructure-as-code, DevOps, and SRE.
