Scrapers
Why use Scrapers to collect your metrics?
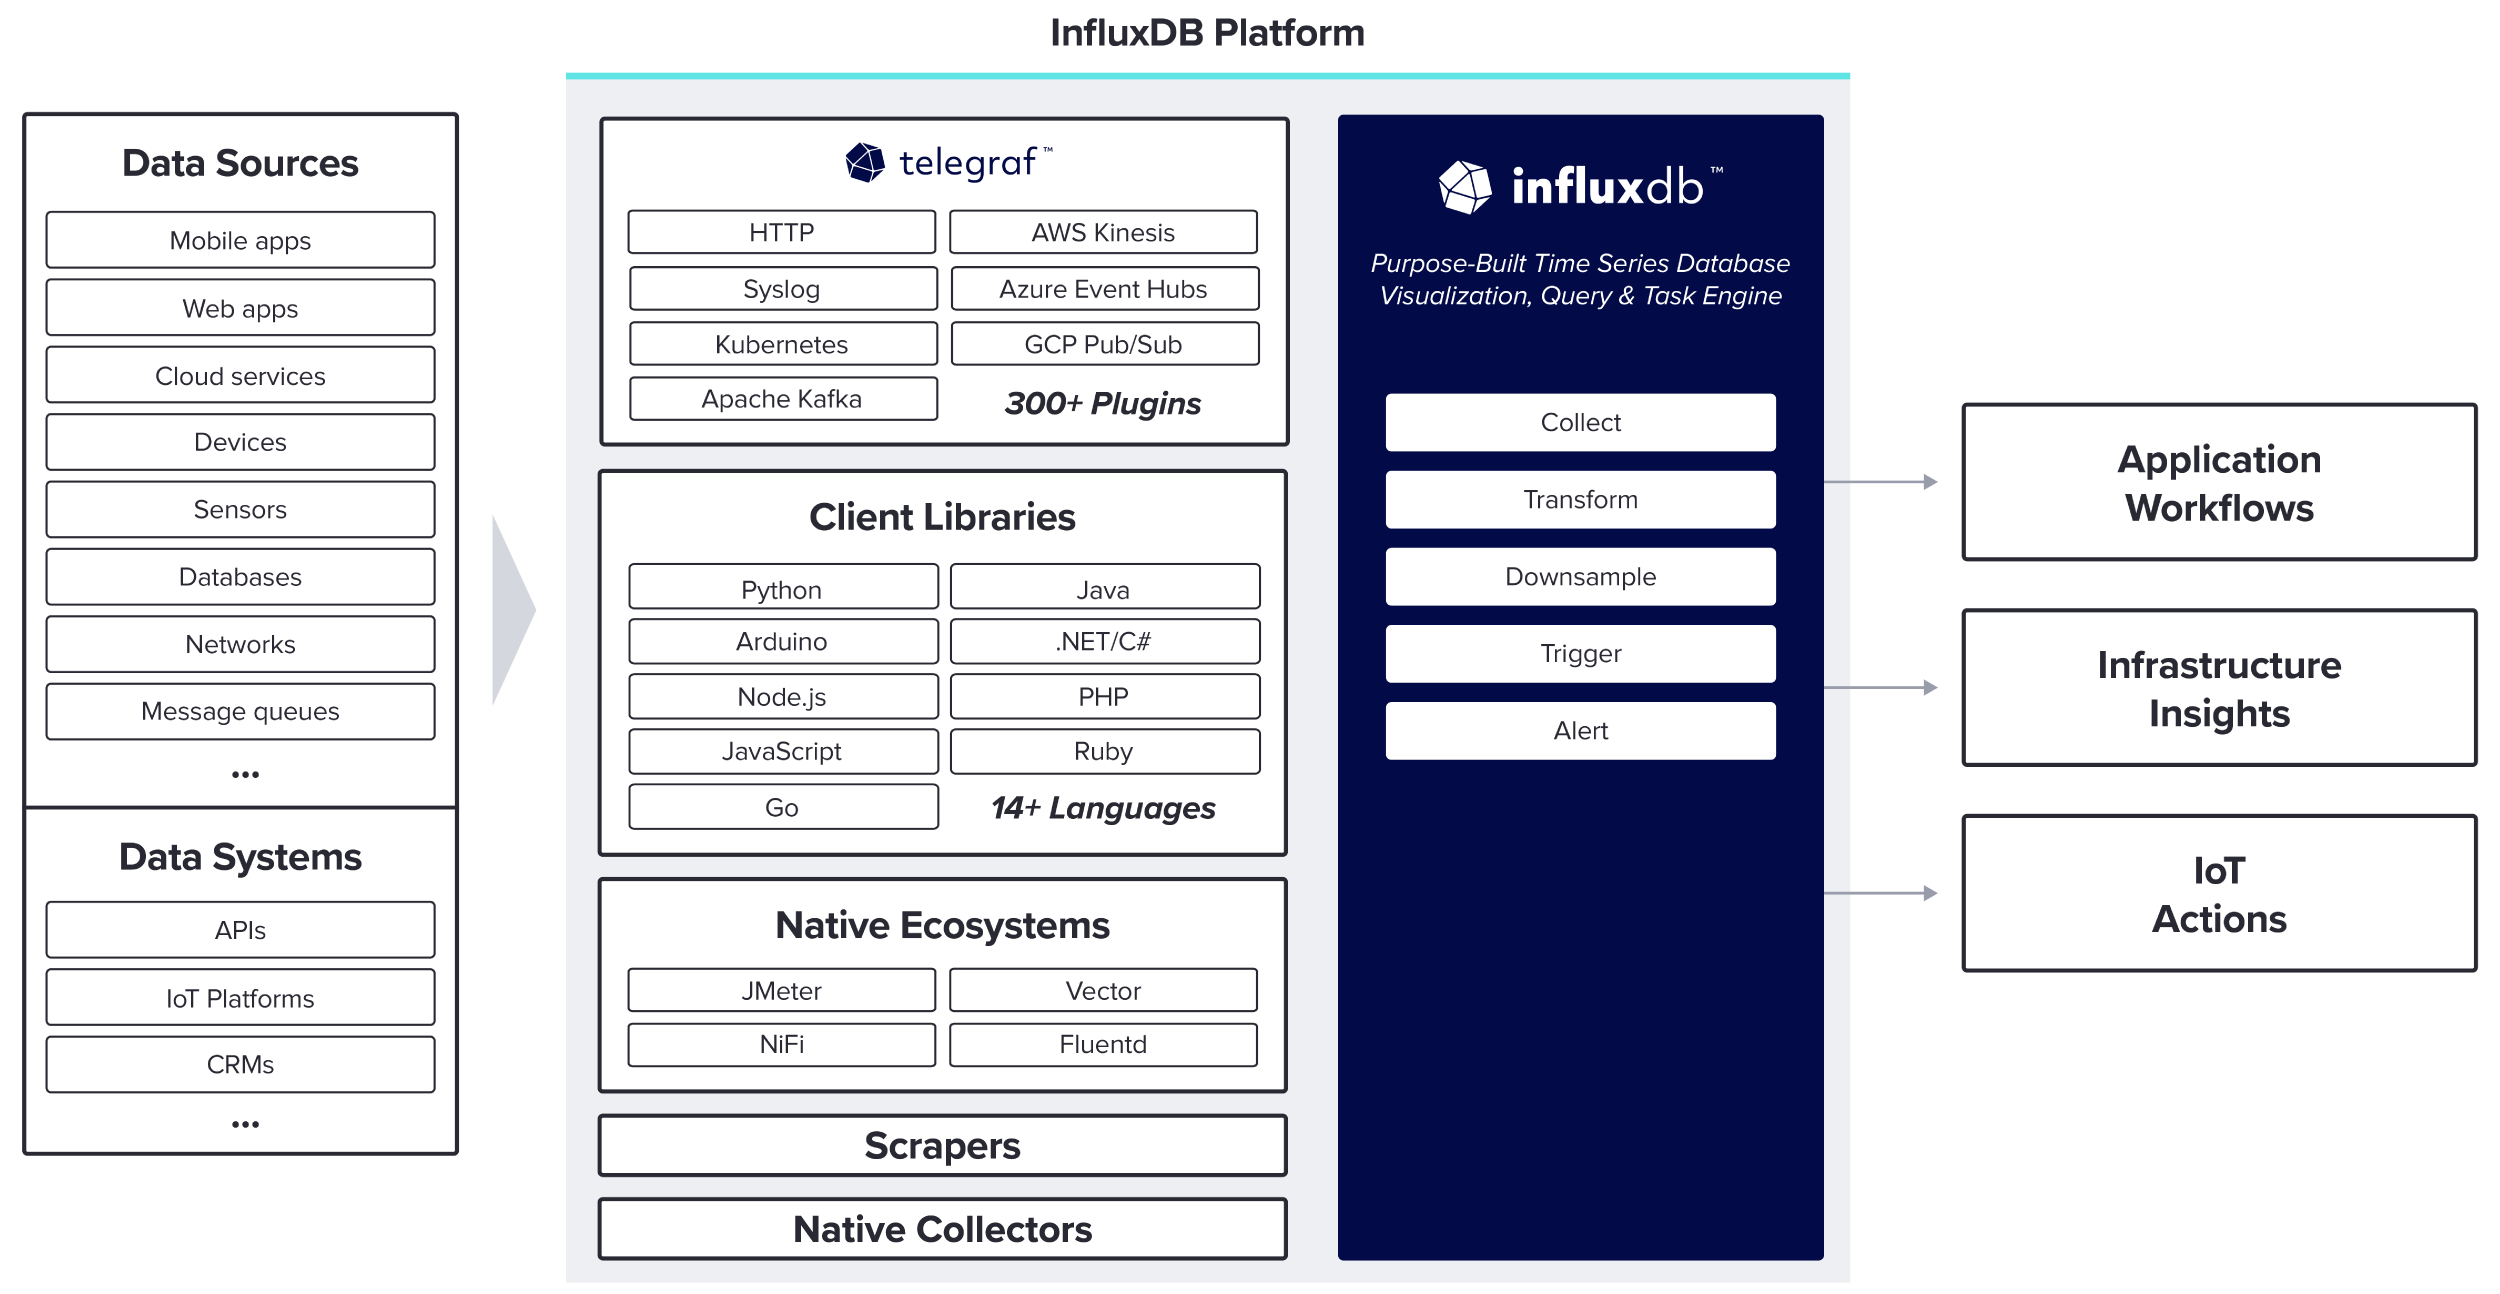
Scrapers allow you to pull metrics in the Prometheus-formatted metrics from HTTP-accessible endpoints and store them in InfluxDB. As Prometheus is commonly used to monitor cloud-native environments including Kubernetes, collecting metrics from your Kubernetes workloads with your network and application metrics gives you a comprehensive view of the performance of your entire stack.
Here are the 3 ways that you can pull Prometheus-formatted metrics into InfluxDB.

InfluxDB Scrapers
InfluxDB scraper is a data collector method that makes it easy to collect and store metrics from cloud-native endpoints. It collects data from specified targets at regular intervals, then writes the scraped data to an InfluxDB bucket. Scrapers can collect data from any HTTP(S)-accessible endpoint that provides data in the Prometheus data format.

Telegraf
Telegraf has both a Prometheus Input and Output plugin.
The Promethues Telegraf Input Plugin
The Prometheus Telegraf Input Plugin lets you collect data from HTTP servers exposing metrics in Prometheus format. You can then store your data in InfluxDB or send it to another output destination.
Learn more | Docs | GitHub
The Promethues Telegraf Output Plugin
This Telegraf Output Plugin starts a Prometheus Client and exposes metrics so that a Prometheus server can poll them. This lets you send data in Prometheus format from any source that you’ve collected with Telegraf.
Learn more | Docs | GitHub

Flux
Flux is a standalone data scripting and query language that increases productivity and code reuse. It supports multiple data sources and is extensible with many community contributions in the form of Flux functions and libraries. Flux lets you cross-compile and works with other other syntax like PromQL, InfluxQL, and others.
Among its many functions, Flux includes a prometheus.scrape function to scrape Prometheus-formatted metrics from an HTTP-accessible endpoint.

Resources
Prometheus Remote Write Support with InfluxDB 2.0
How to send Prometheus remote write metrics into InfluxDB with Telegraf.
Read BlogExpand Kubernetes Monitoring with Telegraf Operator
How to use Telegraf Operator, an environment-agnostic Prometheus alternative, to expand Kubernetes monitoring.
Read BlogKubernetes Monitoring
Real-time visibility into your entire container-based environment to unify all your metrics and events for faster root cause analysis.
Get Blueprint

