Customer Highlight: How Index Exchange is Modernizing Its DevOps Practices Using the InfluxDB Platform
By
Caitlin Croft
updated December 14, 2025
Product
Use Cases
Developer
Navigate to:
One of the best things about working at InfluxData is getting to know the worldwide InfluxDB community. It’s always fun getting to meet new users through our Community Slack, social media, team members and virtual/in-person events. I recently met David Ko, a DevOps engineer at Index Exchange. Index Exchange is a global marketplace for digital media advertising; I recently chatted with David over Zoom to discuss how they use InfluxDB at Index Exchange.
Caitlin: Tell us a little about yourself and your career at Index Exchange.
David: I’ve worked at Index Exchange for over eight years and I’m currently an Operations engineer. During my career, I’ve done a fair amount of DevOps, agile and site reliability engineering. During this time, I’ve come across various tools for a myriad of purposes. More recently, I’ve been focused on monitoring infrastructure (applications and servers) data collected here at Index Exchange.
Founded in Toronto back in 2001, Index Exchange has since grown to become one of the largest independent advertising marketplaces in the world. In essence, we’re an engineering-first company that’s aiming to democratize digital advertising so that creators, storytellers, and newsrooms are able to craft, fund, and share their content and services with the world. We do this by facilitating the display of ads online. Check out our website to learn more.
For example, when any of us go to a website, there are often banner ads on the top or on the side of a webpage. For every page load, there is a request looking for an ad to place. They might come to our platform; for every ad request, there is an automated auction, often referred to as real-time bidding. We ask our ad suppliers if they want to bid on the request. We collect any requested bids the highest bidder wins and their ad is placed on the website. Anytime there is an auction for ad bids, there’s a lot of data flowing in and out. Some of this data includes:
- Bid amount
- Winner of bid
- Name of supplier
- URL of website for ad placement
- Duration of entire ad auction/bidding process
- If there were any errors
Caitlin: How has monitoring evolved over time at Index Exchange?
David: We haven’t always had monitoring tools in place; previously, we mostly relied on email alerts. Index Exchange decided to step back and strategically rethink our approaches to monitoring. We found that we needed to look at our monitoring solutions holistically prior to making further changes. We started off by using a couple of open-source tools.
We initially implemented Zabbix and it provided us with most of what we were looking for. We were able to get metrics out of our services, network devices and servers. The team was able to set up alerts with Zabbix. With this transition, Index Exchange began to explore other technologies including Docker and Kubernetes for our microservices. Over time, it became apparent that Zabbix wasn’t cutting it; Zabbix couldn’t support the collection of metrics at the desired granularity; it wasn’t the right tool for collecting metrics from Kubernetes microservices.
We began to explore other options and we started learning more about time series databases. Once we learned the basics about TSDBs, we started to explore options available to us including: OpenTSDB, Apache Cassandra, Prometheus and InfluxDB. We ultimately chose InfluxDB, the purpose-built time series database, as it could handle longer-term storage of metrics best.
As Index Exchange’s teams started to use microservices and containers more, it became clear that Zabbix wasn’t a sufficient monitoring tool. Zabbix is designed so that every metric is tied to a physical device, but this doesn’t work with Kubernetes. When using containers, it is hard to predict which container is going to be up all the time. We started adopting Prometheus, and while we found it easy to set up and deploy, we use InfluxDB to store any metrics older than 24 hours. We set up a remote storage system from Prometheus to InfluxDB – this way, Prometheus and K8s only store up to 24 hours of container metrics. This is our methodology to support our microservices in Kubernetes.
Prior to using the TICK Stack, we were also using a MySQL database to support Zabbix’s storage needs. We realized this was overkill for our needs. It was too much for what we wanted to accomplish with Zabbix – this is around the time we found InfluxDB. We quickly grew to like it more than Zabbix as we didn’t have to deal with MySQL anymore! We love all of the Telegraf input, processor and aggregator plugins and output plugins in comparison to Zabbix’s equivalent. It wasn’t nearly as flexible or as useful as Telegraf.
"I've been working with Telegraf more recently and I'm definitely seeing the power and flexibility of the server agent. There are so many different input plugins and output plugins we can now play with without having to make our own." David Ko, DevOps Engineer, Index Exchange
Caitlin: Why did you pick InfluxData’s InfluxDB platform?
David: Someone on our team keeps current on monitoring trends and modern tools and stacks; a common popular topic they started noticing were time series databases. As they’ve become more popular in recent years, the team member took note. They started asking around to see if anyone else knew about TSDBs. Once they learned about time series databases, one of the fastest-growing database categories, they began to explore available options.
We liked that there is an open-source and enterprise version of InfluxDB meaning that there is support available if needed. We had a lot of fun during our implementation of InfluxDB! We started using InfluxDB OSS a few years ago and recently started using InfluxDB Enterprise.
Caitlin: How does Index Exchange use InfluxDB?
David: The expectation of the Index Exchange’s operations team is that we are expected to create the foundation for other engineering and product teams to adopt DevOps practices. When it comes to monitoring with InfluxDB, our team sets up an InfluxDB cluster used to store real-time data. We also have used Kapacitor to set up alerts about the data store in the InfluxDB cluster.
We have developed documentation, guides and training videos to help the team understand the InfluxDB platform. We also have an open Slack channel for any questions, feedback, etc. We’re there to help teams as they’re understanding the tool and helping improve the tools available to them. Teams can ping us to get help on setting up alerts and automating metric collection we’re there to help! Our team of about 30 supports the entire engineering team; the operations team is primarily in Toronto, Canada and engineering is in Toronto, Montreal and Kitchener-Waterloo. We also have non-engineering team members in Boston, San Francisco, London, Paris, Sydney and elsewhere.
The product and engineering teams’ requirements influence our projects. However, recently, we’ve started to work with team members who are on the commercial side of the business. We want to understand how their analysts are using data and to understand their needs and requirements better. Our analysts are sometimes interested in understanding CPU usage or specific servers within the same datacenter on the same rack. It is possible that the analysis team will need to understand historical data going back months or years. A lot of this data currently resides in InfluxDB; we have Telegraf agents collecting metrics including CPU memory. Telegraf is collecting basic server metrics including CPU, disk and other data. We are using Python scripts to write our data into InfluxDB.
We’re still using Prometheus; we haven’t yet phased it completely. It’s going to take some time. We want to use the TICK Stack for everything eventually. We’re getting pretty familiar with TICKscripts. Soon we will start learning Flux and plan on upgrading to InfluxDB 2.0. It’ll be more useful than relying on Prometheus.
In addition to collecting metrics on every ad bid/auction, we’re also interested in knowing the status of their infrastructure. Sometimes it’s basics like whether or not the component is alive and working. It’s also important for Index Exchange to understand specifics like “how long did it take to complete this task”. Another common inquiry is: How many times did a specified error occur from a particular data center in the last 10 minutes. We like to understand the number of errors and the type of errors occurring. By being able to quantify the number of errors from a given data center within the last 10 minutes, it helps our team understand and address these issues. By using InfluxDB’s data structure, every data center is a tag. The error type is also a tag. InfluxDB is ingesting about 60,000 metrics per second!
Index Exchange’s data centers are bare-metal environments; we basically have our own private cloud solution. We’re proud of our in-house infrastructure solution. It provides us with the desired autonomy, which is especially important for data security. We keep a record of every ad transaction made, not just data on the ad bids that are won there’s data on every bid placed, resulting in terabytes of data being used and processed. There’s easily terabytes, if not petabytes of data being used and processed. I’m paraphrasing, but a few years ago there was a presentation about the amount of ad traffic data that has been processed in one year being more than the number of stars in the Milky Way.
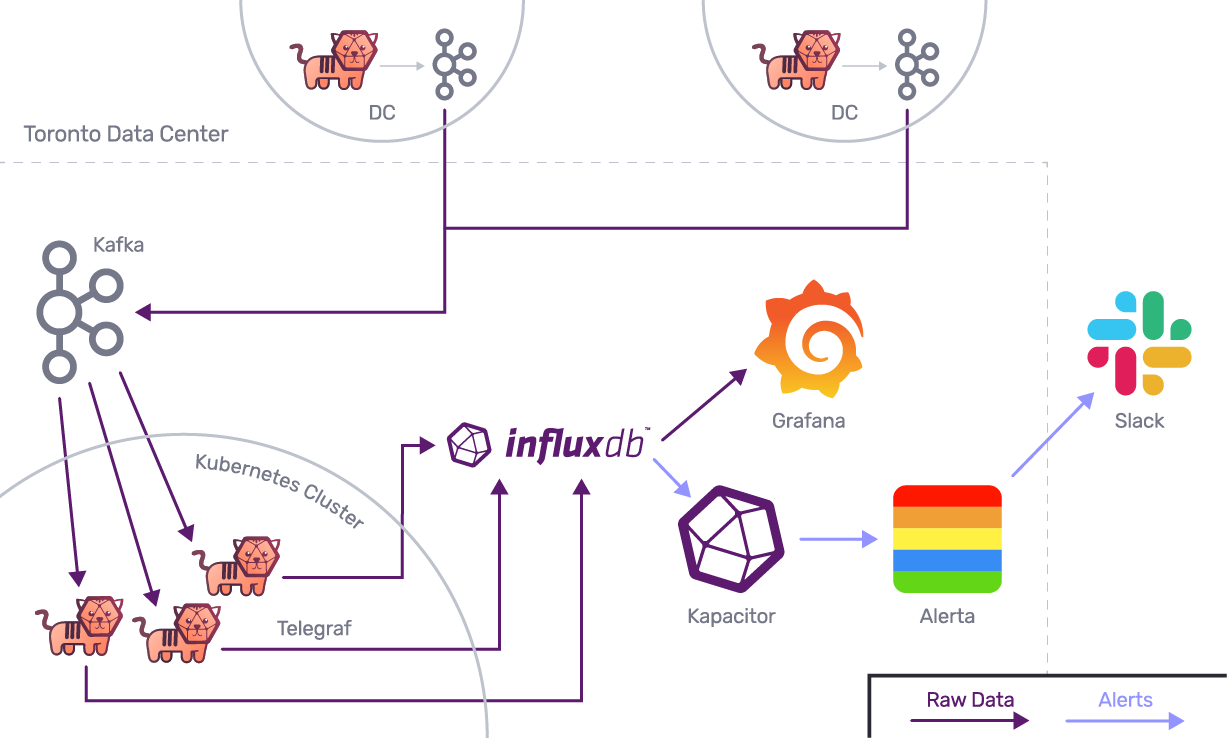
- This architecture diagram only represents two of our remote data centers.
- Index Exchange has a total of eight data centers spread across the world.
- The data flow is the same for all of them.
Caitlin: Tell us about data visualization and alerting at Index Exchange.
David: We are still determining the best visualization method for our data. We are using Chronograf in limited capacity and Grafana. As we’re using a lot of TICKscripts, it’s great to explore our data with Chronograf. It’s pretty cool using Chronograf to visualize and analyze the data already stored in InfluxDB. We also have a lot of graphs in Grafana that the team utilizes. So for now, a combination of Chronograf and Grafana works for us.
We are currently using Kapacitor for alerting and data computations. As we learned more about TICKscripts, we started to explore some of the more complex tasks that you wouldn’t want to do with continuous queries. We’re still in the early stages of determining our best practices, but we want to make sure we aren’t just doing things the old-fashioned DevOps way!
We are also using Slack and Alerta. All of our TICKscripts are passed to Alerta and then onto Slack, because we want a birds-eye view of all ongoing alerts at various levels from various sources.
It’s been great to provide the team with visualizations of the data we currently have to understand where we’re at and to understand how to better optimize our operations. These graphs also shed light on gaps in our data and pain points that we can address.
Caitlin: What’s next for Index Exchange’s DevOps Team?
David: We want to explore new technologies and methodologies; for example we’re learning more about Google Site Reliability Engineering’s practices. One of their techniques is to create Service Level Indicators (SLI) and Service Level Objectives (SLO) we’re hoping to incorporate these methodologies into our InfluxDB practices. SLIs simply notify a team about how their service is doing. SLIs are usually a ratio between good events and total events. By dividing the number of requests without errors by the total number of requests, an organization can determine their SLI. SLO is the threshold you want that percentage to stay within. Index Exchange calculates these SLIs and stores them in InfluxDB. We’ve created a SLO by setting up alerts using TICKscripts.
As time goes on, we hope to finesse our alerting. Right now we only have basic alerting set up on metrics like CPU usage. If the moving average of the CPU usage of a specific group of data centers is above a certain threshold, we are notified. This kind of alert means there’s going to be an impact on revenue as our ad servers aren’t able to process the auction efficiently enough. In the future, we’d like to have more advanced alerting. For example, on average, ad auctions take about 100 milliseconds so if we notice them timing out at 150 milliseconds, we’d like to be able to proactively fix the root cause of the delay.
We are interested in learning more about InfluxDB 2.0 and are looking into upgrading. It was great attending InfluxDays North America 2020 as I got to learn about new concepts, including InfluxDB IOx. It sounds very interesting as a new backend for InfluxDB 2.0! We have run into high cardinality issues already, so I’m interested to see how InfluxData responds to the common issue of very high cardinality. I’m definitely excited to see what the future of InfluxDB is and how we can implement the latest InfluxDB version at Index Exchange!
Caitlin: Are there any InfluxDB tips and tricks you’d like to share?
David: We recently had a cascading failure in our InfluxDB cluster because our replication factor was set to three for all other databases, but our node size is actually four. When we started throwing more data into InfluxDB, it was fine. However, we eventually pushed enough data to the cluster to cause the cascading failure. We weren’t familiar enough with InfluxDB to understand what had happened. We engaged with InfluxData’s support team and quickly learned that replication factors in fact matter more than we realized and that the suggested replication factor number is optimized for a reason. ???? If you’re configuring an InfluxDB cluster for the first time, I definitely recommend leveraging InfluxData’s support team as much as possible! Yes, there’s tons in the documentation, but there’s going to be some information that isn’t clear and assumptions are going to be made incorrectly. It’s best to have InfluxData’s support engineers help walk you through it initially.
I also suggest reading through InfluxData’s documentation to understand their recommendations and to consider what’s best for you and your organization. When you’re doing capacity planning, designing your data schema, you should consider InfluxDB best practices, while considering what works best for your organization and your requirements.
Caitlin: How has InfluxDB influenced your career?
David: During the implementation, I learned more and more about DevOps practices, especially when it came to monitoring and understanding infrastructure metrics. While I had known the concept of time-stamped data for a while, nothing like rolling out InfluxDB to make me really comfortable and familiar with them!
If you’re interested in sharing your InfluxDB story, click here.
