Getting Started with Apache Kafka and InfluxDB
By
Community
updated October 24, 2023
Developer
Product
Getting Started
Navigate to:
This article was written by Aykut Bulgu. Scroll down to view his bio and picture.
The number of applications and services increases every day as more application architectures move towards microservices or serverless structures. You can process this increasing amount of time series data with real-time aggregation or with a calculation whose output is a measurement or a metric. These metrics need to be monitored so that you can solve issues and make relevant changes in your system quickly.
A change in a system can be captured and observed in many ways. The most popular one, especially in a cloud-native environment, is to use events.
Event-driven systems became the standard for creating loosely coupled distributed systems. You can gather your application metrics, measurements, or logs in an event-driven way, such as event sourcing, change data capture (CDC), etc. and send them to a messaging backbone to be consumed by another resource, like a database or an observability tool. In this case, durability and performance are important, and traditional message brokers don’t typically offer these features.
Apache Kafka, on the contrary, is a durable, high-performance messaging system, which is also considered a distributed stream processing platform. Apache Kafka can be applied to many use cases, including messaging, data integration, log aggregation, and metrics.
When it comes to metrics, having a message backbone or a broker isn’t enough. While Apache Kafka is durable, it’s not designed to run queries for metrics and monitoring. This is where InfluxDB comes in.
InfluxDB is a time series database (TSDB) that provides storage and time series data retrieval for monitoring, application metrics, Internet of Things (IoT) sensor data, and real-time analytics. It can be integrated with Apache Kafka to send or receive metrics or event data for both processing and monitoring.
In this tutorial, you will learn about Apache Kafka and InfluxDB. You will also see how they can be used together to create tasks and alerts as well as query data via clients.
Prerequisites
To complete this tutorial, you’ll need the following:
- A macOS environment with Homebrew installed.
- A recent version of Docker. (At the time of writing this article, Docker Desktop 4.6.1. was used.)
- A recent version of Docker Compose (version 2.3.3 was used here).
- Python 3.8 or higher.
To follow along, you can use this GitHub repository.
Background information: IoT SaaS
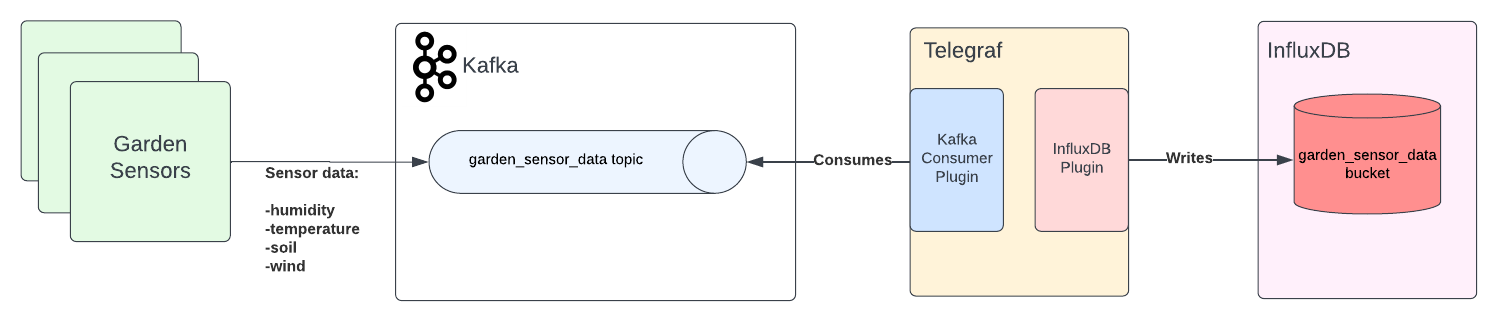
In this article, you’ll be looking at a fictional IoT software company called InfluxGarden that provides services to gardening companies. Recently, they required a software development expert to integrate Apache Kafka with their InfluxDB system, which they plan to serve as a software-as-a-service (SaaS) platform.
InfluxGarden has sensors that measure things like humidity, temperature, soil, and wind. In this article, you’ll gather the data from a simulation application and then send the data to Apache Kafka to be read by InfluxDB and shown on its data explorer interface.
The overall application architecture will look like this:
What is Apache Kafka?
As stated previously, Apache Kafka is an open source distributed stream processing platform that was created as a high-performance messaging system and has been used by more than 80 percent of all Fortune 100 companies.
Apache Kafka is known for its high throughput and low latency. It can be used in many ways, including the following:
-
Messaging: Apache Kafka replaces many (especially Java-based) traditional messaging systems, including ActiveMQ and RabbitMQ.
-
Stream processing: It provides an event backbone by storing real-time events for aggregating, enriching, and processing.
-
Metrics: Apache Kafka becomes the centralized aggregation point of many distributed components or applications, like microservices. These applications can send real-time metrics to be consumed by other platforms, including InfluxDB.
-
Data integration: Data and event changes can be captured and sent to Apache Kafka, where they are consumed by any application that needs to act upon these changes.
-
Log aggregation: Apache Kafka can act as the messaging backbone of a log streaming platform that transforms log chunks into streams of data.
When installed, Apache Kafka forms a cluster that consists of brokers and Zookeeper instances. Zookeeper is a third-party open source platform that was developed separately from the Apache Kafka project. It’s a dependency that Apache Kafka uses for tasks like selecting a controller broker.
The Kafka community has been working on getting rid of this dependency and has a Zookeeper-less mode in its most recent versions (which, currently, are not production-ready).
For more information about this, please refer to the Apache Kafka Improvement Proposal (KIP-500).
A broker usually refers to an Apache Kafka server instance that is a part of the Kafka cluster. For horizontal scalability and availability, brokers must run on different machines, and one of the brokers becomes the controller. For more information about the structure of Apache Kafka, please refer to the official Apache Kafka documentation.
Apache Kafka has topics, which are the logical storage units, like the tables of a relational database. Topics are distributed through the brokers via partitions, providing scalability and resilience.
When a client sends data to an Apache Kafka cluster instance, it must send it toward a topic.
In addition, when a client reads data from an Apache Kafka cluster, it must read it from a topic. A client that sends data to Apache Kafka becomes the producer, while a client that reads data from a Kafka cluster becomes the consumer.
Unlike traditional messaging platforms, in Apache Kafka, the brokers are dumb, but the producers and consumers are smart. This means the brokers are only configured to keep the data within a specific time of retention; other than that, all the complex configuration is done on the clients (producers and consumers):
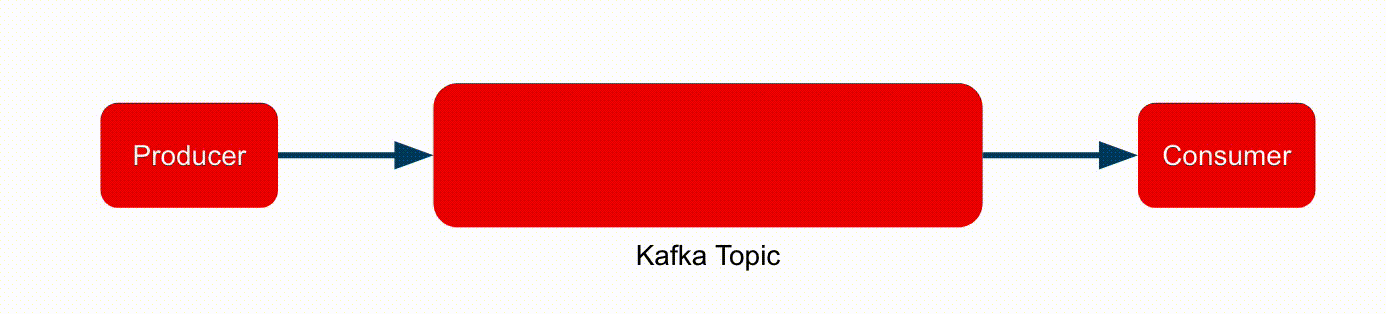
When you consume a message from an Apache Kafka topic, the message isn’t deleted. You can re-consume any message as long as it is stored in the brokers, depending on the retention configuration. This is the replay mechanism of Apache Kafka and is very important for many use cases, including event-driven architectures.
What is InfluxDB?
A TSDB is a database that is optimized for time series data, which are metrics or events that are tracked, monitored, and aggregated over a period of time. These metrics and events are kept in a TSDB with a time stamp.
InfluxDB was created specifically for time series data in monitoring, application metrics, IoT, sensor data, and real-time analytics. It can be integrated with third-party data stores, like MongoDB, Elasticsearch, APIs, services, and message queues, in order to send and receive metrics data.
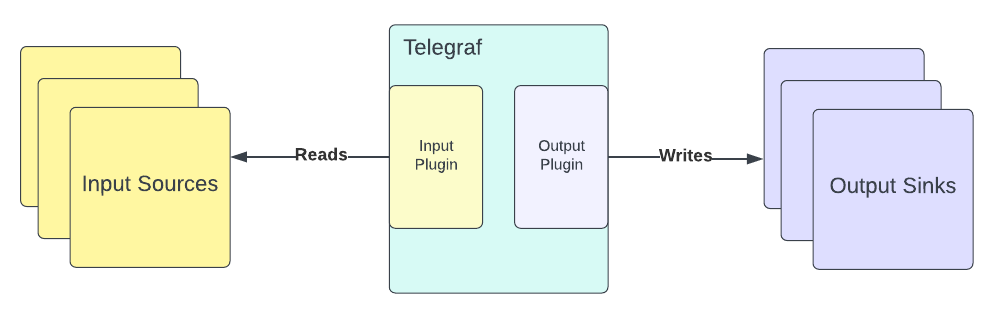
InfluxDB provides a plug-in-driven server agent called Telegraf that collects and reports metrics from any supported sources and feeds InfluxDB with that data or vice versa:
Telegraf can be started as a sysvinit or systemd service on Linux, or you can run it as a terminal command.
Telegraf has input and output plug-ins that must be configured upfront before starting it. For example, it has an Apache Kafka consumer input plug-in that makes it possible to read messages from a Kafka topic and an output plug-in that helps write any input data to InfluxDB. Here, you’ll use these plug-ins for Telegraf.
Running Apache Kafka
In this tutorial, you’ll run Apache Kafka in a container. To begin, download the Docker compose YAML file that has configurations for both Apache Kafka and its dependency, Zookeeper. The compose file uses container images that are based on Strimzi.
The file content should look like this:
version: '3.3'

services:

  zookeeper:
    container_name: zookeeper
    image: quay.io/strimzi/kafka:0.28.0-kafka-3.1.0
    command: [
        "sh", "-c",
        "bin/zookeeper-server-start.sh config/zookeeper.properties"
      ]
    ports:
    - "2181:2181"
    environment:
      LOG_DIR: /tmp/logs

  kafka:
    container_name: kafka
    image: quay.io/strimzi/kafka:0.28.0-kafka-3.1.0
    command: [
      "sh", "-c",
      "bin/kafka-server-start.sh config/server.properties --override listeners=$${KAFKA_LISTENERS} --override advertised.listeners=$${KAFKA_ADVERTISED_LISTENERS} --override zookeeper.connect=$${KAFKA_ZOOKEEPER_CONNECT}"
    ]
    depends_on:
    - zookeeper
    ports:
    - "9092:9092"
    environment:
      LOG_DIR: "/tmp/logs"
      KAFKA_ADVERTISED_LISTENERS: PLAINTEXT://localhost:9092
      KAFKA_LISTENERS: PLAINTEXT://0.0.0.0:9092
      KAFKA_ZOOKEEPER_CONNECT: zookeeper:2181

  influxdb:
      container_name: influxdb
      ports:
          - '8086:8086'
      image: 'docker.io/influxdb:2.2.0'
In your home directory, create a folder called influxgarden_integration and place the file in it with the name docker-compose.yaml.
Then open a terminal window and run the following command to execute Apache Kafka on your machine:
docker-compose -f '_YOUR_HOME_DIRECTORY_/influxgarden_integration/docker-compose.yaml' upThe output should be as follows:
['podman', '--version', '']
using podman version: 4.1.0
** excluding:  set()
['podman', 'network', 'exists', 'kafka_default']
podman create --name=zookeeper --label io.podman.compose.config-hash=123 --label io.podman.compose.project=kafka --label io.podman.compose.version=0.0.1 --label com.docker.compose.project=kafka --label com.docker.compose.project.working_dir=/Users/mabulgu/github-repos/systemcraftsman/influxdb-kafka-demo/resources/kafka --label com.docker.compose.project.config_files=/Users/mabulgu/github-repos/systemcraftsman/influxdb-kafka-demo/resources/kafka/docker-compose.yaml --label com.docker.compose.container-number=1 --label com.docker.compose.service=zookeeper -e LOG_DIR=/tmp/logs --net kafka_default --network-alias zookeeper -p 2181:2181 quay.io/strimzi/kafka:0.28.0-kafka-3.1.0 sh -c bin/zookeeper-server-start.sh config/zookeeper.properties
9f3a20f17ab9c4ec2214649f3d92a70fd60790f7cc31d0b2493db83db78809aa
exit code: 0
['podman', 'network', 'exists', 'kafka_default']
podman create --name=kafka --label io.podman.compose.config-hash=123 --label io.podman.compose.project=kafka --label io.podman.compose.version=0.0.1 --label com.docker.compose.project=kafka --label com.docker.compose.project.working_dir=/Users/mabulgu/github-repos/systemcraftsman/influxdb-kafka-demo/resources/kafka --label com.docker.compose.project.config_files=/Users/mabulgu/github-repos/systemcraftsman/influxdb-kafka-demo/resources/kafka/docker-compose.yaml --label com.docker.compose.container-number=1 --label com.docker.compose.service=kafka -e LOG_DIR=/tmp/logs -e KAFKA_ADVERTISED_LISTENERS=PLAINTEXT://localhost:9092 -e KAFKA_LISTENERS=PLAINTEXT://0.0.0.0:9092 -e KAFKA_ZOOKEEPER_CONNECT=zookeeper:2181 --net kafka_default --network-alias kafka -p 9092:9092 quay.io/strimzi/kafka:0.28.0-kafka-3.1.0 sh -c bin/kafka-server-start.sh config/server.properties --override listeners=${KAFKA_LISTENERS} --override advertised.listeners=${KAFKA_ADVERTISED_LISTENERS} --override zookeeper.connect=${KAFKA_ZOOKEEPER_CONNECT}
d3a8b43e84b810d757da603301216a84c5f7a22c0ff09183f7d3a78bf347b4ea
exit code: 0
podman start -a zookeeper
podman start -a kafka
...output omitted...
[2022-05-22 13:56:20,717] INFO [KafkaServer id=0] started (kafka.server.KafkaServer)
[2022-05-22 13:56:20,792] INFO [BrokerToControllerChannelManager broker=0 name=alterIsr]: Recorded new controller, from now on will use broker localhost:9092 (id: 0 rack: null) (kafka.server.BrokerToControllerRequestThread)
[2022-05-22 13:56:20,841] INFO [BrokerToControllerChannelManager broker=0 name=forwarding]: Recorded new controller, from now on will use broker localhost:9092 (id: 0 rack: null) (kafka.server.BrokerToControllerRequestThread)
Now you need to open a new terminal window and run the following command to verify that the Apache Kafka and Zookeeper instances are running:
docker ps9f3a20f17ab9 quay.io/strimzi/kafka:0.28.0-kafka-3.1.0 sh -c bin/zookeep... 3 minutes ago Up 3 minutes ago 0.0.0.0:2181->2181/tcp zookeeper
d3a8b43e84b8 quay.io/strimzi/kafka:0.28.0-kafka-3.1.0 sh -c bin/kafka-s... 3 minutes ago Up 3 minutes ago 0.0.0.0:9092->9092/tcp kafkaThe preceding output shows that the Apache Kafka cluster works without any problem.
Running InfluxDB
In this tutorial, you will also run InfluxDB in a container via Docker.
For more information on installing InfluxDB on other platforms, refer to this documentation.
Once you have Docker installed and started on the Docker daemon in your macOS environment, you need to open a new terminal window and run the following command to start InfluxDB:
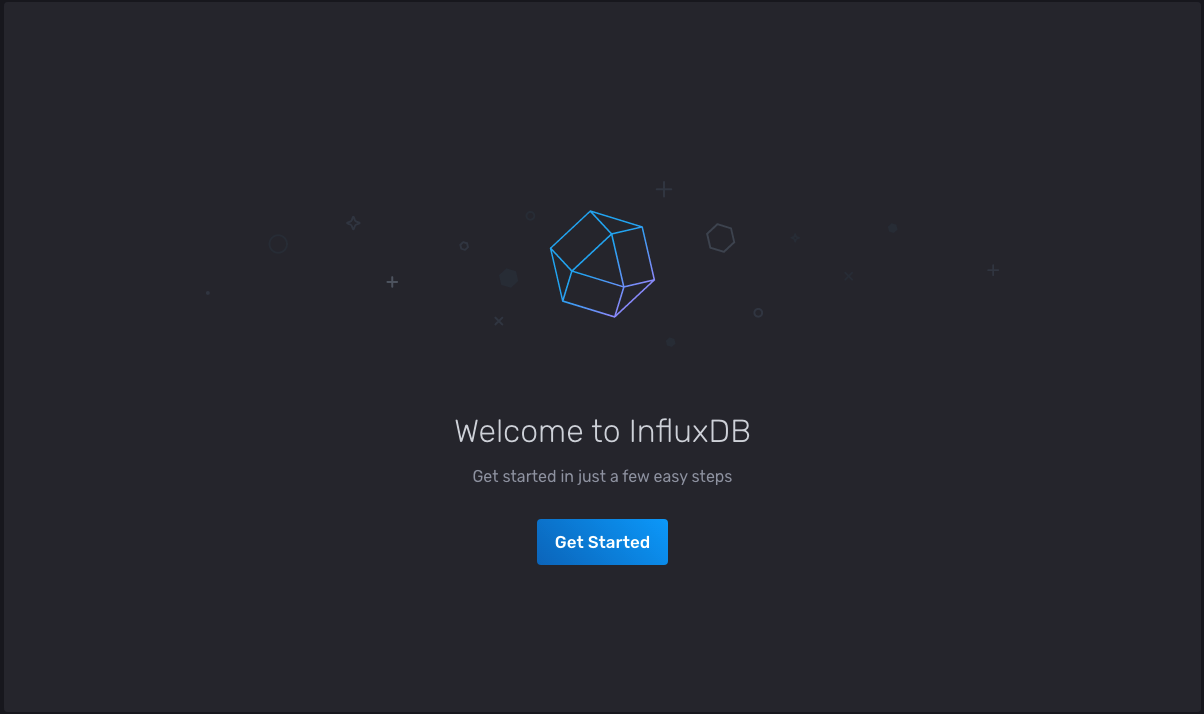
docker run -d --name influxdb -p 8086:8086 docker.io/influxdb:2.2.0In your web browser, navigate to the localhost:8086 to verify the installation:
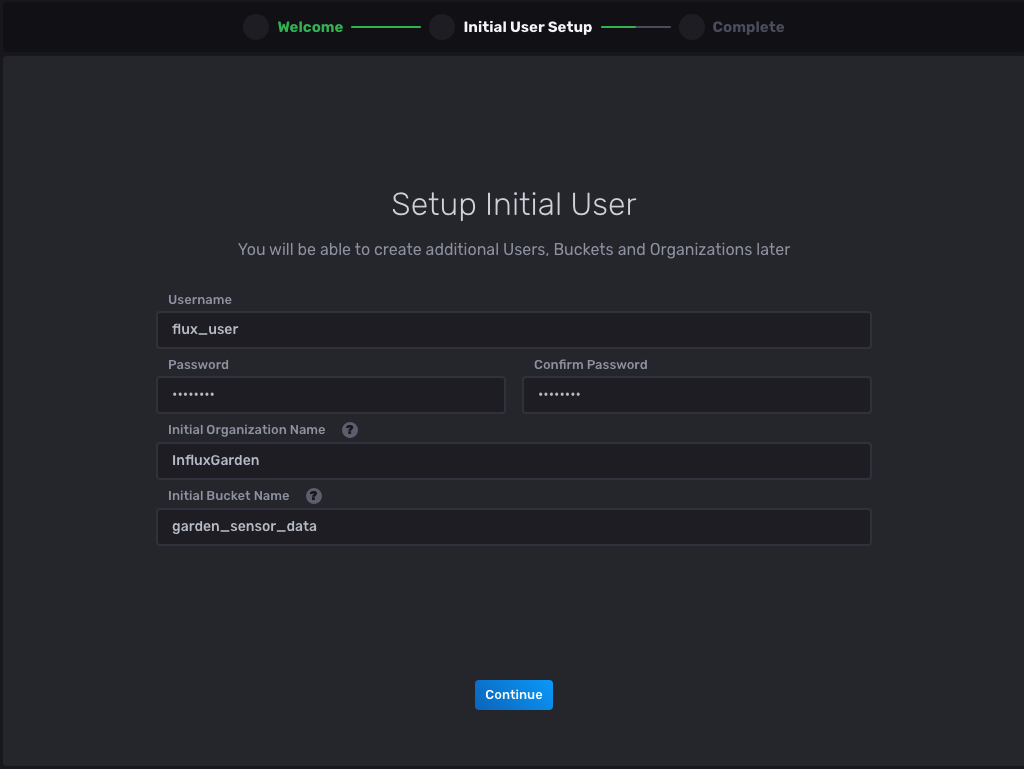
Select the Get Started button and enter the information as prompted:
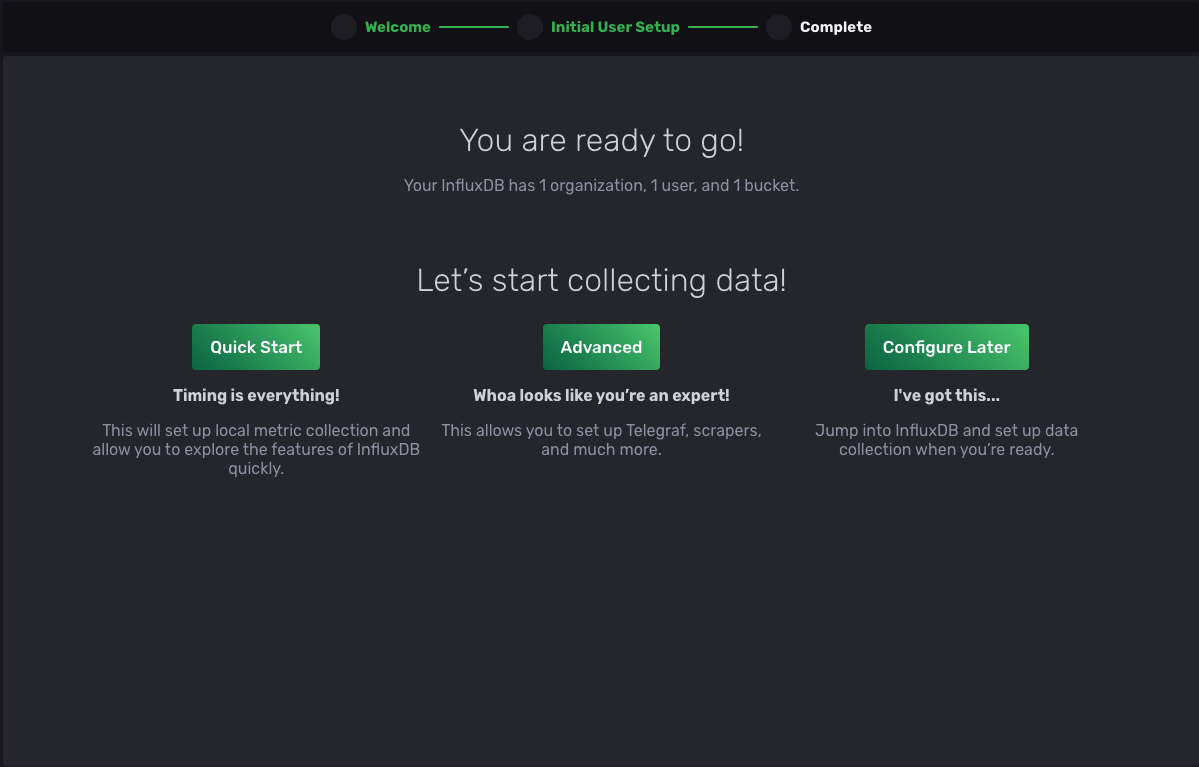
Now select Continue, and you should be redirected to the next page to complete the setup:
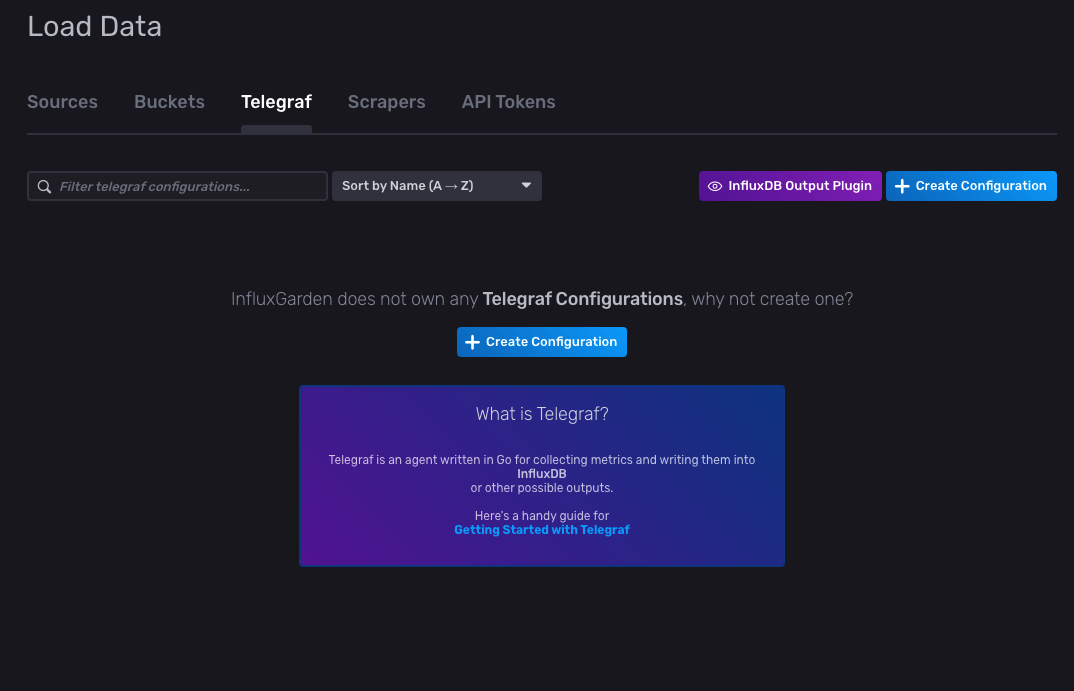
Once completed, select Advanced, and you’ll be redirected to the Load Data page with the Buckets tab selected. Please note that the bucket garden_sensor_data is available in the list, and keep the page open as you’ll need it later on in this tutorial.
Installing, configuring, and running Telegraf
To install Telegraf on macOS, open a new terminal window and run the following command:
brew install telegrafAs stated in the prerequisites, you’ll need Homebrew installed for this step. For other installation options on other platforms, you can refer to this documentation.
After installing Telegraf, you need to configure it in order to integrate InfluxDB and Apache Kafka.
Navigate back to the InfluxDB Load Data page you had previously navigated to and click Telegraf > InfluxDB Output Plugin:
After selecting InfluxDB Output Plugin, a configuration pop-up should open, showing you the output configuration:
[[outputs.influxdb_v2]]
  ## The URLs of the InfluxDB cluster nodes.
  ##
  ## Multiple URLs can be specified for a single cluster, only ONE of the
  ## urls will be written to each interval.
  ##   ex: urls = ["https://us-west-2-1.aws.cloud2.influxdata.com"]
  urls = ["http://localhost:8086"]

  ## API token for authentication.
  token = "$INFLUX_TOKEN"

  ## Organization is the name of the organization you wish to write to; must exist.
  organization = "InfluxGarden"

  ## Destination bucket to write into.
  bucket = "garden_sensor_data"

  ## The value of this tag will be used to determine the bucket.  If this
  ## tag is not set the 'bucket' option is used as the default.
  # bucket_tag = ""

  ## If true, the bucket tag will not be added to the metric.
  # exclude_bucket_tag = false

  ## Timeout for HTTP messages.
  # timeout = "5s"

  ## Additional HTTP headers
  # http_headers = {"X-Special-Header" = "Special-Value"}

  ## HTTP Proxy override, if unset values the standard proxy environment
  ## variables are consulted to determine which proxy, if any, should be used.
  # http_proxy = "http://corporate.proxy:3128"

  ## HTTP User-Agent
  # user_agent = "telegraf"

  ## Content-Encoding for write request body, can be set to "gzip" to
  ## compress body or "identity" to apply no encoding.
  # content_encoding = "gzip"

  ## Enable or disable uint support for writing uints influxdb 2.0.
  # influx_uint_support = false

  ## Optional TLS Config for use on HTTP connections.
  # tls_ca = "/etc/telegraf/ca.pem"
  # tls_cert = "/etc/telegraf/cert.pem"
  # tls_key = "/etc/telegraf/key.pem"
  ## Use TLS but skip chain & host verification
  # insecure_skip_verify = false
Notice that the organization and bucket names are already set in the configuration.
Create a file called telegraf.conf in the influxgarden_integration directory and copy the preceding configuration into it. By adding the outputs notation in the configuration file, you are integrating Telegraf with InfluxDB.
To get the data from a source and send it to the InfluxDB via Telegraf, you also need to add an input configuration in the same configuration file.
Append the following input configuration to the telegraf.conf file you’ve created:
[[inputs.kafka_consumer]]
  ## Kafka brokers.
  brokers = ["localhost:9092"]

  ## Topics to consume.
  topics = ["garden_sensor_data"]

  ## When set this tag will be added to all metrics with the topic as the value.
  # topic_tag = ""

  ## Optional Client id
  # client_id = "Telegraf"

  ## Set the minimal supported Kafka version.  Setting this enables the use of new
  ## Kafka features and APIs.  Must be 0.10.2.0 or greater.
  ##   ex: version = "1.1.0"
  # version = ""

  ## Optional TLS Config
  # tls_ca = "/etc/telegraf/ca.pem"
  # tls_cert = "/etc/telegraf/cert.pem"
  # tls_key = "/etc/telegraf/key.pem"
  ## Use TLS but skip chain & host verification
  # insecure_skip_verify = false

  ## SASL authentication credentials.  These settings should typically be used
  ## with TLS encryption enabled
  # sasl_username = "kafka"
  # sasl_password = "secret"

  ## Optional SASL:
  ## one of: OAUTHBEARER, PLAIN, SCRAM-SHA-256, SCRAM-SHA-512, GSSAPI
  ## (defaults to PLAIN)
  # sasl_mechanism = ""

  ## used if sasl_mechanism is GSSAPI (experimental)
  # sasl_gssapi_service_name = ""
  # ## One of: KRB5_USER_AUTH and KRB5_KEYTAB_AUTH
  # sasl_gssapi_auth_type = "KRB5_USER_AUTH"
  # sasl_gssapi_kerberos_config_path = "/"
  # sasl_gssapi_realm = "realm"
  # sasl_gssapi_key_tab_path = ""
  # sasl_gssapi_disable_pafxfast = false

  ## used if sasl_mechanism is OAUTHBEARER (experimental)
  # sasl_access_token = ""

  ## SASL protocol version.  When connecting to Azure EventHub set to 0.
  # sasl_version = 1

  ## Name of the consumer group.
  # consumer_group = "telegraf_metrics_consumers"

  ## Compression codec represents the various compression codecs recognized by
  ## Kafka in messages.
  ##  0 : None
  ##  1 : Gzip
  ##  2 : Snappy
  ##  3 : LZ4
  ##  4 : ZSTD
  # compression_codec = 0
  ## Initial offset position; one of "oldest" or "newest".
  # offset = "oldest"

  ## Consumer group partition assignment strategy; one of "range", "roundrobin" or "sticky".
  # balance_strategy = "range"

  ## Maximum length of a message to consume, in bytes (default 0/unlimited);
  ## larger messages are dropped
  max_message_len = 1000000

  ## Maximum messages to read from the broker that have not been written by an
  ## output.  For best throughput set based on the number of metrics within
  ## each message and the size of the output's metric_batch_size.
  ##
  ## For example, if each message from the queue contains 10 metrics and the
  ## output metric_batch_size is 1000, setting this to 100 will ensure that a
  ## full batch is collected and the write is triggered immediately without
  ## waiting until the next flush_interval.
  # max_undelivered_messages = 1000

  ## Data format to consume.
  ## Each data format has its own unique set of configuration options, read
  ## more about them here:
  ## https://github.com/influxdata/telegraf/blob/master/docs/DATA_FORMATS_INPUT.md
  data_format = "json"
Notice that the brokers field is localhost:9092, which is your Apache Kafka broker address.
The topics field is garden_sensor_data, which means any message produced into this topic will be captured by Telegraf. You should also note that the data_format is set to json due to the fact that InfluxGarden requires a system that processes its JSON sensor data. For more information about the supported data formats, you can read the Telegraf GitHub page for “Input Data Formats”.
Now that you’ve configured Telegraf, it’s ready to be run. Before running the telegraf command, you must define the $INFLUX_TOKEN, which is in your output configuration.
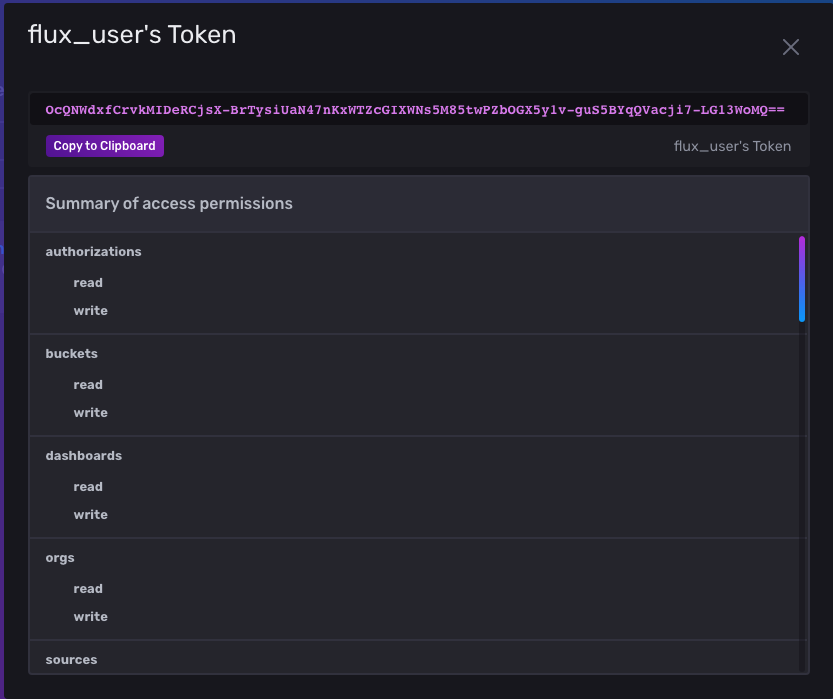
You can get the token by navigating back to the Load Data page and selecting API Tokens. Click the flux_user’s Token link, which should open a pop-up window that shows you the token for the flux_user user you’ve created:
Copy the token and navigate back to your terminal window. For security reasons, don’t directly define it in the telegraf.conf file, but set it as an environment variable on your computer. Then run the following command by replacing _YOUR_INFLUXDB_TOKEN_ with your token:
export INFLUX_TOKEN=_YOUR_INFLUXDB_TOKEN_In the same terminal window, run the following command to execute Telegraf. Make sure you set _YOUR_HOME_DIRECTORY_ correctly in this command:
telegraf --config _YOUR_HOME_DIRECTORY_/influxgarden_integration/telegraf.confThe output should be as follows:
2022-05-21T19:38:37Z I! Starting Telegraf 1.22.4
2022-05-21T19:38:37Z I! Loaded inputs: kafka_consumer
2022-05-21T19:38:37Z I! Loaded aggregators:
2022-05-21T19:38:37Z I! Loaded processors:
2022-05-21T19:38:37Z I! Loaded outputs: influxdb_v2
2022-05-21T19:38:37Z I! Tags enabled: host=_YOUR_HOSTNAME_
2022-05-21T19:38:37Z I! [agent] Config: Interval:10s, Quiet:false, Hostname:"_YOUR_HOSTNAME_", Flush Interval:10s
Running the Garden Sensor Gateway application
The InfluxGarden shares a Python application simulating a sensor that produces a variety of sensor data to the garden_sensor_data Kafka topic. This sensor data includes the information for humidity, temperature, soil, and wind, which are the sensor data types that InfluxGarden requires.
To download the producer application, copy the file content from this GitHub page and save it in the influxgarden_integration directory with the name garden_sensor_gateway.py.
Before running the sensor application, be sure that the Kafka cluster, InfluxDB, and the Telegraf instances are still running. Then run the following command to execute the application:
python3 garden_sensor_gateway.pyWhen you run the application, it sends a randomly generated sensor data to Kafka in five-second intervals. After a few five-second intervals, the output should look like this:
Sensor data is sent: {"temperature": 33.6, "humidity": 49.1, "wind": 1.1, "soil": 0.6}
Sensor data is sent: {"temperature": 0.9, "humidity": 81.6, "wind": 6.4, "soil": 23.3}
Sensor data is sent: {"temperature": 30.6, "humidity": 10.2, "wind": 4.0, "soil": 80.3}
Sensor data is sent: {"temperature": 8.1, "humidity": 92.9, "wind": 10.0, "soil": 0.9}
Sensor data is sent: {"temperature": 35.1, "humidity": 71.5, "wind": 4.9, "soil": 56.5}
Sensor data is sent: {"temperature": 48.7, "humidity": 22.7, "wind": 1.2, "soil": 38.2}
...output omitted...
To see the data in action, navigate back to your InfluxDB web interface. From the menu on the left, click Explore, which will open the Data Explorer page:
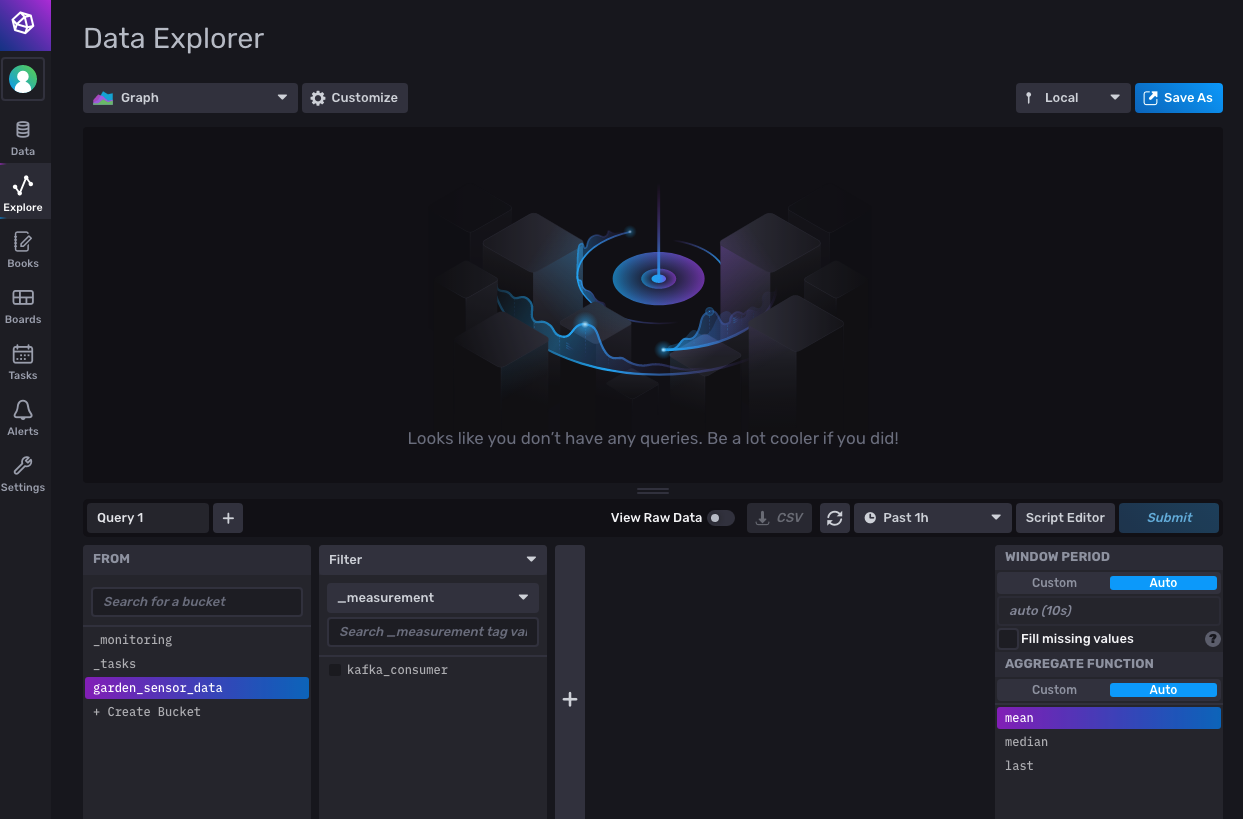
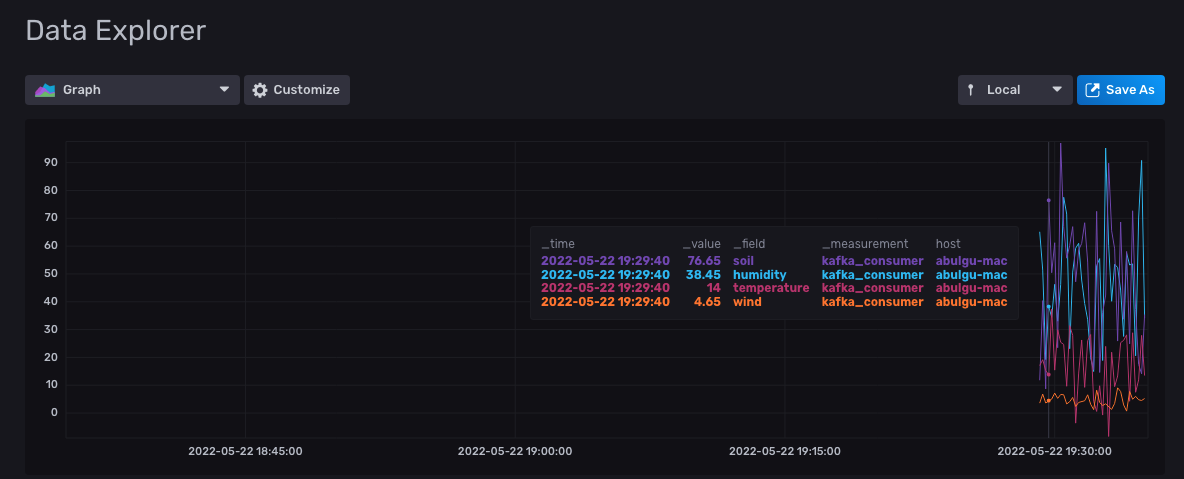
At the bottom of the page, you should see that the garden_sensor_data bucket is already selected. Click the kafka_consumer filter checkbox beside it; then click the Submit button on the right to run the query for all fields. This should open a graph that shows the changes in the sensor data:
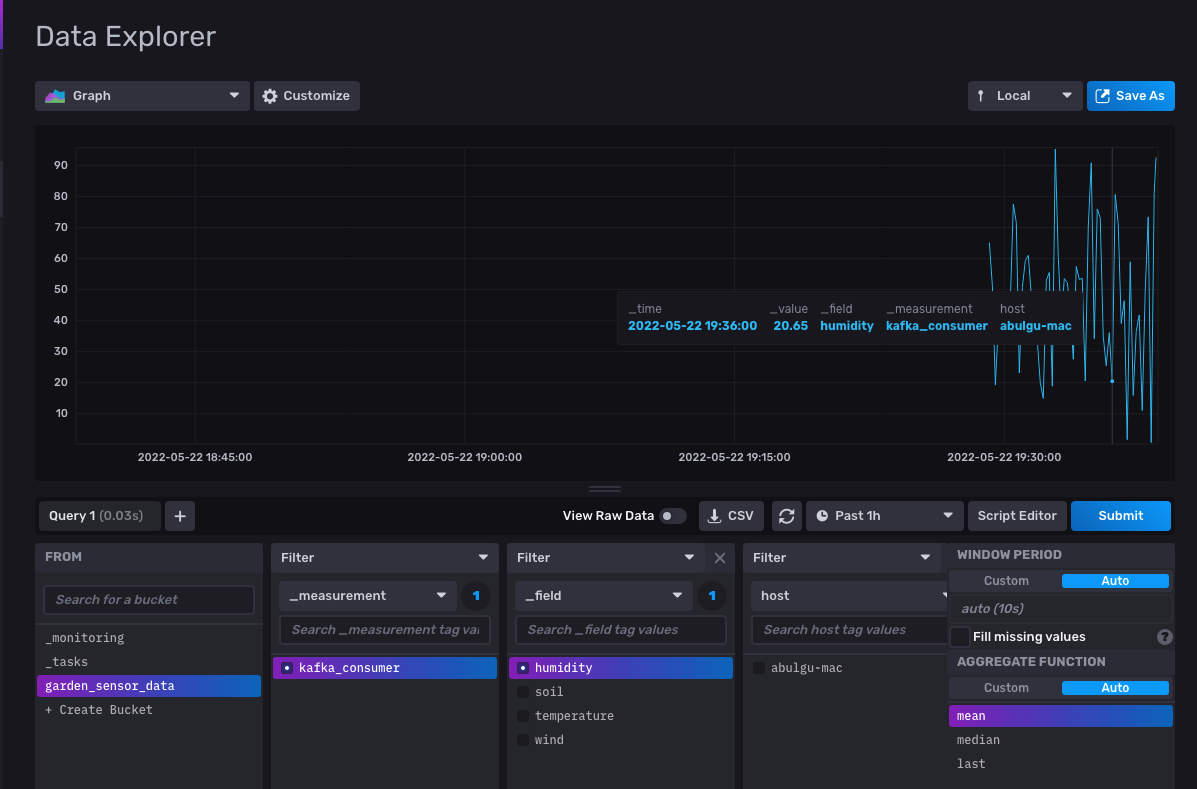
To monitor a specific sensor data change, you can click one of the field checkboxes on the _field filter. Then select one of the sensor data fields (in this case, humidity) and click Submit to filter the results:
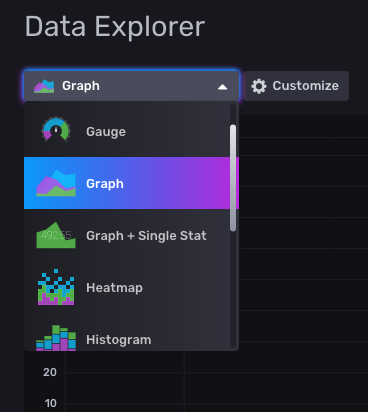
Instead of Graph, you can select other InfluxDB data visualization features from the drop-down:
Conclusion
In this tutorial, you successfully streamed real-time sensor data from Apache Kafka to InfluxDB using Telegraf.
InfluxDB provides storage and time series data retrieval for monitoring, application metrics, IoT sensor data, and real-time analytics. It can be integrated with Apache Kafka easily using Telegraf to send or receive metrics or event data for both processing and monitoring.
You can find the resources for this tutorial in this GitHub repository.
Additional resources
Now that you are storing your time series data with InfluxDB, there are a number of other features you can take advantage of to get the most value out of your data. Check out these resources if you are interested in next steps you can take:
-
InfluxDB University - Free courses from beginner to advanced covering various topics related to InfluxDB
-
Time series data analysis - Learn how to analyze your time series data
-
Time series data forecasting - Learn how to make forecasts and projections from your data
-
Alerts and Tasks - Learn how to create alerts and perform automated tasks with InfluxDB
-
Node-RED Tutorial - Learn how to use Node-RED with InfluxDB to process and take automated action on your time series data
About the author
Aykut Bulgu, a services content architect at Red Hat, has worked as a software engineer, consultant, and trainer for fifteen years. He has worked on many enterprise projects—mainly Java—and used many open source projects including the JBoss middleware. Currently, he works with open source projects such as Apache Kafka, Camel, and Strimzi to create well-grounded courses. He enjoys disseminating the system craftsmanship culture and co-organizes events for the Software Craftsmanship Turkey community.
Website: https://www.systemcraftsman.com/
Twitter: https://twitter.com/systemcraftsman
