How to Monitor Your Monitoring Solution with InfluxDB
By
Community
updated December 14, 2025
Product
Use Cases
Developer
Company
Navigate to:
This article was written by InfluxAce Nikki Cornell, a Software Engineer at Digits.
In the real world, if your observability pipeline goes down, you may not receive vital alerts for the system that’s being monitored. To solve that problem, I looked to Sensu Go internally, and decided to utilize the /metrics API endpoint that advertises Prometheus metrics. This is how I conceptualized the Sensu Go Monitoring Template, an InfluxDB Template, by simply posing the question: “How do you monitor your monitoring solution?”
First encounter with InfluxDB
My experience using the InfluxDB time series database, from the start, was very positive. Its ease of use is honestly one of the best within the space, and the documentation is vast yet concise with concrete examples throughout. InfluxDB has a really strong product fit, so it’s cohesive in just about every stack.
Sensu Go - in a nutshell
Sensu, at its core, is an observability event pipeline. It collects, processes and routes different event types including discovery, availability, telemetry and alerts. It’s a monitoring as code solution with endless permutations and customizations for network and infrastructure o11y (“o11y”, for those who don’t know, is short for “observability”). Sensu Go is a complete rewrite of Sensu Core (the original version of Sensu) in Go, with new capabilities and reduced operational overhead. It eliminates several sources of friction for new and experienced Sensu users.
Monitoring with InfluxDB Templates
InfluxDB Templates, which are open-source tools that include a packager and a set of pre-made monitoring solutions, let you quickly define your entire monitoring configuration for any technology in one easily-shared, yml text file that can be imported into InfluxDB with a single command. Building and submitting a template is easy, which is why many InfluxDB Templates have been contributed by the community.
How the Sensu Go Monitoring Template works
Sensu Go advertises a /metrics API endpoint which returns Prometheus metrics. These metrics contain internal performance data, such as Sensu events processed, and health information about Sensu’s configured key-value store, etcd. The Prometheus Input Plugin for Telegraf scrapes, extracts, translates and stores these metric points as time series data in InfluxDB.
The template has a preconfigured dashboard, as shown below.
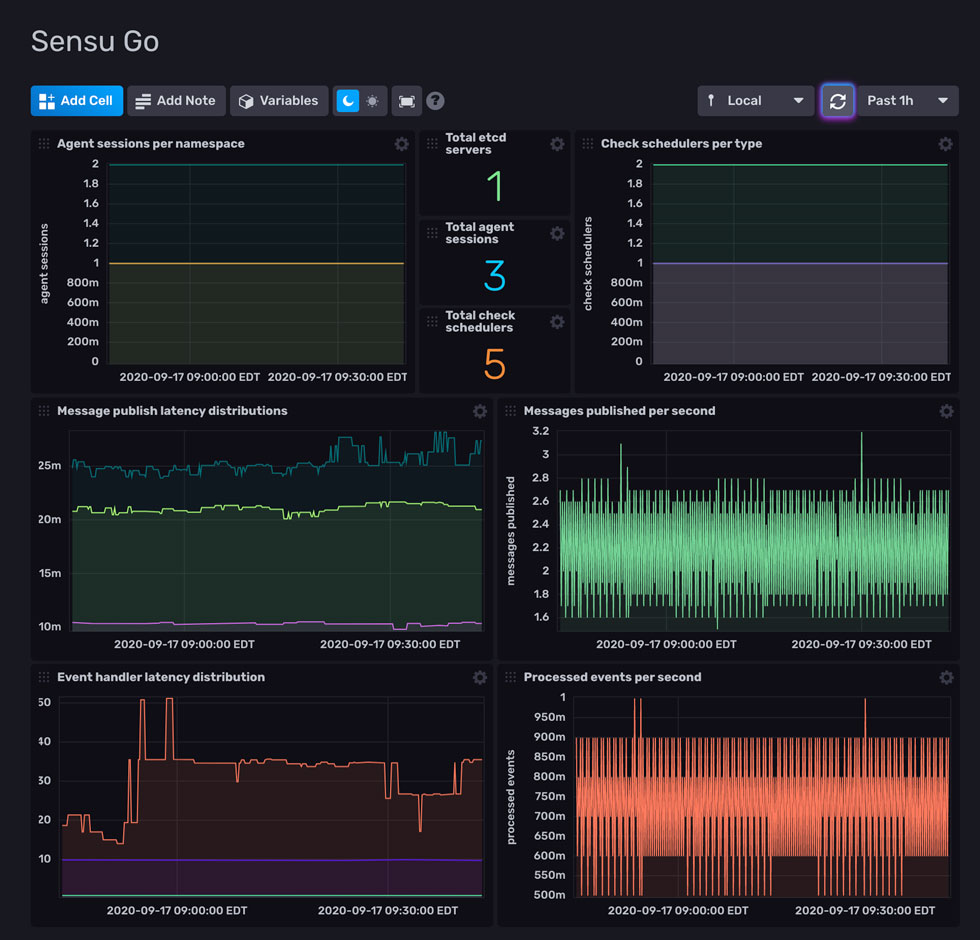
The template facilitates working with time series data and Sensu Go. While Sensu Go has external support and integrations for collecting and routing time series data to InfluxDB, this template actually provides a more direct line to how Sensu is running internally. Using Sensu, Prometheus, Telegraf, and InfluxDB in the stack, we’re actually able to extract and translate performance metrics and health checks about our monitoring solution into a time series database for analysis and visualization.
Metric extraction made easy
With this template’s availability, and since InfluxDB 2.0 has a built-in UI, this further facilitates metric extraction. For example, the article Event Monitoring Visibility Made Easy: Sensu Check Metric Extraction with InfluxDB and Grafana explains how to facilitate extraction of metrics collected by Sensu Go checks and StatsD servers. Now, the template facilitates extraction of metrics from the supported Prometheus metrics within Sensu Go. DevOps is probably the strongest use case for this template, specifically for operators of Sensu and other systems.
With some basic knowledge of deploying Sensu Go and working with Telegraf plugins, it’s easy to use this template. Just sign up for a free InfluxDB Cloud account. Getting the plugin and template set up should be pretty straightforward from there!
