TL;DR InfluxDB Tech Tips — Using and Understanding the InfluxDB Cloud Usage Template
By
Anais Dotis-Georgiou
updated December 14, 2025
Use Cases
Developer
Product
Navigate to:
So you’re using InfluxDB Cloud, and you’re writing millions of metrics to your account. Whether you’re building an IoT application on top of InfluxDB or monitoring your production environment with InfluxDB, your time series operations are finally running smoothly. You want to keep it that way. You might be a Free Plan Cloud user or a Usage-Based Plan user, but either way, you need visibility into your instance size to manage resources and costs. Use the InfluxDB Cloud Usage Template to gain visibility into your usage and take proactive action before you hit your limits.
What is the InfluxDB Cloud Usage Template?
In case you’re new to InfluxData, InfluxDB Templates are a preconfigured and shareable collection of dashboards, tasks, alerts, Telegraf configurations, and more. You apply them by either 1) using the CLI and the influx apply command or 2) copying the URL of a template of interest from the community templates and pasting it into the UI. Today, we’ll apply the InfluxDB Cloud Usage Template to our InfluxDB Cloud account to monitor our usage and rate-limiting events. Rate-limiting events occur when a user exceeds the usage limits of their Cloud account. Use the following command to apply the InfluxDB Cloud Usage Template through the CLI:
influx apply --file https://raw.githubusercontent.com/influxdata/community-templates/master/usage_dashboard/usage_dashboard.yml
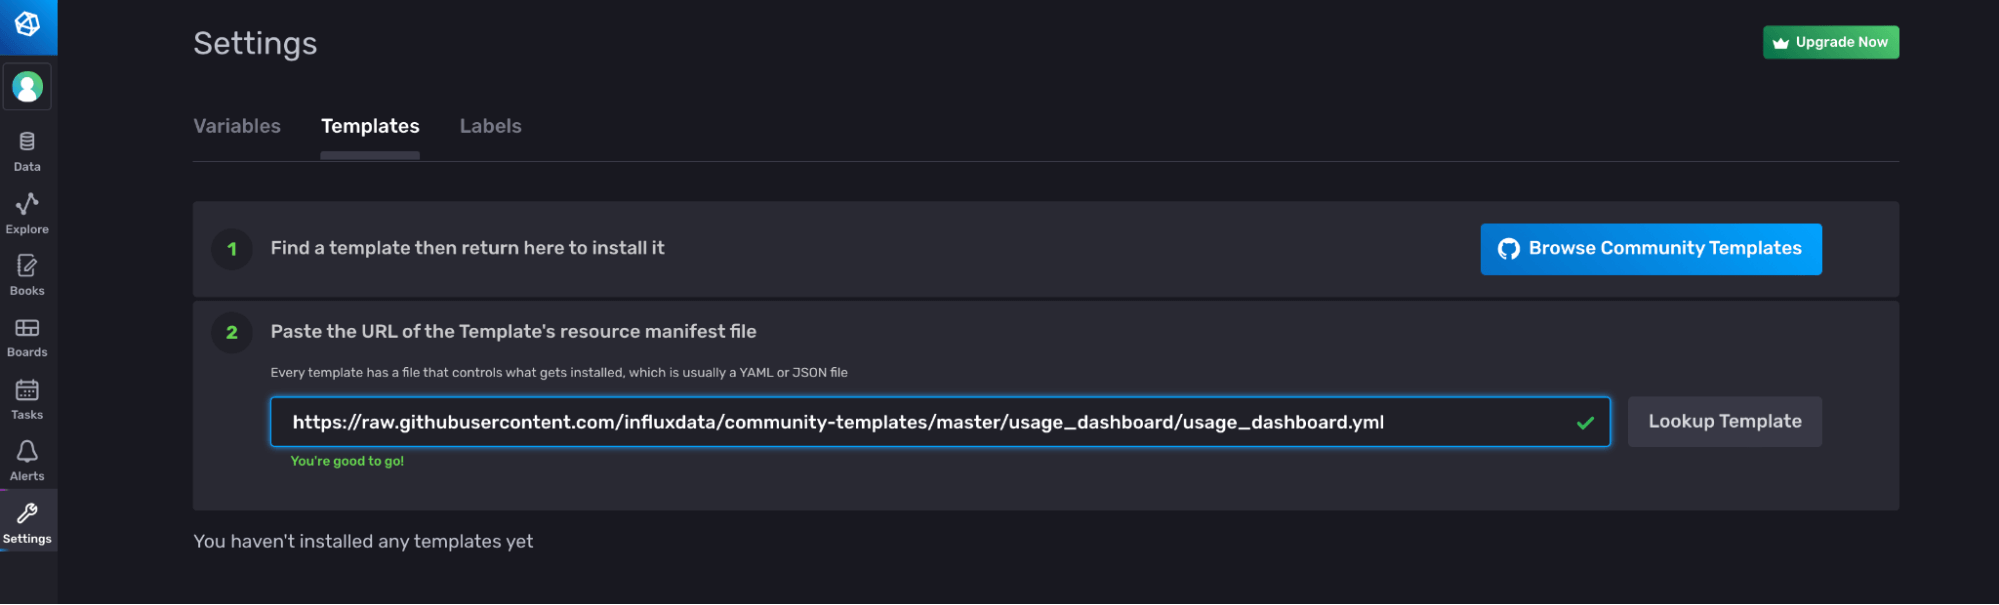
Alternatively, you can use the UI to apply a template. Navigate to the Templates tab on the Settings page and paste the link to the YAML or JSON of the template you want to apply.
The InfluxDB Cloud Usage Template consists of the following resources:
- 1 Dashboard: Usage Dashboard. This dashboard enables you to track your InfluxDB Cloud data usage and limit events.
- 1 Task: Cardinality Limit Alert (usage dashboard) that runs every hour. This task is responsible for determining whether or not your cardinality has exceeded the cardinality limit associated with your Cloud account.
- 1 Label: usage_dashboard. This label helps you find the resources that are part of this template more easily within the UI and through the API.
The Usage Dashboard explained
The InfluxDB Cloud Usage Template contains the Usage Dashboard which gives you visibility into your Data In, Query Count, Storage, Data Out, and Rate-Limiting Events.
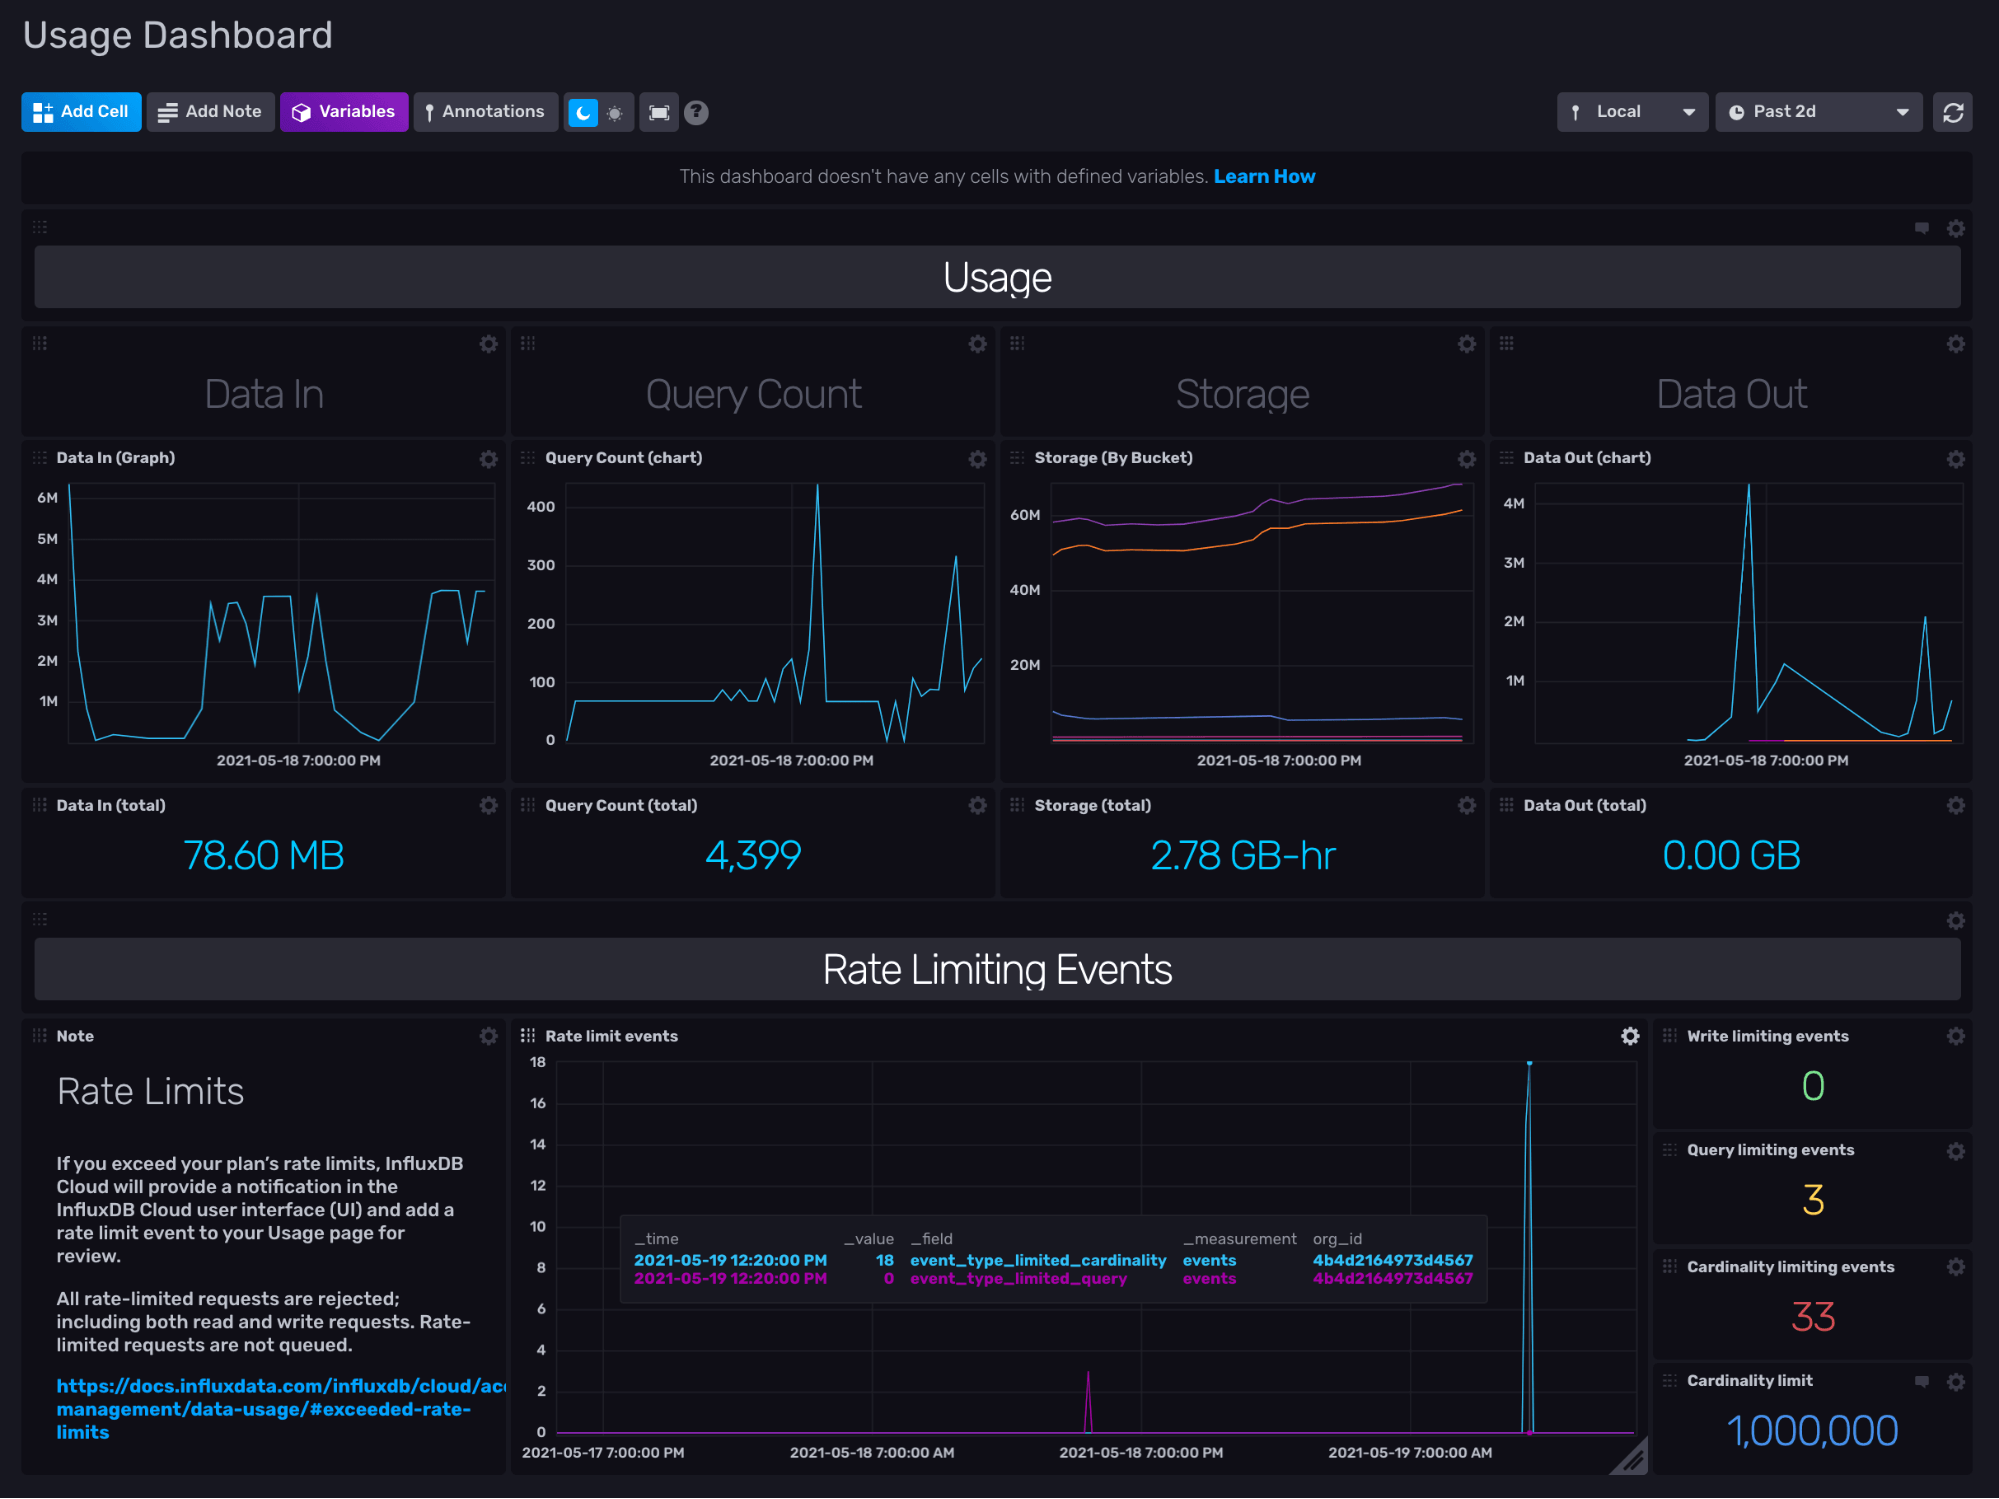
The cells in the dashboard display the following information:
- The Data In (Graph) visualizes the total bytes written to your InfluxDB Org through the /write endpoint.
- The Query Count (Graph) visualizes the number of queries executed.
- The Storage (By Bucket) visualizes the number of total bytes in each bucket and all buckets overall.
- The Data Out (Graph) visualizes the total bytes queried from your InfluxDB organization through the /query endpoint.
- The Rate Limit Events visualizes the number of times limits has been reached
- The Rate Limit Events are split into event types in the bottom right cells to display the number of write limit, query limit, and cardinality limit events as well as the total cardinality limit for your organization.
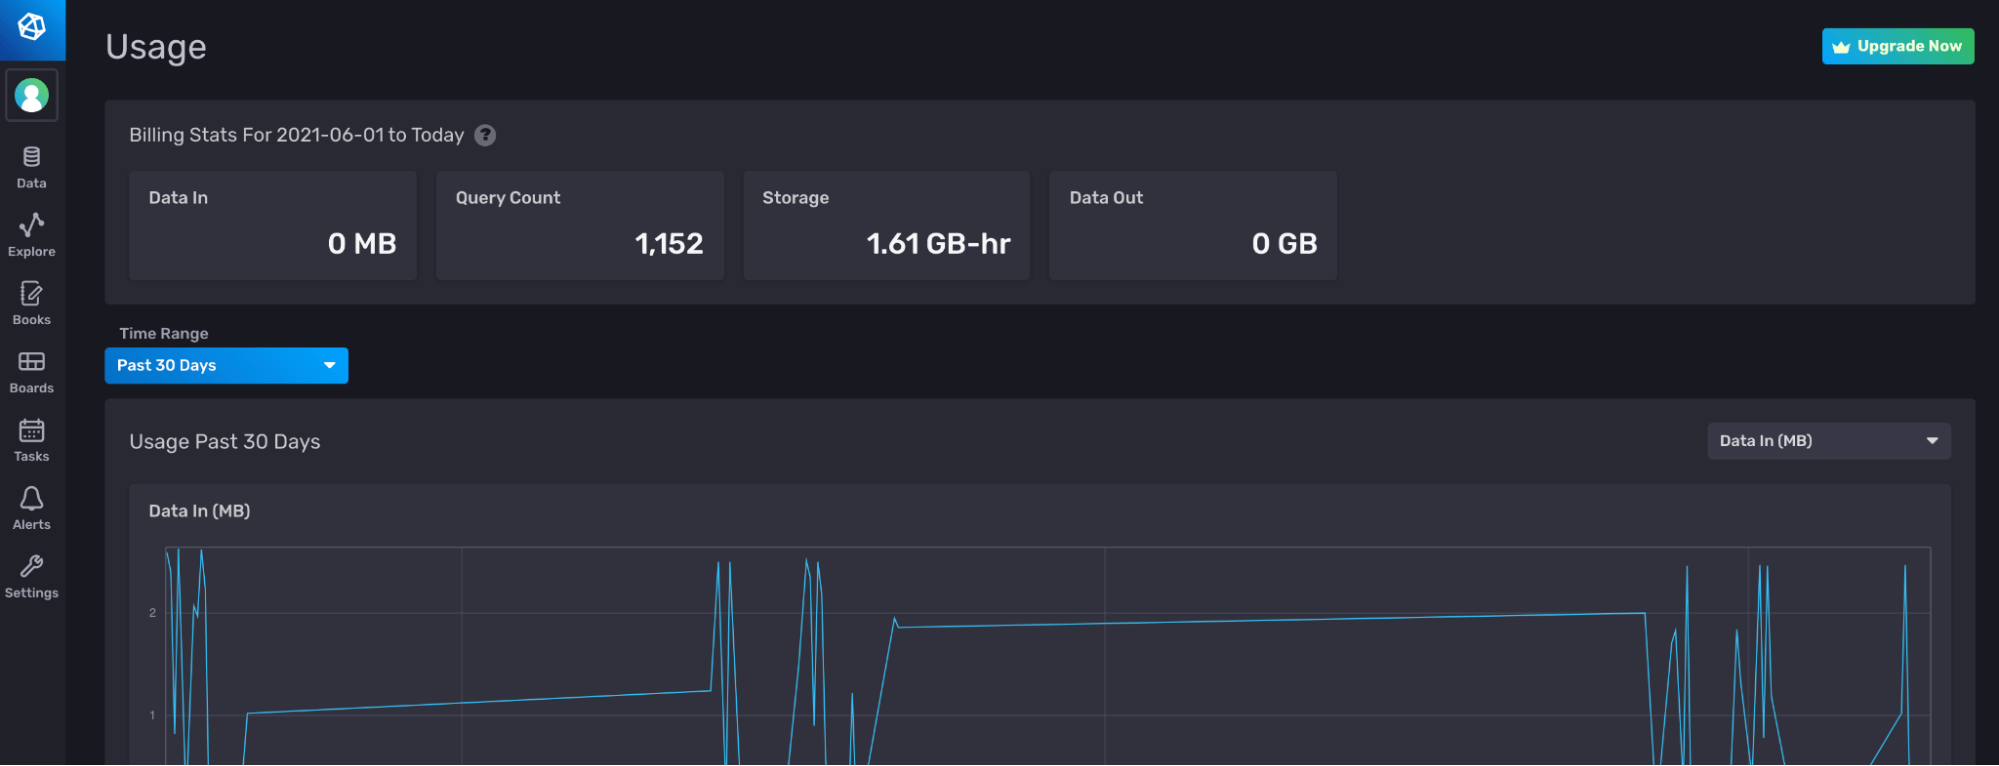
All of these visualizations automatically aggregate the data to 1hr resolution. Essentially, this dashboard supplements the data that exists in the Usage page in the InfluxDB UI to give you even more insights into your usage.
Understanding the Flux behind the Usage Dashboard
In order to fully understand the InfluxDB Cloud Usage Template, you must understand the Flux behind the Usage Dashboard. Let’s take a look at the query that produces the Data In (Graph) visualization in the first cell.
import "math"
import "experimental/usage"

usage.from(
start: v.timeRangeStart,
stop: v.timeRangeStop,
)
|> filter(fn: (r) =>
r._measurement == "http_request"
and (r.endpoint == "/api/v2/write" or r.endpoint == "/write")
and r._field == "req_bytes"
)
|> group()
|> keep(columns: ["_value", "_field", "_time"])
|> fill(column: "_value", value: 0)
|> map(fn: (r) =>
({r with
write_mb: math.round(x: float(v: r._value) / 10000.0) / 100.0
}))
First we import all the relative packages to execute the Flux query that generates the visualization we desire. The Flux math package provides basic mathematical functions and constants. The Flux experimental/usage package provides functions for collecting usage and usage limit data related to your InfluxDB Cloud account. All of the cells, dashboards, and tasks in the InfluxDB Cloud Usage Template use the Flux experimental/usage package. The usage.from() function returns usage data. We filter the usage data for the “req_bytes” field from any writes. Then we group write data, fill any empty rows with 0, and calculate the number of megabytes and store the value in a new column, “write_mb”.
Exploring the experimental/usage Flux Package
The experimental/usage package contains two functions: usage.from() and usage.limits().
The usage.from() function maps to the org/{orgID}/usage endpoint in the InfluxDB v2 API. The usage.from() function returns usage data for your InfluxDB Organization. The usage.from() function requires that you specify the start and stop parameters. By default, the function returns aggregated usage data as an hourly sum. This default downsampling enables you to query usage data over long periods of time efficiently. If you want to view raw high-resolution data, query your data over a short time range (a few hours) and set raw:true. By default the usage.from() returns usage data from the InfluxDB Org you’re currently using. To query an outside InfluxDB Cloud Org, supply the host, orgID, and token parameters. The usage.from() returns usage data with the following schema:
- _time: the time of the usage event (
raw:true) or downsampled usage data (raw:false). - _bucket_id: the bucket id for each bucket specific usage, like the storage_usage_bucket_bytes measurement tag.
- _org_id: the org id for which usage data is being queried from tag.
- _endpoint: the InfluxDB v2 API endpoint from where usage data is being collected tag
- _status: the HTTP status codes a tag.
- _measurement: the measurements.
- http_request
- storage_usage_buckets_bytes
- query _count
- events
- _field: the field keys
- resp_bytes: the number of bytes in one response or
raw:true. In the downsampled data,raw:falseis summed over an hour for each endpoint. - gauge: the number of bytes in the bucket indicated by the bucket_id tag at the moment of time indicated by _time. If your bucket has an infinite retention policy, then the sum of your req_bytes from when you started writing data to the bucket would equal your gauge value.
- req_bytes: the number of bytes in one request for
raw:true. In the downsampled data,raw:falseis summed over an hour for each endpoint. - event_type_limited_cardinality: the number of cardinality limit events.
- event_type_limited_query: the number of query limit events.
- event_type_limited_write: the number of write limit events.
- resp_bytes: the number of bytes in one response or
The usage.limits() function maps to the org/{orgID}/limits endpoint in the InfluxDB v2 API. The usage.limits() returns a record, specifically a json object, of the usage limits associated with your InfluxDB Cloud Org. To return the record in either VS Code or the InfluxDB UI, I suggest using the array.from function like so:
import "experimental/usage"
import "array"
limits = usage.limits()
array.from(rows: [{
    orgID: limits.orgID,
    wrte_rate: limits.rate.writeKBs,
    query_rate: limits.rate.readKBs,
    bucket: limits.bucket.maxBuckets,
    task: limits.maxTasks,
    dashboard: limits.dashboard.maxDashboards,
    check: limits.check.maxChecks,
    notificationRule: limits.notificationRule.maxNotifications,
}])
The Flux above is essentially converting the json output to Annotated CSV with the use of the array.from function. Here is an example of the json object that usage.limits() returns to help you understand where the nested json keys are coming from.
{
  orgID: "123",
  rate: {
    readKBs: 1000,
    concurrentReadRequests: 0,
    writeKBs: 17,
    concurrentWriteRequests: 0,
    cardinality: 10000
  },
  bucket: {
    maxBuckets: 2,
    maxRetentionDuration: 2592000000000000
  },
  task: {
    maxTasks: 5
  },
  dashboard: {
    maxDashboards: 5
  },
  check: {
    maxChecks: 2
  },
  notificationRule: {
    maxNotifications: 2,
    blockedNotificationRules: "comma, delimited, list"
  },
  notificationEndpoint: {
    blockedNotificationEndpoints: "comma, delimited, list"
  }
}
Using the Cardinality Limit Alert Task
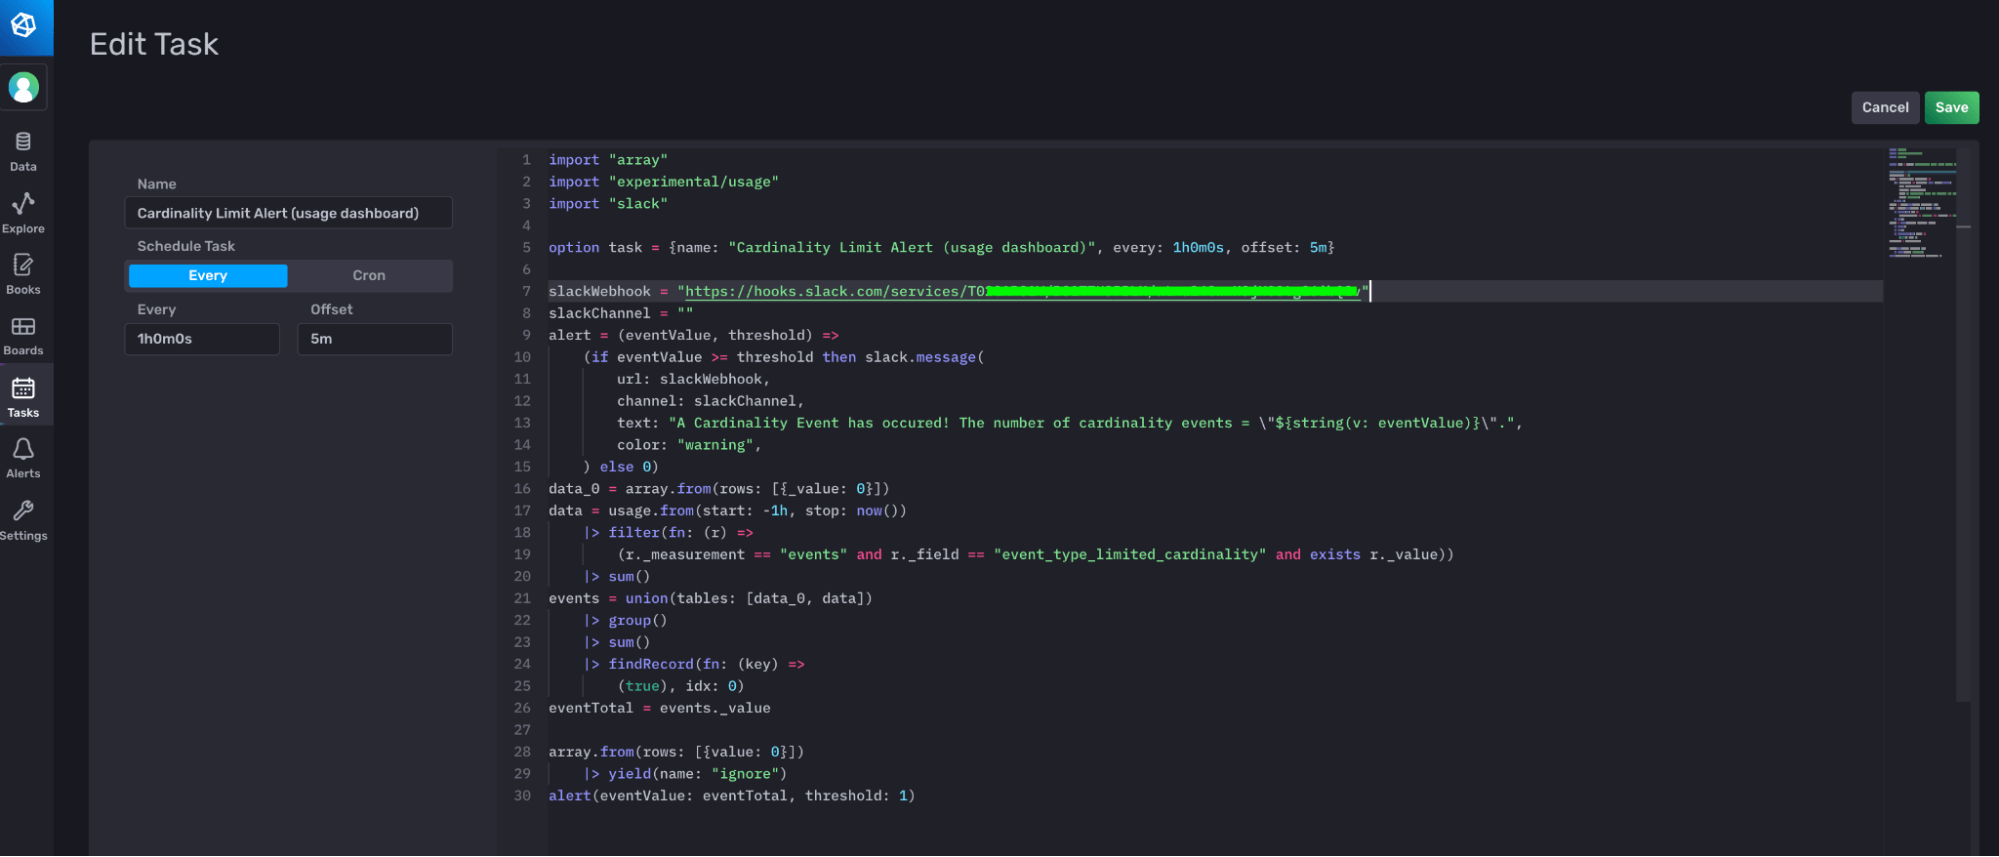
The Cardinality Limit Alert Task is responsible for determining when you have reached or exceeded your cardinality limits and sending an alert to a Slack endpoint. In order to make this task functional and send alerts to your Slack, you must edit the task and supply the webhook. You can either edit the task directly through the UI, or you can use the CLI and the Flux extension for Visual Studio code. For this one-line edit, I recommend using the UI.
Flux development with the CLI, Visual Studio Code, and the Flux extension
The InfluxDB UI is a one-stop-shop for many beginner and intermediate InfluxDB users. It facilitates simple dashboard, notebook, alert and task creation. I typically recommend that users start their InfluxDB journey with the InfluxDB UI because it offers many no-code or low-code solutions that users can take advantage of to do meaningful alerting and visualization work. However, I recommend using VS code and the Flux extension for sophisticated Flux development for a few reasons:
- Many developers are more familiar working with the command line and code editors.
- It offers users the ability to save scripts and easily view the annotated CSV output, and query different orgs easily.
Therefore, we’ll take this opportunity to highlight the workflow for editing and updating a task in VS code with the CLI.
First, list your task with the influx task list command to get your task ID, like so:
./influx task list
![]()
Next use jq, a lightweight command line json parser, to pretty print the Flux for the task, like so:
./influx task list -i 0786fb9aa2bab000 --json | jq -r '.[].flux
Now copy and paste the Flux into VS code and use the Flux extension to update the slackWebhook variable with your Slack webhook. Select the InfluxDB configuration and organization that you want to use from the left-hand panel, right-click to run the query and see the output on the left. You’ll notice that the output is a single column table with a value of 0. We’ll discuss this output in the next section, “Understanding the Flux behind the Cardinality Limit Alert Task”.
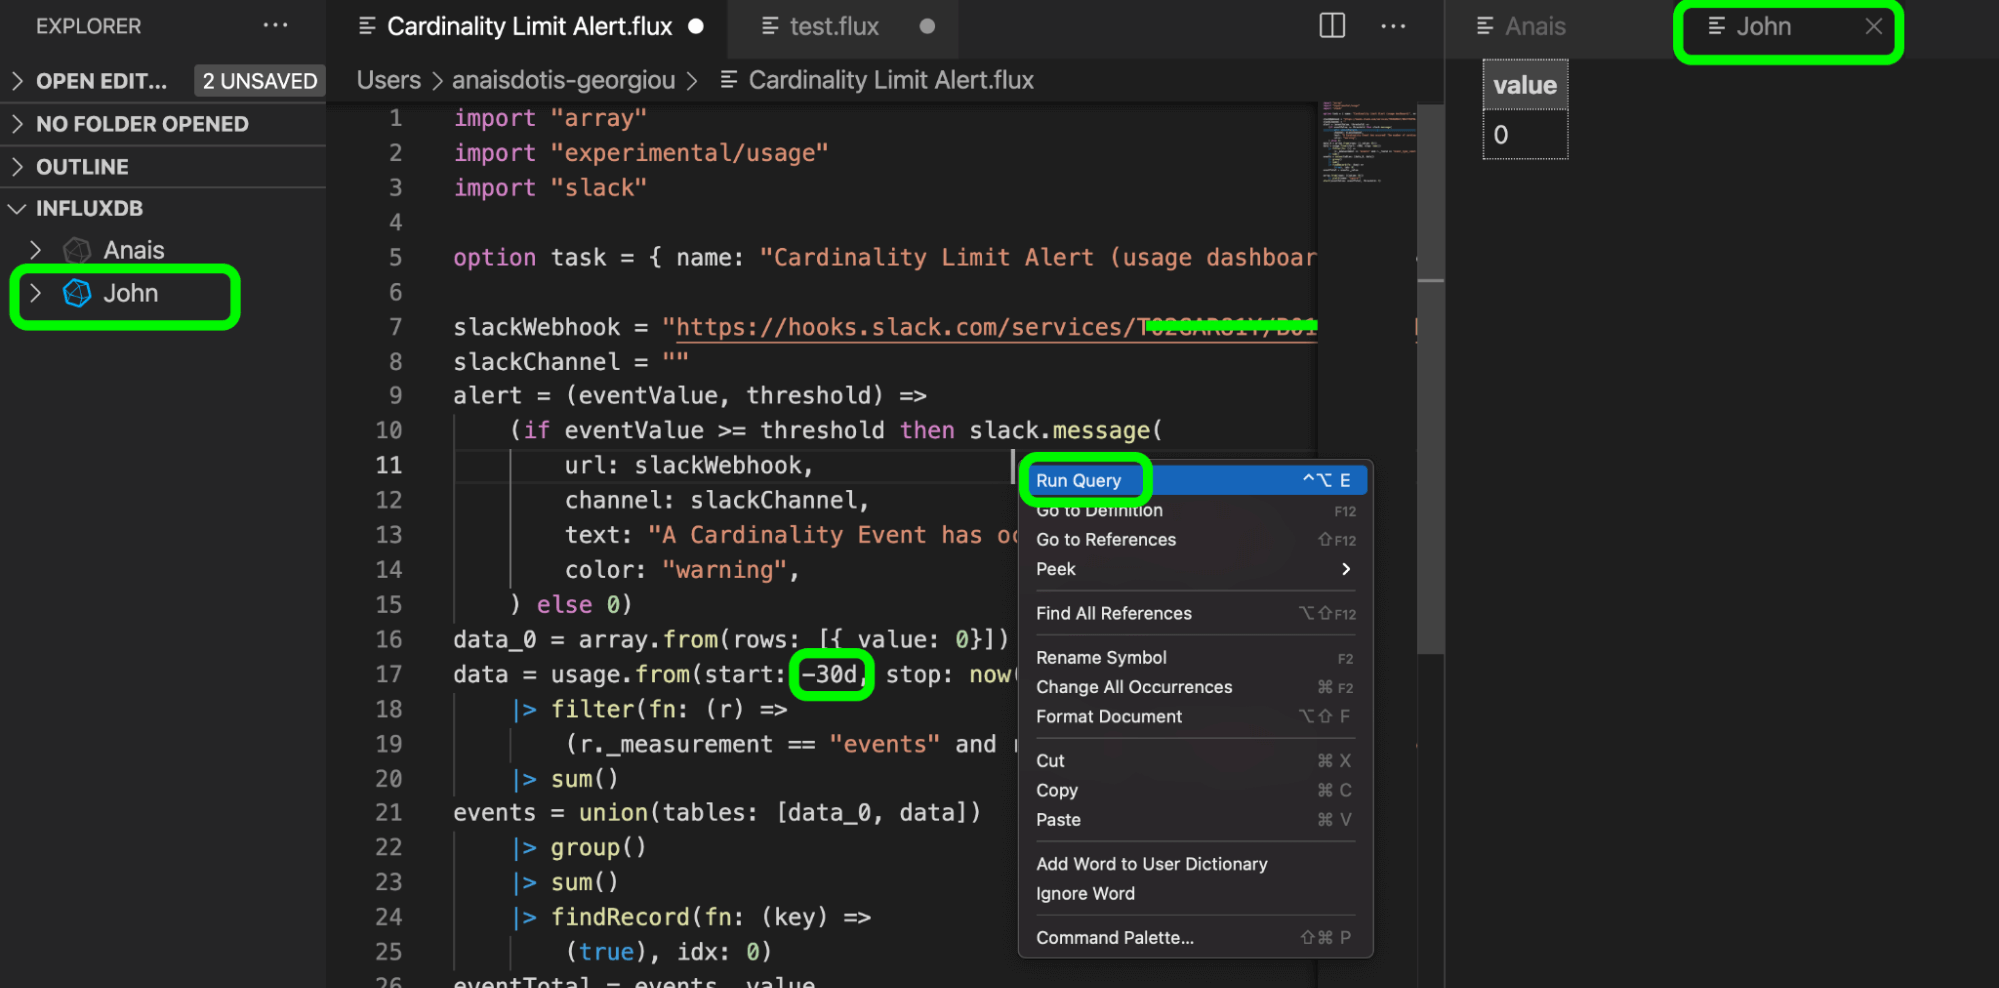
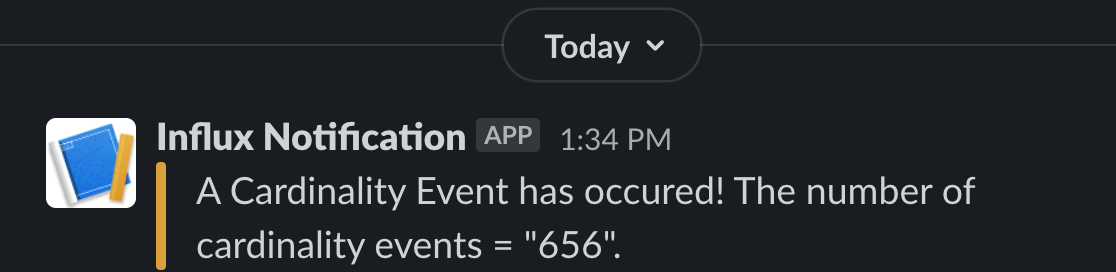
After running the query against my coworker John’s InfluxDB organization, of which I’m a member, I get a Slack alert. I also changed the query duration of the task to query all the cardinality limit events from the past 30 days (line 17) because we invoked hundreds of cardinality events over the past month. Select this long query time range just to check that the task is successfully firing alerts to Slack.
Finally, now that I’m confident my task works as expected, I return the value of the start parameter to -1h before updating the task with the influx update task command, like so:
influx task update --file /path/to/example-task.flux
Understanding the Flux behind the Cardinality Limit Alert Task and bypassing the InfluxDB Checks and Notifications System
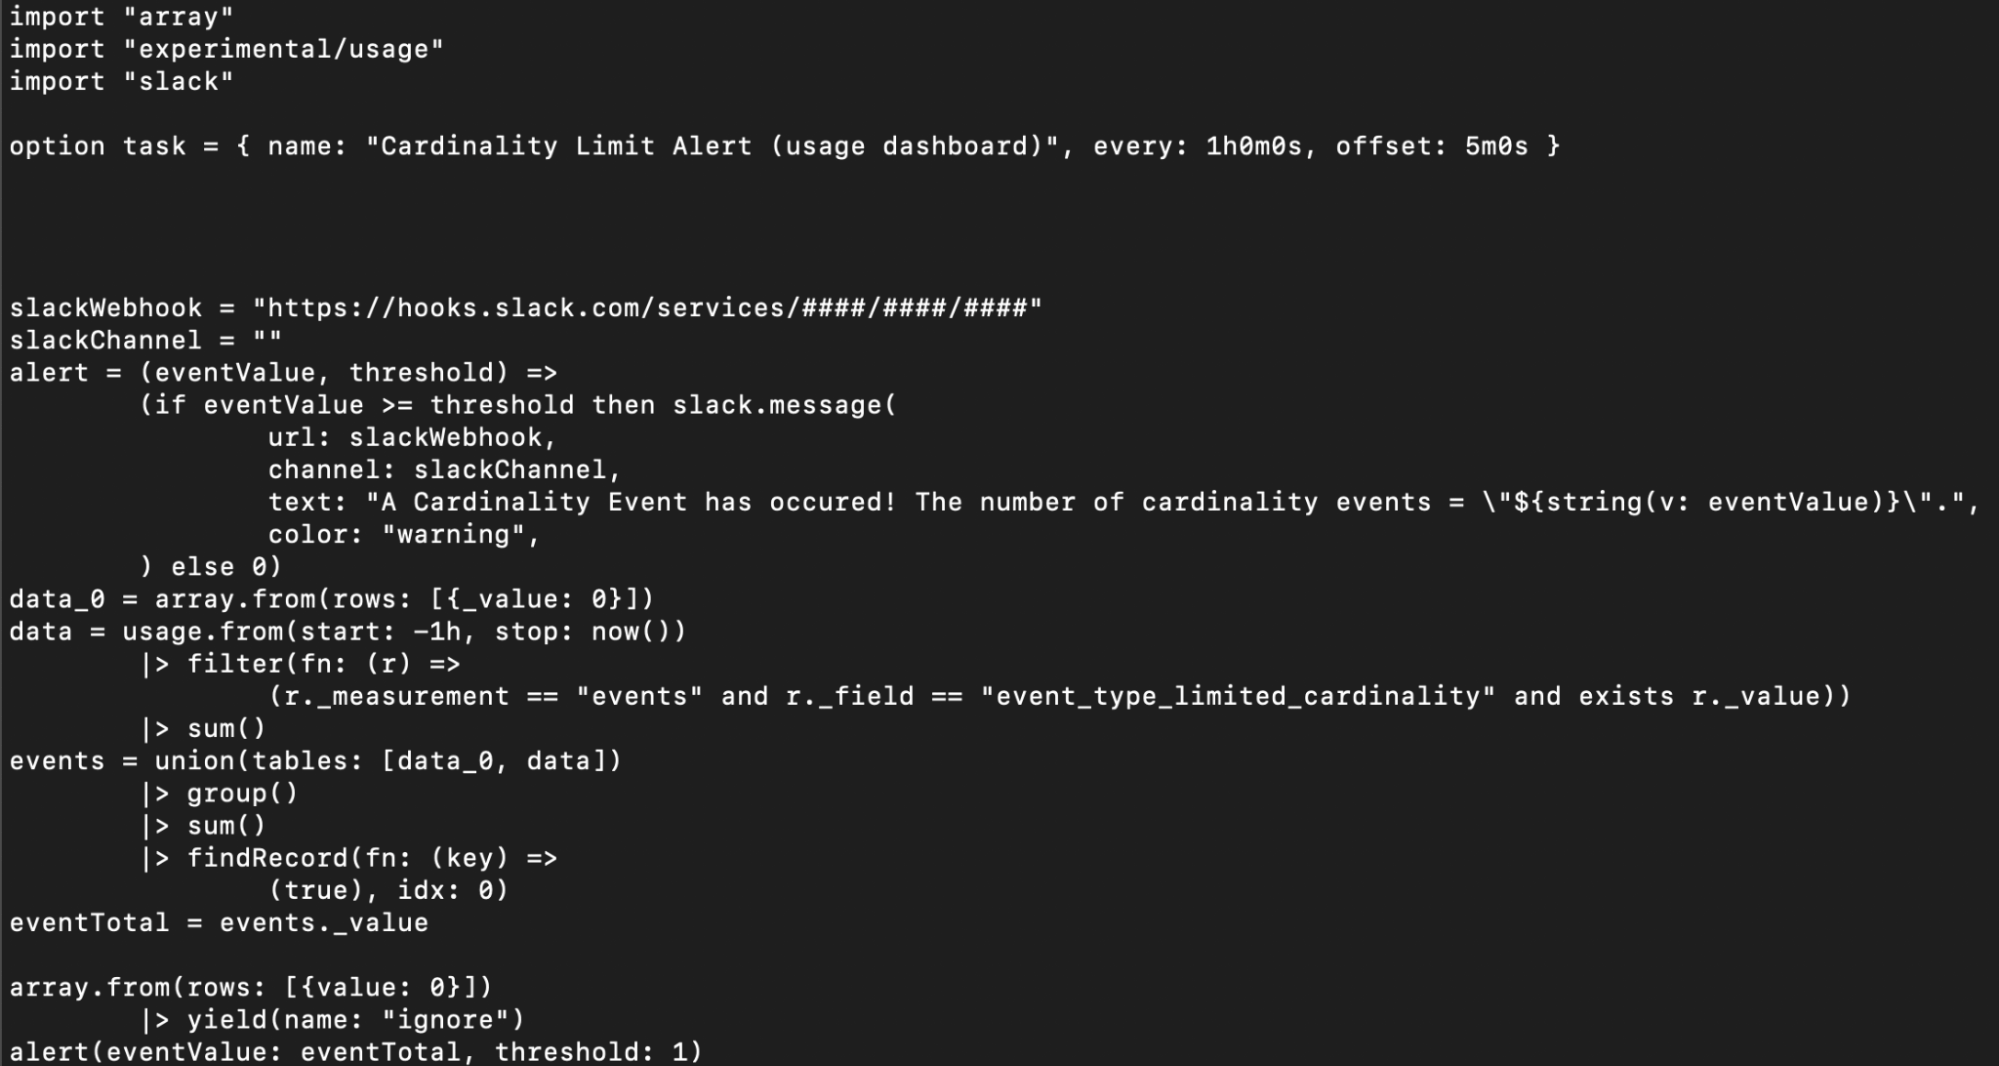
Now that we understand best practices associated with complex Flux development, so let’s take a moment to review the Flux behind the Cardinality Limit Alert Task. As with any Flux task or script, first import all relevant packages. Next, specify the task options, including the name, every, and offset parameter. The every interval specifies the query start time while the offset interval specifies when the task should run. Including an offset in your task options ensures that you’re capturing any late incoming data and helps you avoid read/write conflicts.
import "array"
import "experimental/usage"
import "slack"
option task = { name: "Cardinality Limit Alert (usage dashboard)", every: 1h0m0s, offset: 5m0s }
Next, specify your slackWebhook URL and slackChannel. If you’re sending a direct message, then supply empty quotes as your slackChannel.
slackWebhook = "https://hooks.slack.com/services/####/####/####"
slackChannel = ""
Now define a custom function, alert(), to trigger a Slack message when the number of cardinality events, eventValue, exceeds your threshold. We use conditional logic and the slack.message() function to achieve this.
alert = (eventValue, threshold) =>
(if eventValue >= threshold then slack.message(
url: slackWebhook,
channel: slackChannel,
text: "A Cardinality Event has occured! The number of cardinality events = \"${string(v: eventValue)}\".",
color: "warning",
) else 0)
Now we’d expect to be able to query our cardinality events with usage.from() and simply apply this function to the output of that query to trigger a slack alert when our events exceed our threshold. However, there are two problems we must address which slightly complicate our Flux script.
- First, we must handle instances when querying for cardinality events returns no results. In order to initialize our query to return a table with a value of 0, the array.from() function is applied.
- Second, the output of flux queries is a stream of tables in annotated CSV format, not scalars, which are the expected inputs to our alert() function. In order to return scalars from an annotated CSV output, the findRecord() function is applied.
We use the array.from() function to store a single table with one column (_value) and row with a value of 0 into the variable data_0. We query for our cardinality event data with usage.from() by applying the appropriate filters, summing the events, and storing the output in a variable data. Next, we perform a union between the two table streams, data_0 and data to ensure a table output and successful application of our alert() function subsequently. A group() and sum() function is applied to the union to reduce the output of the union to a single column, single row table. Note the sum() function is simply adding 0 to the cardinality event value. Now that a table is always being returned, the findRecord() function is applied to retrieve the scalar value which we’ll input into our alert() function.
data_0 = array.from(rows: [{_value: 0}])
data = usage.from(start: -1h, stop: now())
|> filter(fn: (r) =>
(r._measurement == "events" and r._field == "event_type_limited_cardinality" and exists r._value))
|> sum()
events = union(tables: [data_0, data])
|> group()
|> sum()
|> findRecord(fn: (key) =>
(true), idx: 0)
eventTotal = events._value
alert(eventValue: eventTotal, threshold: 1)
Finally, tasks require that a table stream is returned. If a task doesn’t output a table stream, it will fail even though it is successfully querying our usage data and executing our alert logic. In order to satisfy this table yield requirement for tasks, we yield data_0, our initialization table.
data_0
|> yield(name: "ignore")f
This eccentricity introduces the most important aspect of this task, which is that it entirely bypasses the InfluxDB Checks and Notifications System. The reason why table outputs are a requirement for tasks is because typically check tasks and notification tasks use the monitor.check() and monitor.notify() functions which output and write metadata about your check and notification to the system bucket “_monitoring”. These functions and their metadata output provides visibility into your checks and notification tasks as well as a unified organizational system for all of your check and notification data. However, as demonstrated by our Cardinality Limit Alert (usage dashboard) task, the user isn’t forced to subscribe to the InfluxDB Checks and Notification System and can elect to bypass it entirely if they see fit. To learn more, read the InfluxDB’s Checks and Notification System blog or see the “Further Reading” section below.
Supplement the Usage Template with your own task alerts
While the InfluxDB Cloud Usage Template comes with the Cardinality Limit Alert Task, you’re not limited to this task. I recommend thinking of that Task as a springboard for creating your own tasks and alerts on your InfluxDB Cloud Usage. For example you might decide that you want to send alerts to endpoints other than Slack. You can edit the Flux code to use any <package>.message() function to send an alert to the endpoint of your choice. Please take a look at this issue #2405 for a complete list of Flux notification endpoint packages.
Alternatively, you might decide that you want to create a task that alerts you when you’ve hit a write limit event instead. The task would look identical to our cardinality limit event task above, but with a single modification to the field type:
data = usage.from(start: -1h, stop: now())
|> filter(fn: (r) =>
(r._measurement == "events" and r._field == "event_type_limited_write" and exists r._value))
Further reading
While this post aims to provide a comprehensive overview of the InfluxDB Cloud Usage Template and the Flux that powers it, the following resources might also interest you:
- TL;DR InfluxDB Tech Tips – Monitoring Tasks and Finding the Source of Runaway Cardinality: This post describes how to use the Operational Monitoring Template to help you identify the source of your cardinality when you hit cardinality events. I encourage you to try out both the Operational Monitoring Template as well as the InfluxDB Cloud Usage Template to gain a comprehensive understanding of the instrumentation options available to you within InfluxDB Cloud.
- InfluxDB's Checks and Notifications System: This post describes how InfluxDB's Checks and Notifications System works and how to create custom check and notification tasks.
- TL;DR InfluxDB Tech Tips – How to Interpret an Annotated CSV: This post describes how to interpret an Annotated CSV, the Flux query result format for InfluxDB. If you're new to InfluxDB and Flux, I recommend investing time to understand the Annotated CSV output before trying to write complex custom check tasks.
- TL;DR InfluxDB Tech Tips – How to Extract Values, Visualize Scalars, and Perform Custom Aggregations with Flux and InfluxDB: This post describes how to use findRecord() to extract scalars as well as a hack to enable you to visualize them in the UI.
- Flux Telegram Package: This video describes how to configure a Telegram bot and send notifications to Telegram with the Flux Telegram Package.
- TL;DR InfluxDB Tech Tips: Configuring a Slack Notification with InfluxDB: This post describes how to configure a Slack webhook to send notifications to slack with Flux.
Final thoughts on the InfluxDB Cloud Usage Template
I hope this InfluxDB Tech Tips post inspires you to take advantage of the InfluxDB Cloud Usage Template. Finally the following issues might be relevant to you and your Flux development. I encourage you to comment and share your thoughts, so that InfluxData can better support you:
- InfluxDB UI #1664: Support visualization for data formats other than Annotated CSV.
- Flux Extension for VS Code #234: Support visualization for data formats other than Annotated CSV.
- Flux #3726: Bypass error invoking stream functions for Tasks.
If you are using a community template or Flux and need help, please ask for some in our community site or Slack channel. If you’re developing a cool IoT application on top of InfluxDB, we’d love to hear about it, so make sure to share your story! Additionally, please share your thoughts, concerns or questions in the comments section. We’d love to get your feedback and help you with any problems you run into!
