Building an IoT App with InfluxDB Cloud, Python and Flask (Part 3)
By
Rick Spencer
updated December 14, 2025
Product
Use Cases
Developer
Navigate to:
Last year I started an IoT project, Plant Buddy. This project entailed soldering some sensors to an Arduino, and teaching that device how to communicate directly with InfluxDB Cloud so that I could monitor those plants. Now I am taking that concept a step further and writing the app for plantbuddy.com. This app will allow users to visualize and create alerts from their uploaded Plant Buddy device data in a custom user experience.
If you want some background, you can check out Part 1, where I design the basics of the device and teach it to communicate and add some notifications, and Part 2, where I start some downsampling and a dashboard. (In Part 4, Barbara Nelson provides a sequel to this article in which she shows how to use the UI, not the CLI, for the same functionality.)
Objectives (building on InfluxDB Cloud)
This tutorial is written very much with the application developer in mind. I happen to be using Python and Flask for this tutorial, but all of the concepts should apply equally to any language or web development framework.
This tutorial will cover:
- How to bootstrap your development environment to get developing on InfluxDB Cloud
- How to use the InfluxDB Python Client library to receive data from your users, and write that data to InfluxDB Cloud
- How to query InfluxDB Cloud so that your app can visualize the data for your users.
- How to install a downsampling task in InfluxDB that will both save you money in storage costs as well as optimize the user experience for your users
- How to use InfluxDB Cloud's powerful "Checks and Notifications" system to help you provide custom alerting to your users
This tutorial is meant to focus on InfluxDB, not IoT applications in general, so I will not be focused on things like:
- Creating your device and sending data from it
- User authorization for your own web app
- Managing secrets in your own web app
- How to use the many powerful visualization libraries for the different platforms
Where's the code?
The code for this tutorial is available on GitHub. There are two branches:
- If you want to see just the starting point, that is in the demo-start branch.
- If you want to see the completed project, that is in the demo-done branch.
plantbuddy.com Overview
Data segmentation strategies
Before we start off bootstrapping the development environment, here is a bit of food for thought regarding if and how to segment your user data. This section is fairly conceptual, so you can feel free to skip it.
Most likely, your application will have many users. You will generally want to only display to each user the data that they wrote into the application. Depending on the scale of your application and other needs, there are 3 general approaches to consider.
- Single Multi-User Bucket. This is the default approach. In this approach, you put all of your users' data into a single bucket in InfluxDB and you use a different tag for each user to enable fast querying.
- Bucket per User. In this approach you create a separate bucket for each user. This approach is more complex to manage in your app, but allows you to provide read and write tokens to your users so that they can read and write directly from their own bucket if needed for your application.
- Multi-Org. In this approach, you create a separate organization for each user. This provides the ultimate separation of customer data, but is more complex to set up and manage. This approach is useful when you are acting as a sort of OEM, where your customers have their own customers and you need to provide management tools to your customers.
| Approach | Pros | Cons | Summary |
| Multi-user Bucket |
|
|
Default approach, using tags to segment customers in a single bucket |
| Bucket per User |
|
|
Useful when segmenting customer data is important, but more effort. Allows direct reads and writes. |
| Multi-Org |
|
|
Ultimate in customer data segmentation. Useful when your customers have their own customers. |
Due to the relatively simple and low-sensitivity nature of Plant Buddy, the default approach of Multi-user Bucket makes the most sense. Plant Buddy has a fairly simple schema. But if you are interested in learning more about these topics, you can read up on data layout and schema design here.
IoT application and InfluxDB Cloud architecture overview
Zooming way out, Plant Buddy will work more or less like this:
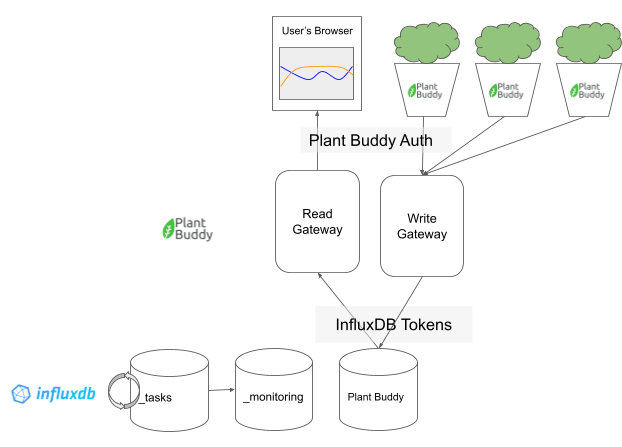
At the top level is the user experience. They will be able to view the sensor readings in their web browser, and each user can have any number of Plant Buddies reporting data.
The Plant Buddy application itself is roughly divided into two parts: what I call the “Write Gateway” and the “Read Gateway.” These “gateways” are, in fact, simply endpoints in the Plant Buddy Flask application, as you will see, but they could easily be divided into their own applications.
User authentication for reads and writes between the user and their devices are handled by Plant Buddy itself. Each device and each browser request should be authorized by Plant Buddy.
Finally there is the backend, which is InfluxDB. The read gateway and the write gateway write to the same bucket (to start, more on that later when we introduce downsampling). We will also be taking advantage of InfluxDB’s task system and the provided _tasks and _monitoring system buckets.
Authentication between the Plant Buddy code and the InfluxDB backend is managed by InfluxDB tokens, which are stored as secrets in the web app.
Plant Buddy starter code
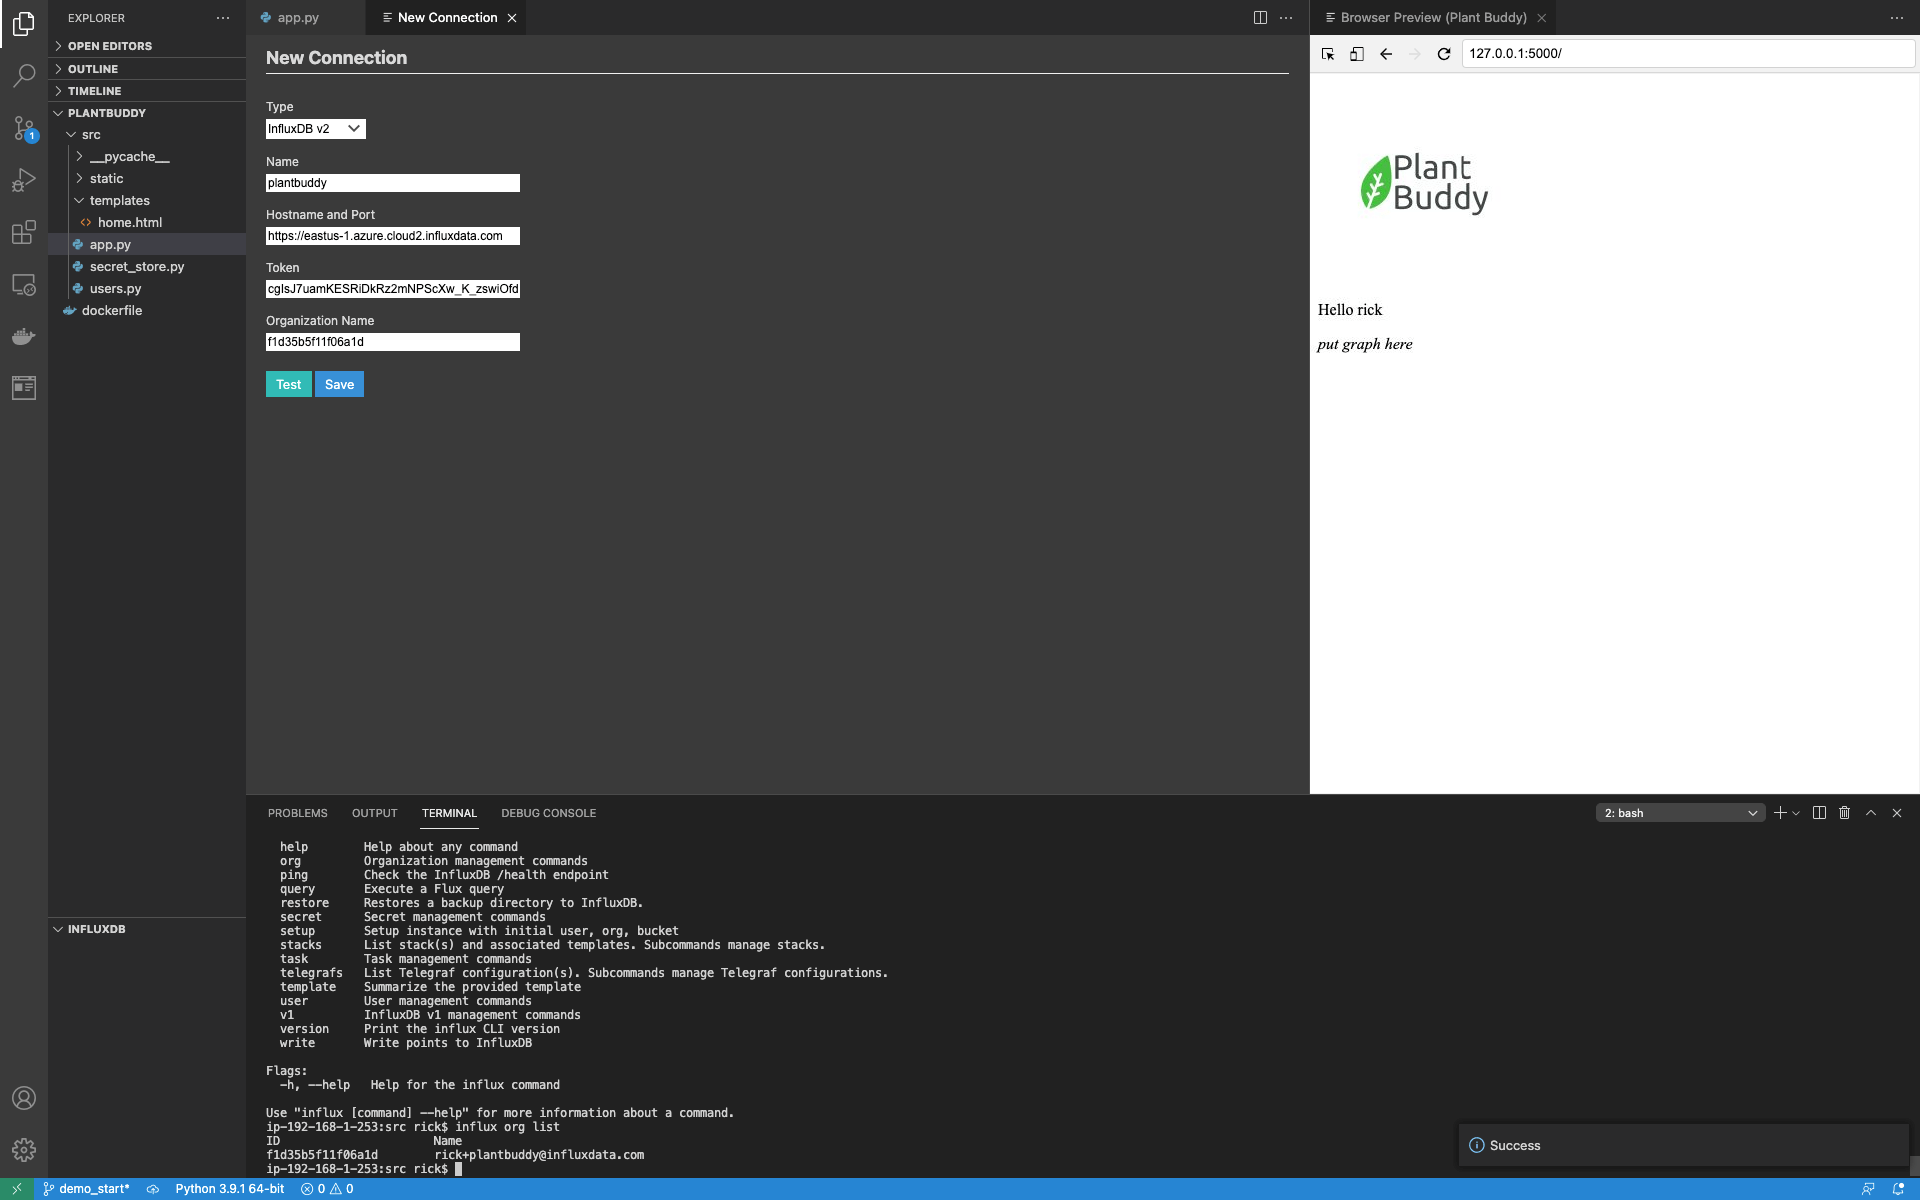
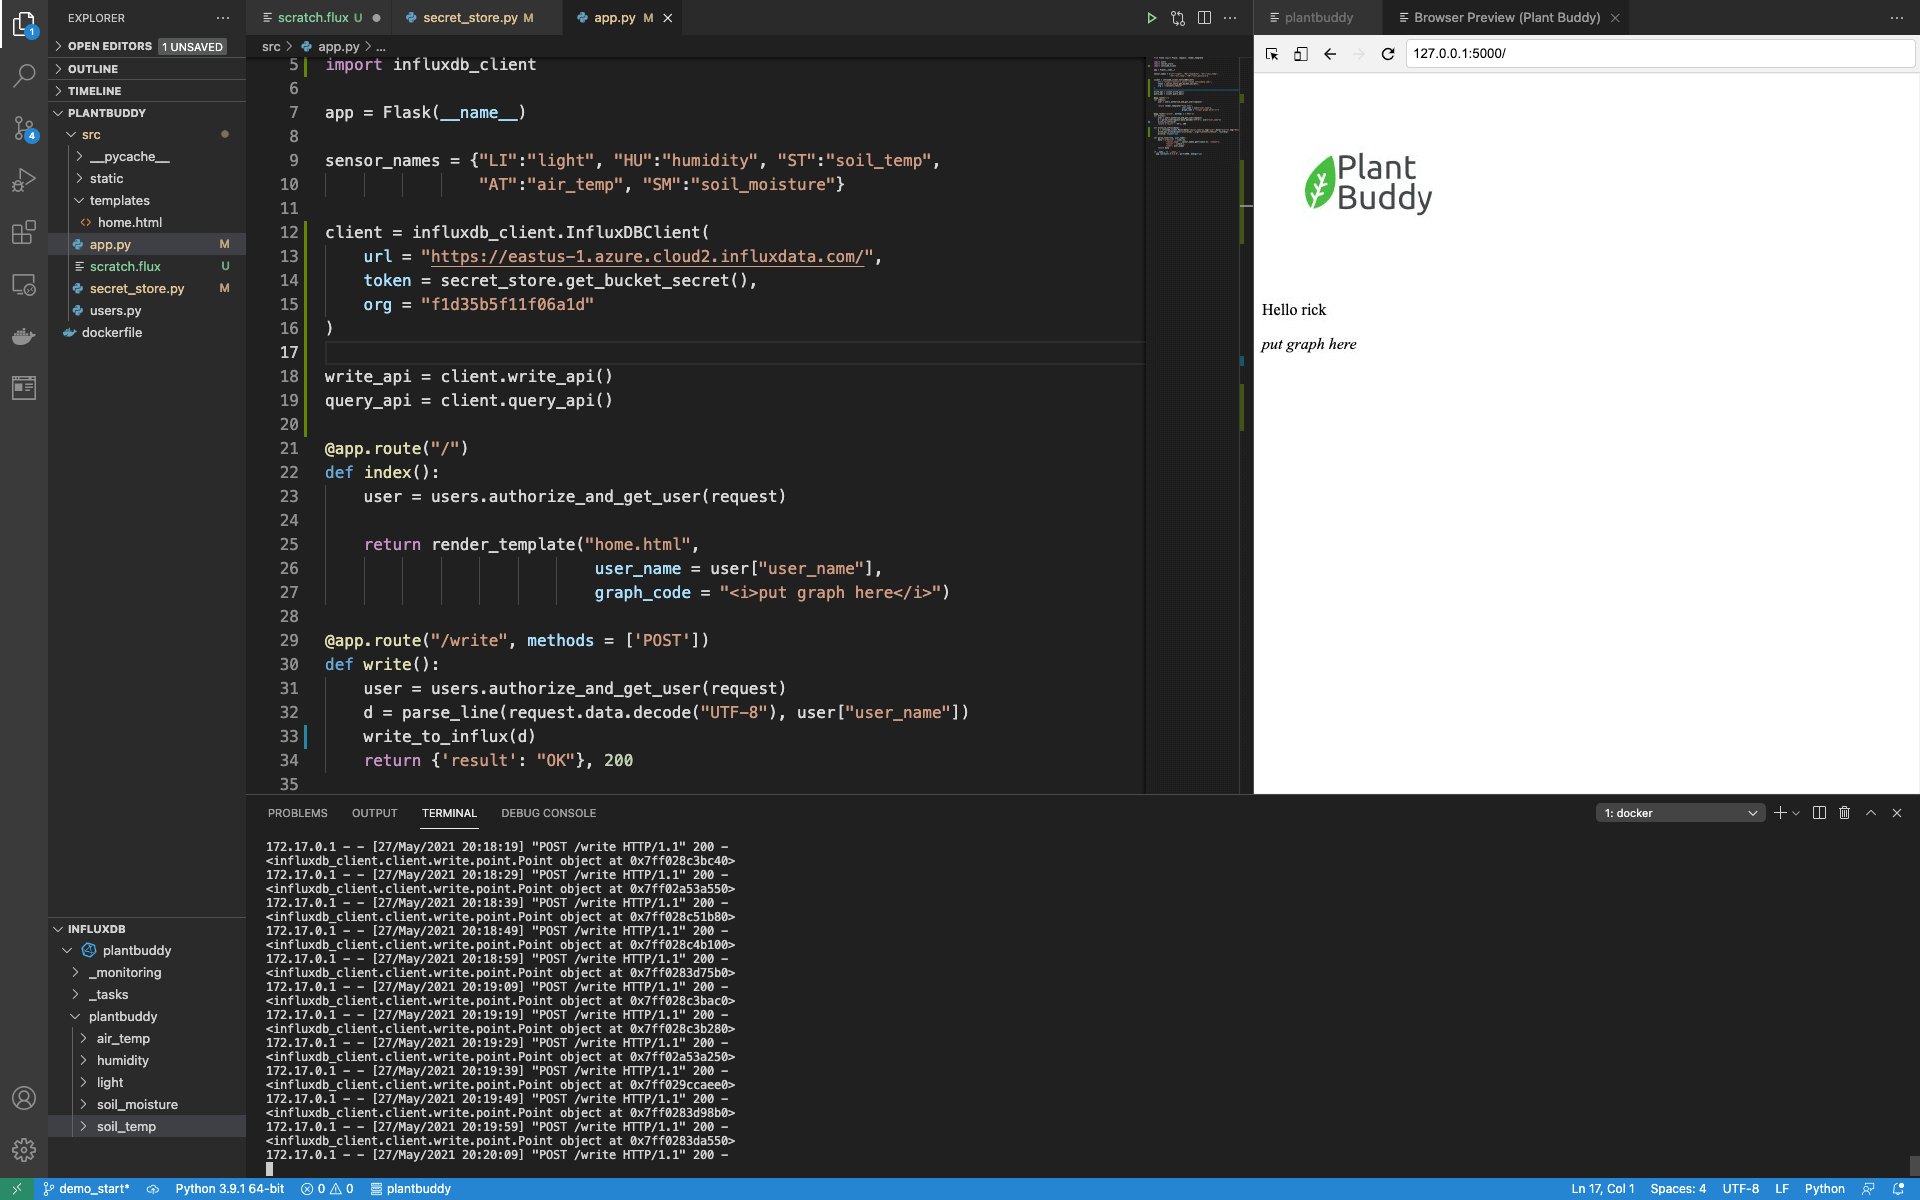
To start out, Plant Buddy is able to receive information from a user’s device, but can only parse the data that is sent and print it out. Writing to InfluxDB is not yet implemented.
@app.route("/write", methods = ['POST'])
def write():
   user = users.authorize_and_get_user(request)
   d = parse_line(request.data.decode("UTF-8"), user["user_name"])
   print(d, flush=True)
   return {'result': "OK"}, 200

def parse_line(line, user_name):
   data = {"device" : line[:2],
           "sensor_name" : sensor_names.get(line[2:4], "unknown"),
           "value" : line[4:],
           "user": user_name}
   return data
Likewise, there is an html template set up that contains a slot for rendering a graph, but so far only prints the user name extracted from the request object.
@app.route("/")
def index():
user = users.authorize_and_get_user(request)
return render_template("home.html",
user_name = user["user_name"],
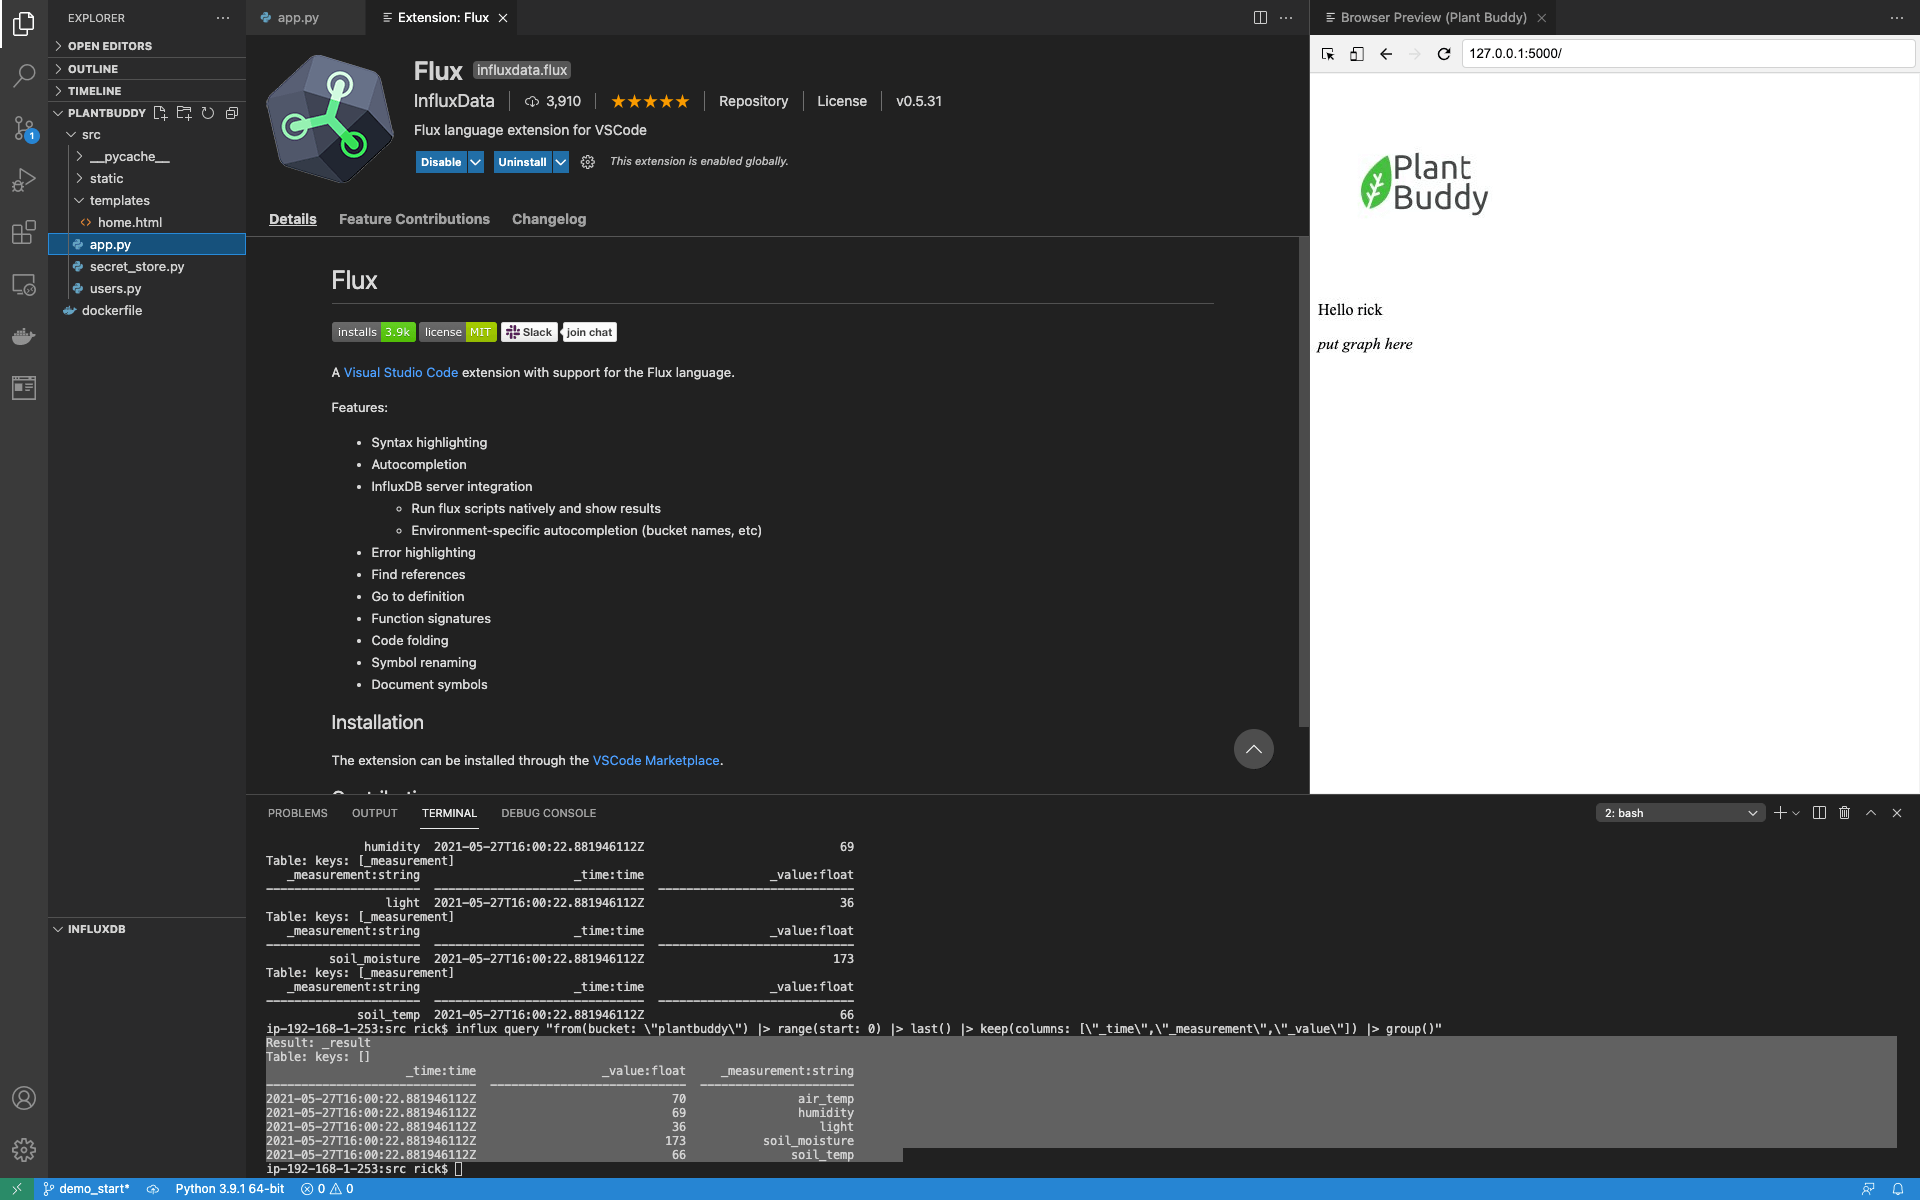
graph_code = "<i>put graph here</i>"You can see it all put together in VSCode:
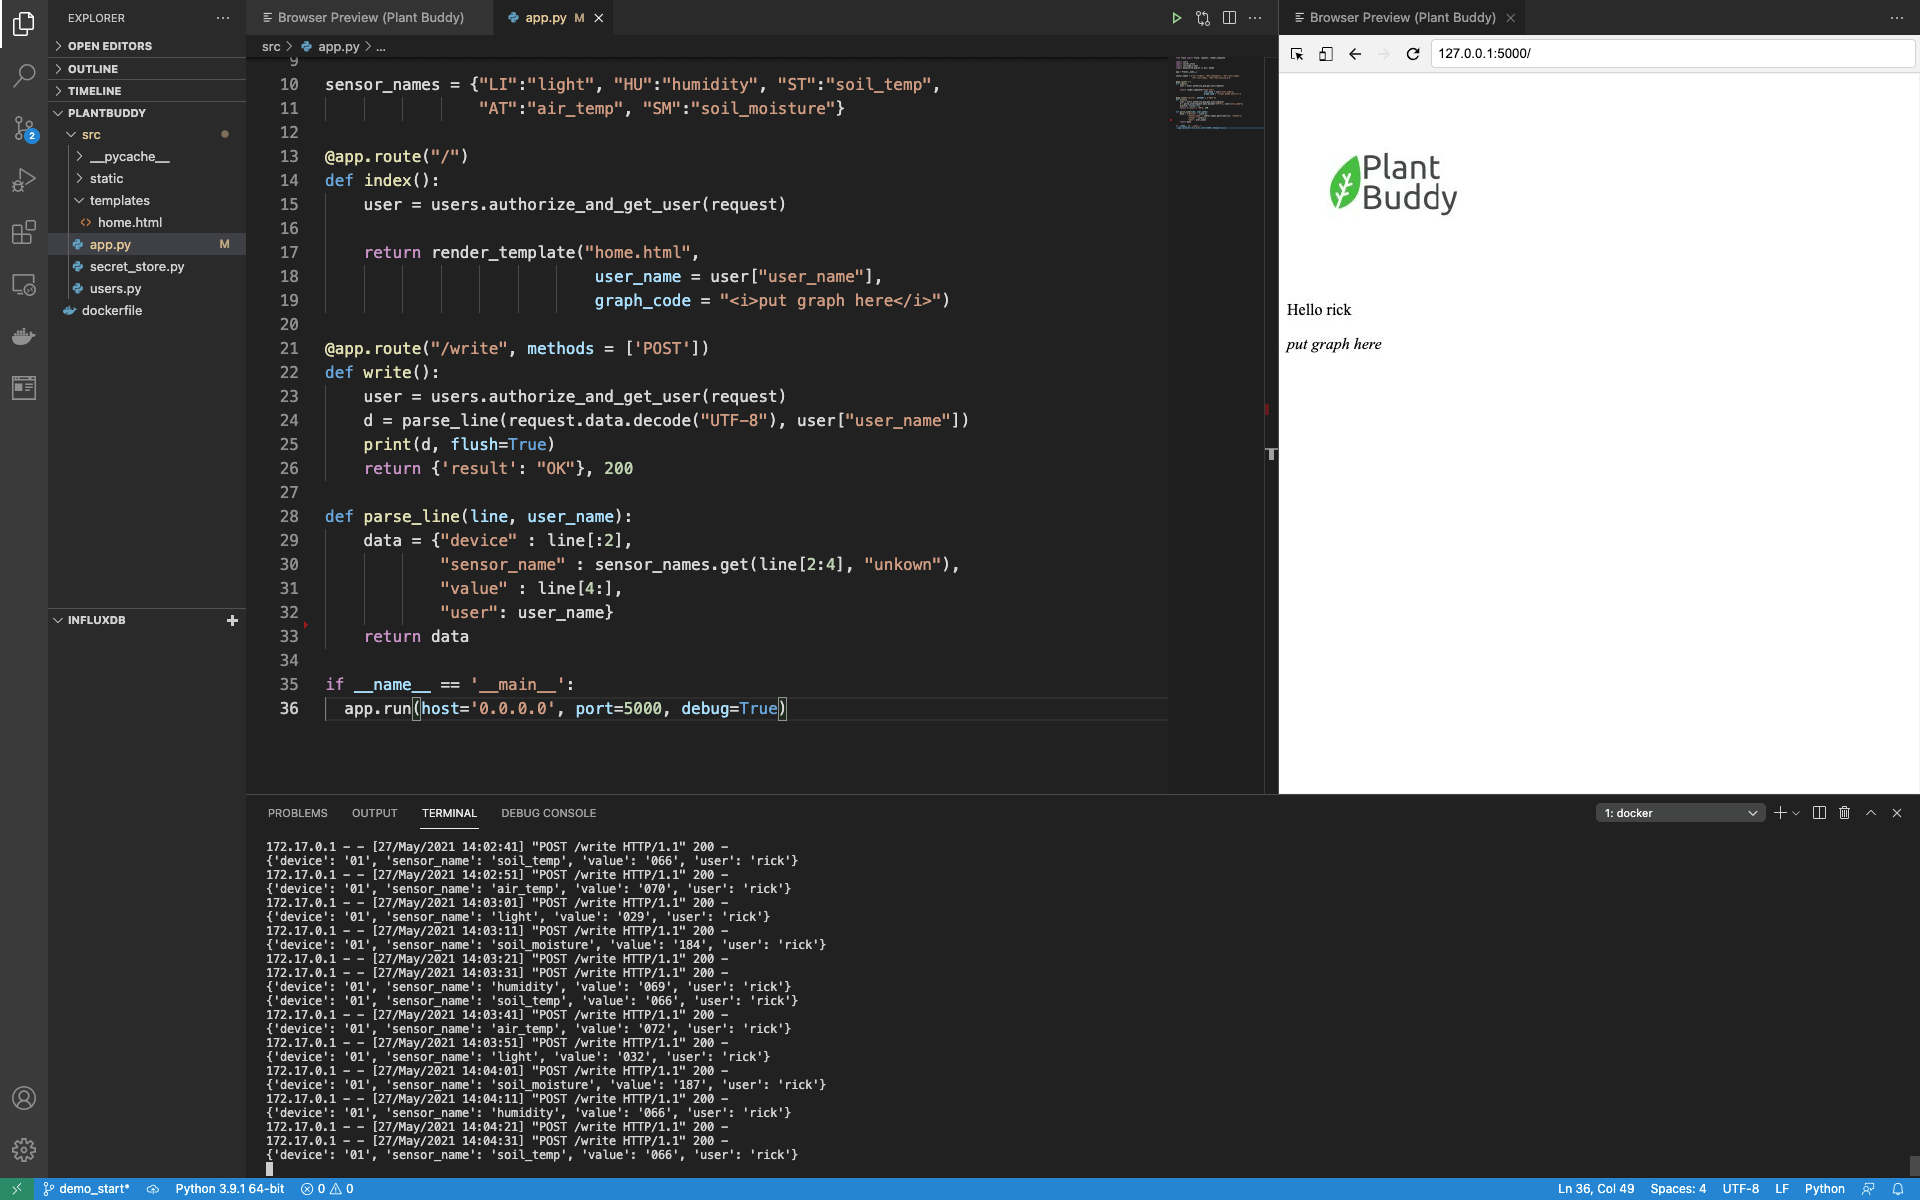
You can see the full starter code here. Essentially, the web application is set up with:
- A user's module for validating users and extracting the user name (this is fake).
- A secrets store module to securely store secrets for InfluxDB (also fake).
- An endpoint for accepting data from the Plant Buddy devices.
- An html template for the Flask server to render
- An endpoint for rendering that html template
As you can see, I am running the application on my local host, within a Docker container to simplify development.
Bootstrapping IoT application development for InfluxDB Cloud
Now that we have all of that introductory material out of the way, it’s time to get set up to use InfluxDB!
Prerequisites:
- Set up an InfluxDB Cloud account. A free account is fine.
- Set up VSCode.
- Download and install the Influx CLI.
Set up the InfluxDB CLI
I have an empty Cloud account, and I have the CLI installed on my developer laptop. It is possible to use the CLI right out of the gate, but I find it a hassle to constantly supply the information like the region I am targeting, my organization name, etc — So, it is much easier to set up a config for the CLI. In fact, you can set up numerous configs and easily switch between them, but for now, I will only need one.
The Influx CLI has a good help system, so I will just ask how to create one:
$ influx config create -h
	The influx config create command creates a new InfluxDB connection configuration
	and stores it in the configs file (by default, stored at ~/.influxdbv2/configs).

	Examples:
		# create a config and set it active
		influx config create -a -n $CFG_NAME -u $HOST_URL -t $TOKEN -o $ORG_NAME
This tells me that I will need to supply a token, the org name, the host url, as well as to name the config.
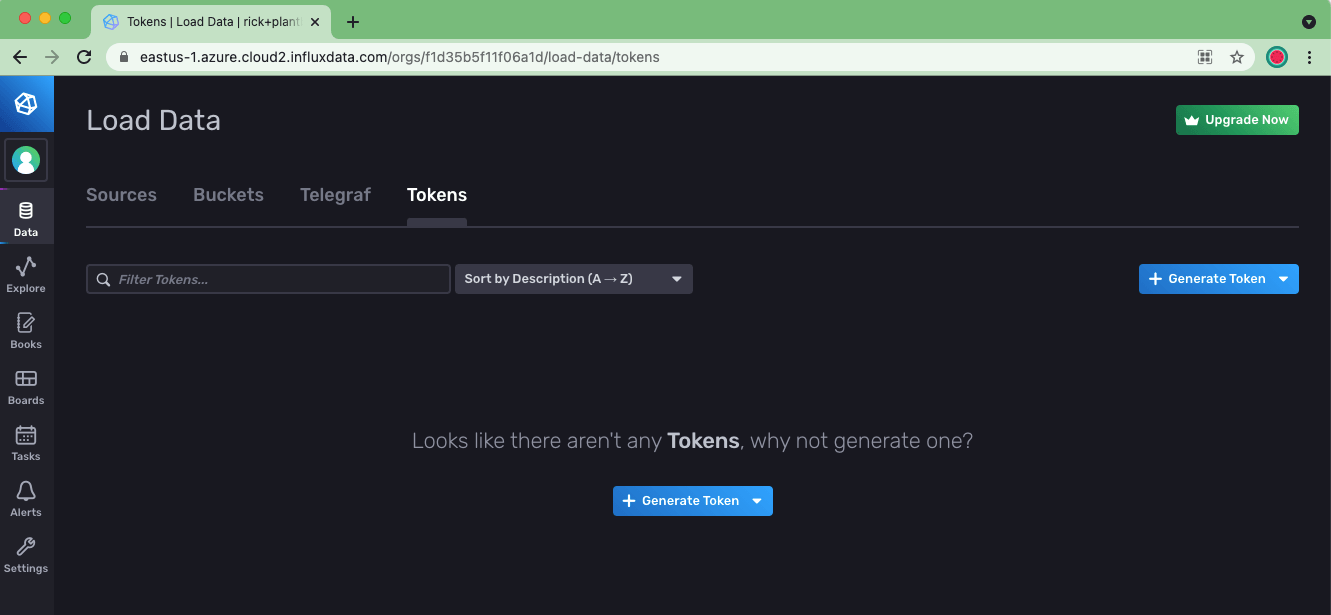
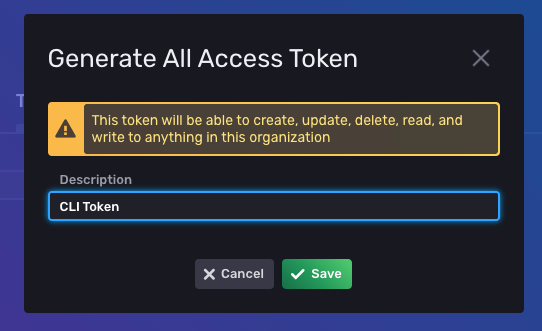
First, I will need to navigate to the InfluxDB UI to generate my first token. I do this by using the lefthand Nav in the UI to go to Data -> Tokens.
Then click Generate Token and choose an All Access Token, and provide it a name.
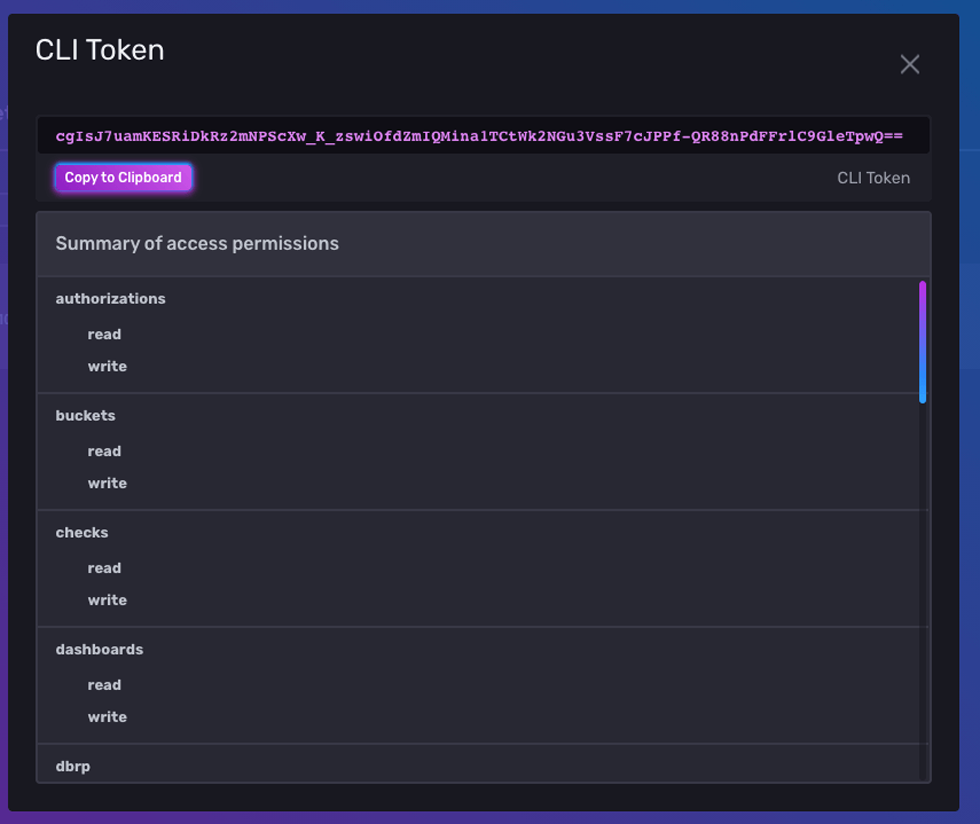
Then I can grab the token string by clicking on the token in the list:
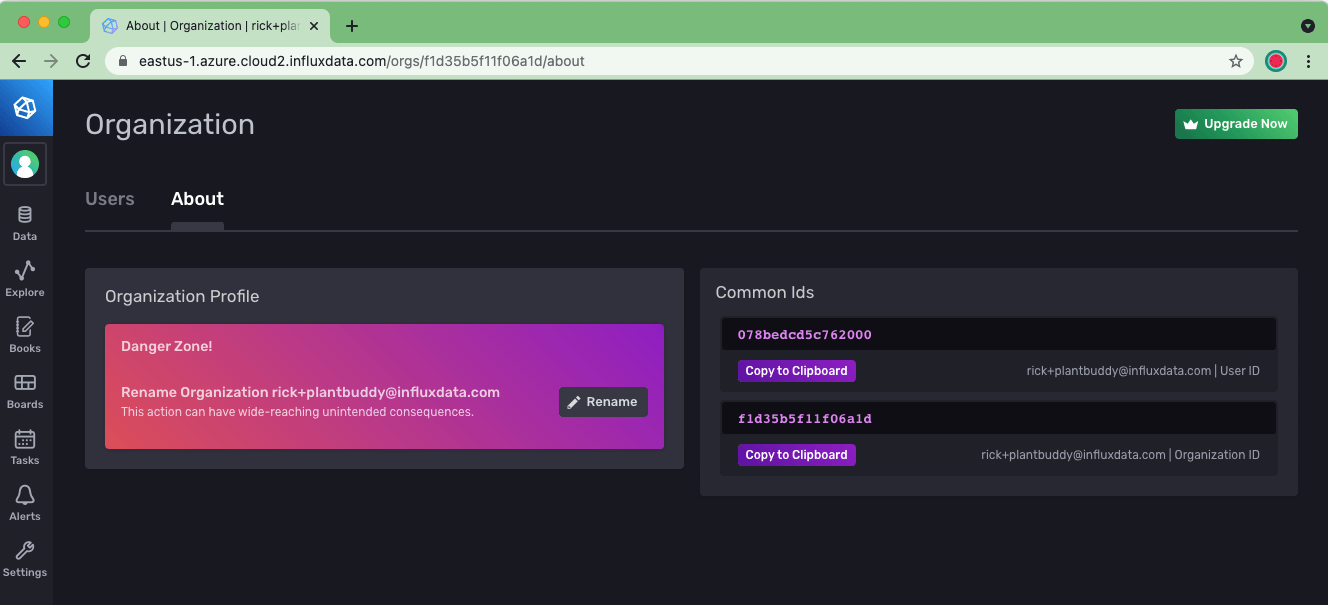
If I forgot my organization name, I can grab it from the About page.
Let’s stick it all into the CLI and create the profile:
$ influx config create -t cgIsJ7uamKESRiDkRz2mNPScXw_K_zswiOfdZmIQMina1TCtWk2NGu3VssF7cJPPf-QR88nPdFFrlC9GleTpwQ== -o [email protected] -u https://eastus-1.azure.cloud2.influxdata.com/ -n plantbuddy -aProduces the following output:
Active  Name            URL                                             Org
*       plantbuddy      https://eastus-1.azure.cloud2.influxdata.com/   [email protected]
We now have a plantbuddy CLI config created.
Create a bucket to hold users' data
Next step is to create a bucket in InfluxDB to hold the users’ data. This is done with the bucket create command:
$ influx bucket create -n plantbuddy
Which produces the following output:
ID                      Name            Retention       Shard group duration    Organization ID
f8fbced4b964c6a4        plantbuddy      720h0m0s        n/a                     f1d35b5f11f06a1d
This created a bucket for me with the default maximum retention period, the duration the bucket retains data for.
Upload some Line Protocol
Now that I have a bucket, I can upload some data to it so that I can start testing right away, rather than working on writing data from my Python code first. I generated 2 days of sample data.
The line protocol format is well-documented. But here is an excerpt:
light,user=rick,device_id=01 reading=26i 1621978469468115968
soil_moisture,user=rick,device_id=01 reading=144i 1621978469468115968
humidity,user=rick,device_id=01 reading=68i 1621978469468115968
soil_temp,user=rick,device_id=01 reading=67i 1621978469468115968
air_temp,user=rick,device_id=01 reading=72i 1621978469468115968
light,user=rick,device_id=01 reading=28i 1621978529468115968
soil_moisture,user=rick,device_id=01 reading=140i 1621978529468115968
humidity,user=rick,device_id=01 reading=65i 1621978529468115968
soil_temp,user=rick,device_id=01 reading=67i 1621978529468115968
air_temp,user=rick,device_id=01 reading=72i 1621978529468115968
This shows that I am reporting 5 measurements: light, soil_moisture, humidity, soil_temp, and air_temp. For each point, there is a user tag and a device id tag. Note that this solution will only work when users are expected to have a limited number of devices. Otherwise, the combination of tag values could end up blowing out your cardinality. The field name is “reading” which has an integer value. Using a quick and dirty Python script, I’ve generated one of these measurements per minute for the last 48 hours, so it’s a long-ish file.
$ influx write -b plantbuddy -f ~/generated.lp
No error was reported, so it looks like it worked, but let’s run a query to make sure.
Run a query
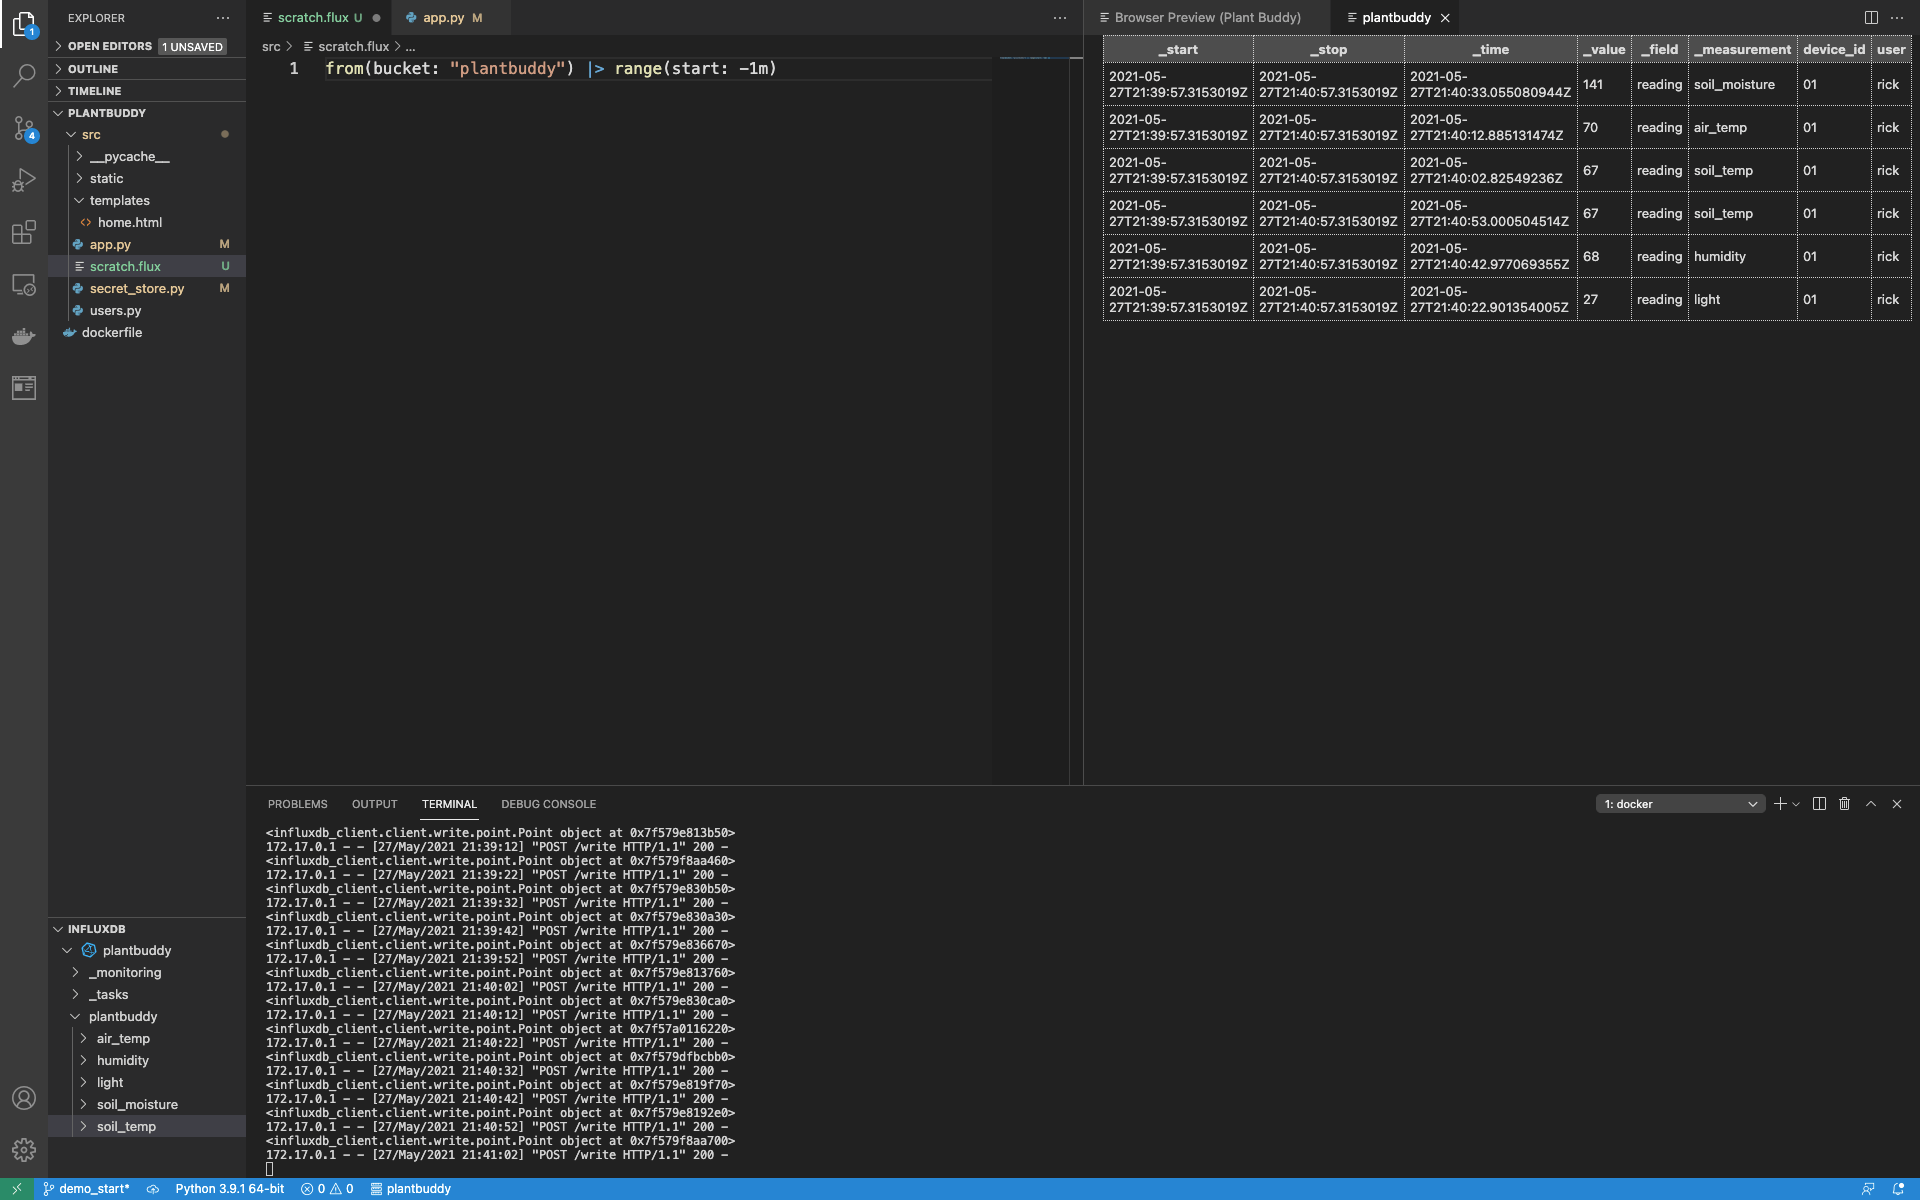
I can run a test query with the influx query command from the CLI like this:
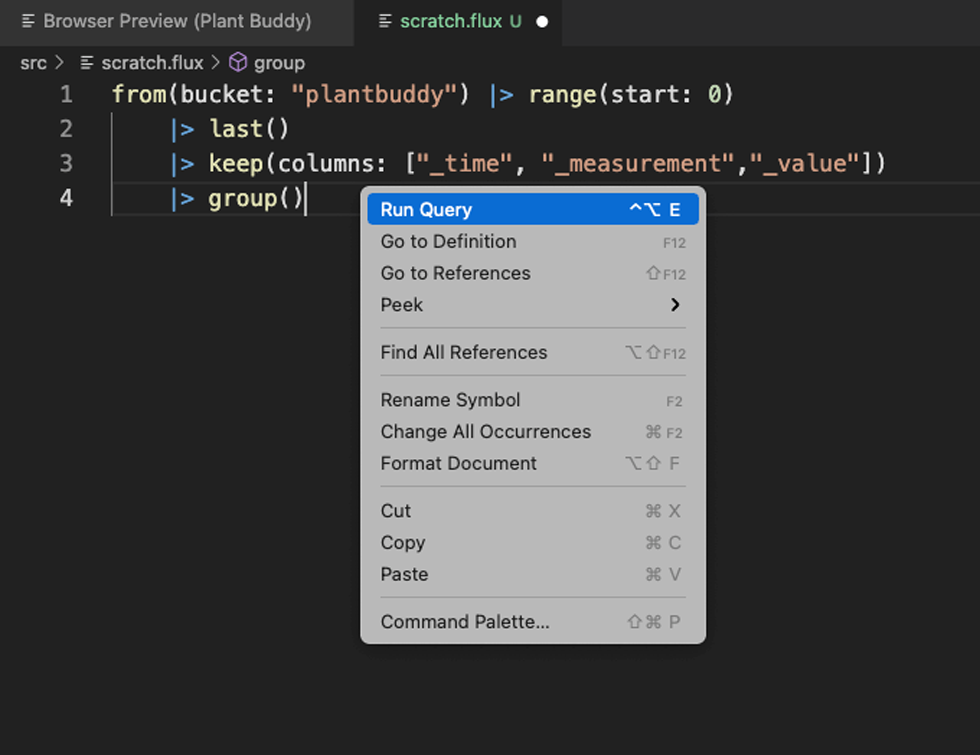
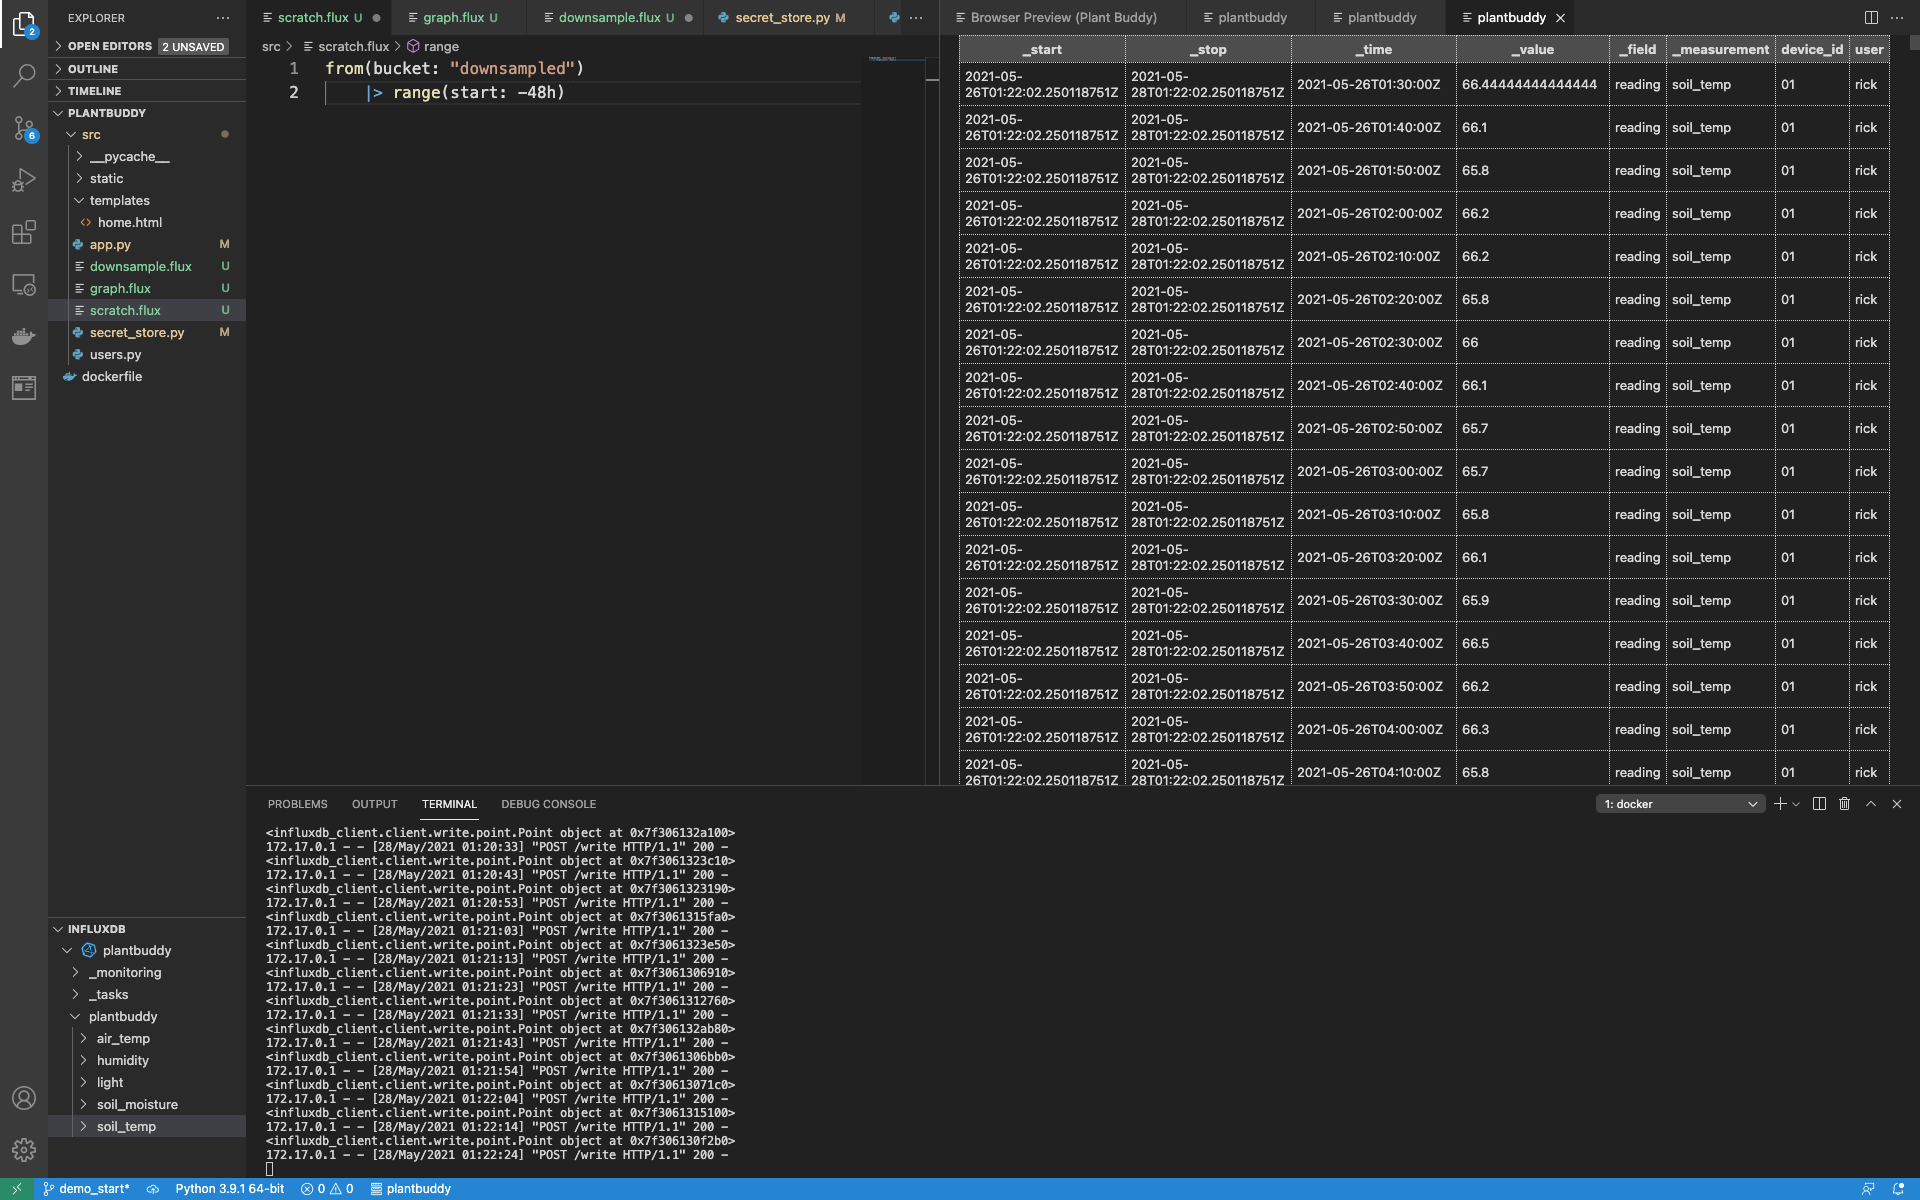
$ influx query "from(bucket: \"plantbuddy\") |> range(start: 0)This produces a lot of output, so I know that uploading the line protocol worked, but I can refine the query to get some tighter output.
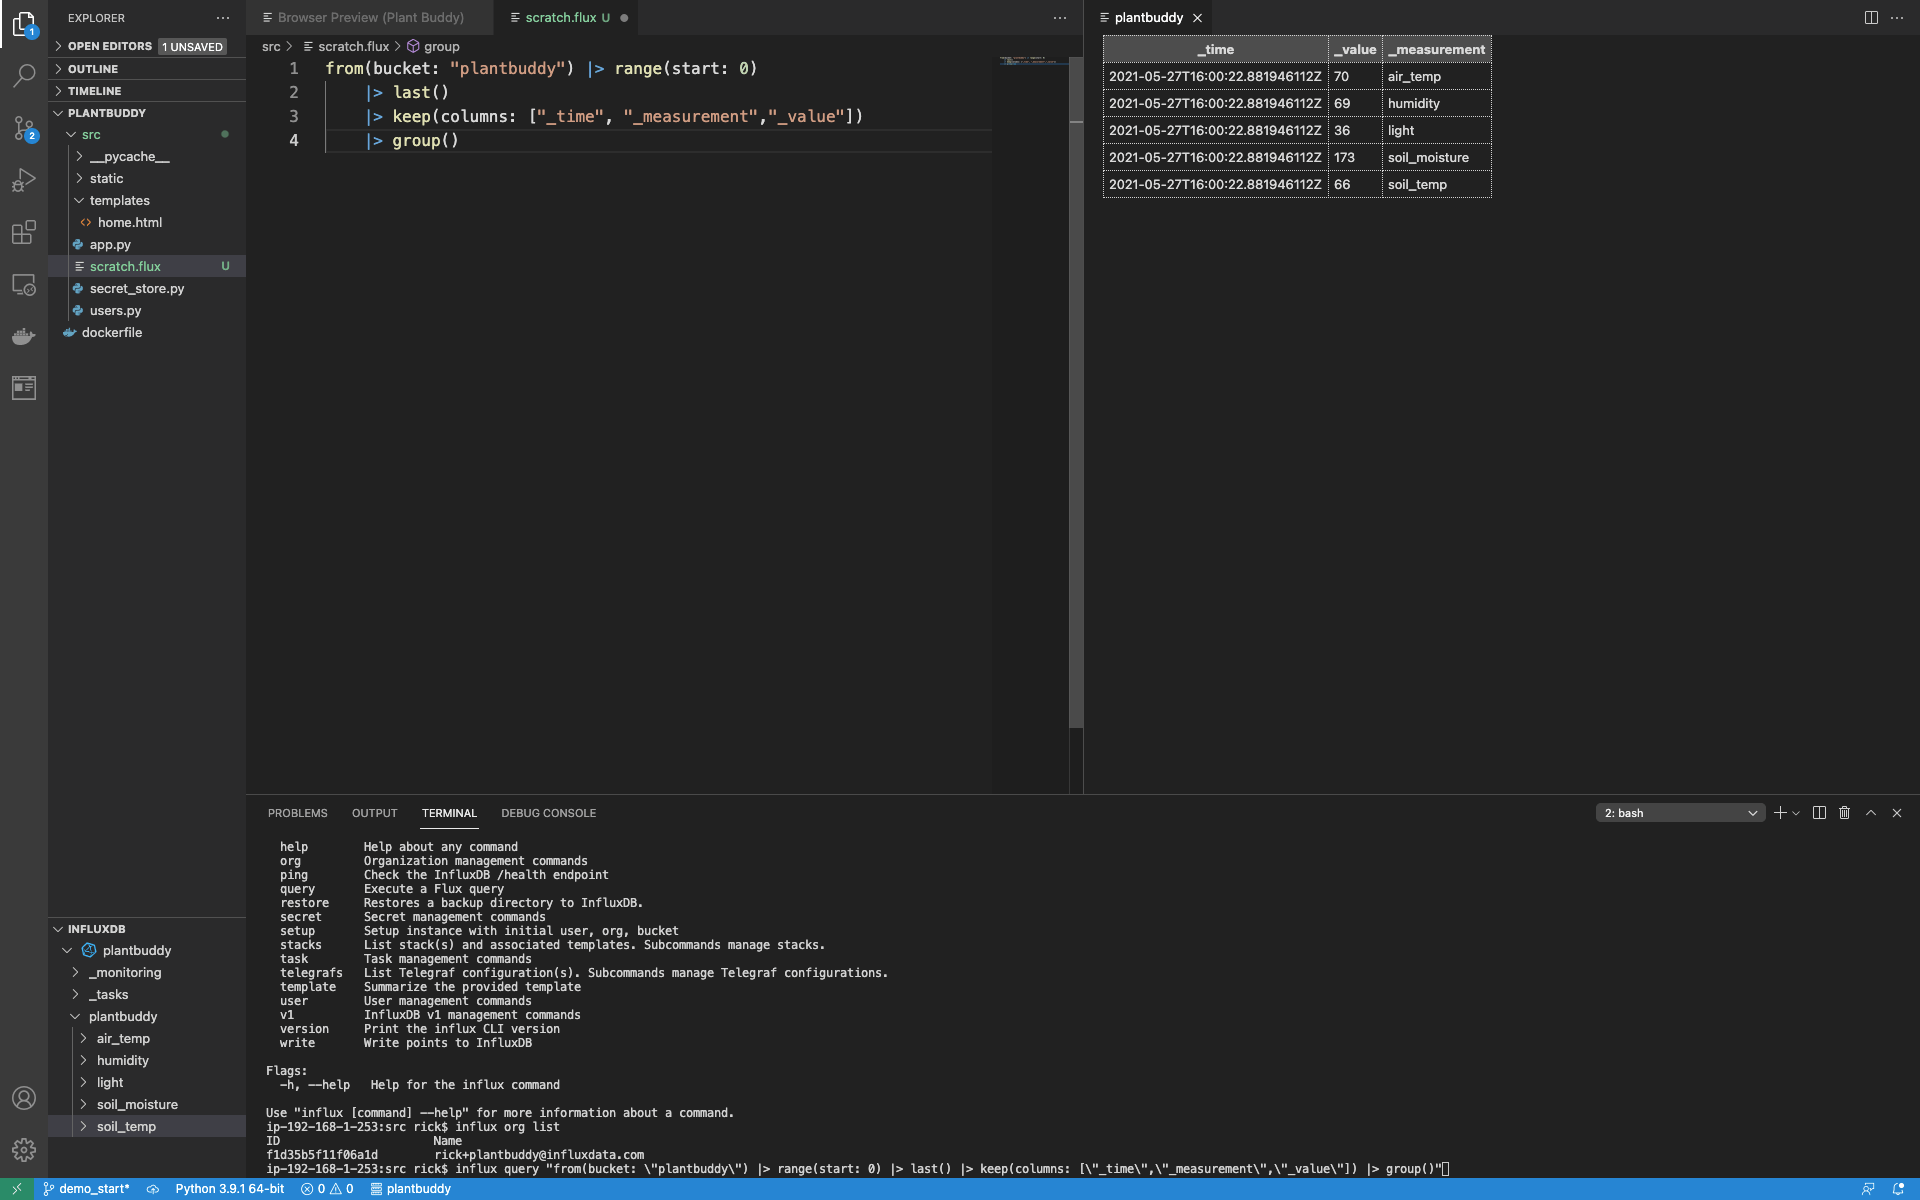
$ influx query "from(bucket: \"plantbuddy\") |> range(start: 0) |> last() |> keep(columns: [\"_time\",\"_measurement\",\"_value\"]) |> group()"This query has the following output:
Result: _result
Table: keys: []
                    _time:time                  _value:float     _measurement:string
------------------------------  ----------------------------  ----------------------
2021-05-27T16:00:22.881946112Z                            70                air_temp
2021-05-27T16:00:22.881946112Z                            69                humidity
2021-05-27T16:00:22.881946112Z                            36                   light
2021-05-27T16:00:22.881946112Z                           173           soil_moisture
2021-05-27T16:00:22.881946112Z                            66               soil_temp
So, I already have data and can start exploring it with queries, but iterating on a query via the CLI is not particularly easy. So, let’s install and set up the InfluxDB VSCode plugin.
Set up VSCode and the Flux extension for InfluxDB Cloud
As a VSCode user, I naturally would like to use their editor when writing my Flux queries, as well keep my whole project under source control. So, the next step is to set up the InfluxDB VSCode Extension. The Flux extension is easy to find by searching for “Influx” in the extension manager.
After installing the extension, you can see an InfluxDB window added to the bottom left.
Now I can use that window to set up a connection with my Cloud account by giving focus to the InfluxDB window and clicking the + button.
If I forgot any information that I need to configure the Flux extension, I can use the influx config command to my credentials:
$ influx config
Active  Name            URL                                             Org
*       plantbuddy      https://eastus-1.azure.cloud2.influxdata.com/   [email protected]
I can find my token strings with the influx auth list command like this:
$ influx auth list
Because my org name has some special characters, I need to provide my organization id instead of my org name. I can find the org id with the influx org list command like this:
$ influx org list
ID                      Name
f1d35b5f11f06a1d        [email protected]
And then complete the form.
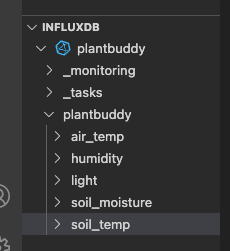
Using the Test button, I can see that the connection worked, and then save it. After I save, notice that the InfluxDB window is now populated, and I can browse the measurements.
Query InfluxDB Cloud from the Code Editor
Now that the connection is set up, I typically add a scratch Flux file to the project to run Flux queries with.
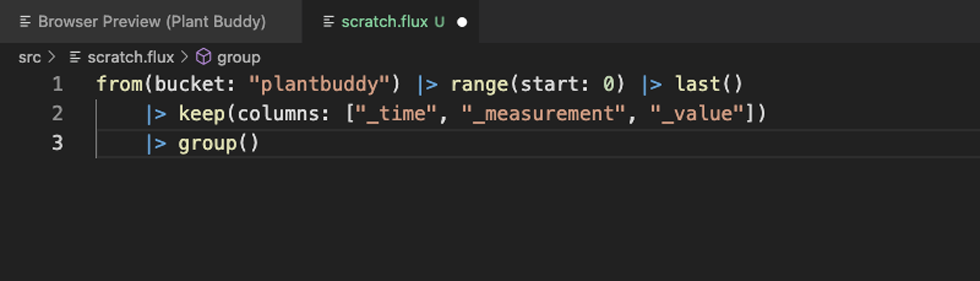
The first thing to notice is that formatting works. The Flux extension also includes statement completion and in situ help as you would expect.
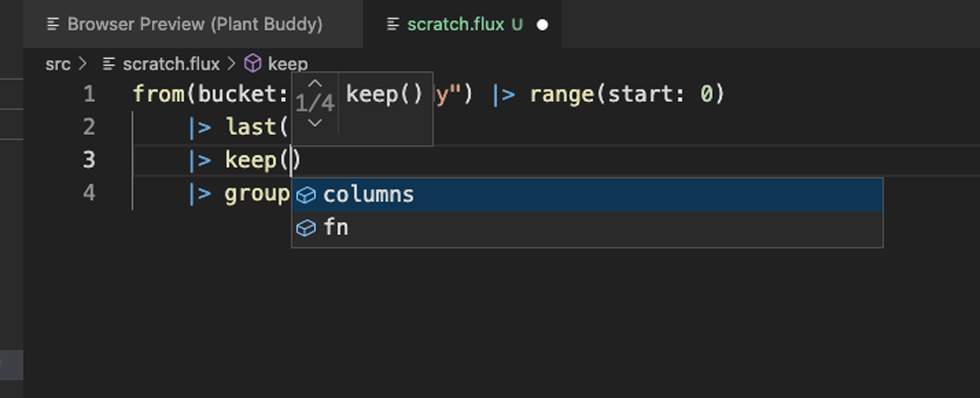
Then I can try to run the query directly from the editor.
This provides my results in a clean grid view, which is easier to use than results dumped to the terminal.
Note that information about the extension is written to the Flux language tab of the OUTPUT window. This is especially useful if your Flux has errors.
Now that I have my development environment set up for InfluxDB, let’s implement the backend.
Implement writes
Now it’s back to writing some Python to make the web app work. First I am going to handle the calls to the /write endpoint by converting those calls to actually put the data into InfluxDB.
- I already have a bucket called "plantbuddy" created for this.
- Next I will create a new token that has permission to read and write to that bucket.
- Then I will import the InfluxDB v2 Python client library.
- Then I will create Points and write them with the client library.
Create a token
First, I will need a token that has permissions to write and read from the bucket. You can see from the influx auth create help, that there are a lot of options for controlling the permissions for a token.
k$ influx auth create -h
Create authorization

Usage:
  influx auth create [flags]

Flags:
  -c, --active-config string          Config name to use for command; Maps to env var $INFLUX_ACTIVE_CONFIG
      --configs-path string           Path to the influx CLI configurations; Maps to env var $INFLUX_CONFIGS_PATH (default "/Users/rick/.influxdbv2/configs")
  -d, --description string            Token description
  -h, --help                          Help for the create command
      --hide-headers                  Hide the table headers; defaults false; Maps to env var $INFLUX_HIDE_HEADERS
      --host string                   HTTP address of InfluxDB; Maps to env var $INFLUX_HOST
      --json                          Output data as json; defaults false; Maps to env var $INFLUX_OUTPUT_JSON
  -o, --org string                    The name of the organization; Maps to env var $INFLUX_ORG
      --org-id string                 The ID of the organization; Maps to env var $INFLUX_ORG_ID
      --read-bucket stringArray       The bucket id
      --read-buckets                  Grants the permission to perform read actions against organization buckets
      --read-checks                   Grants the permission to read checks
      --read-dashboards               Grants the permission to read dashboards
      --read-dbrps                    Grants the permission to read database retention policy mappings
      --read-notificationEndpoints    Grants the permission to read notificationEndpoints
      --read-notificationRules        Grants the permission to read notificationRules
      --read-orgs                     Grants the permission to read organizations
      --read-tasks                    Grants the permission to read tasks
      --read-telegrafs                Grants the permission to read telegraf configs
      --read-user                     Grants the permission to perform read actions against organization users
      --skip-verify                   Skip TLS certificate chain and host name verification.
  -t, --token string                  Authentication token; Maps to env var $INFLUX_TOKEN
  -u, --user string                   The user name
      --write-bucket stringArray      The bucket id
      --write-buckets                 Grants the permission to perform mutative actions against organization buckets
      --write-checks                  Grants the permission to create checks
      --write-dashboards              Grants the permission to create dashboards
      --write-dbrps                   Grants the permission to create database retention policy mappings
      --write-notificationEndpoints   Grants the permission to create notificationEndpoints
      --write-notificationRules       Grants the permission to create notificationRules
      --write-orgs                    Grants the permission to create organizations
      --write-tasks                   Grants the permission to create tasks
      --write-telegrafs               Grants the permission to create telegraf configs
      --write-user                    Grants the permission to perform mutative actions against organization users
--write-bucket and --read-bucket are the options I am looking for. These options take the bucket id rather than the bucket name. The id is easy to find with the influx bucket list command:
$ influx bucket list
ID                      Name            Retention       Shard group duration    Organization ID
d6ec11a304c652aa        _monitoring     168h0m0s        n/a                     f1d35b5f11f06a1d
fe25b83e9e002181        _tasks          72h0m0s         n/a                     f1d35b5f11f06a1d
f8fbced4b964c6a4        plantbuddy      720h0m0s        n/a                     f1d35b5f11f06a1d
Then I can create the token with the influx auth create command like this:
$ influx auth create --write-bucket f8fbced4b964c6a4 --read-bucket f8fbced4b964c6a4The output includes the token string which I can then register with my app server’s secrets store.
ID                      Description     Token                                                                                           User Name                       User ID                 Permissions
0797c045bc99e000                        d0QnHz8bTrQU2XI798YKQzmMQY36HuDPRWiCwi8Lppo1U4Ej5IKhCC-rTgeRBs3MgWsomr-YXBbDO3o4BLJe9g==        [email protected]  078bedcd5c762000        [read:orgs/f1d35b5f11f06a1d/buckets/f8fbced4b964c6a4 write:orgs/f1d35b5f11f06a1d/buckets/f8fbced4b964c6a4]
Import and set up the InfluxDB Python Library
After installing the InfluxDB Python Client in your environment, the next steps are to:
- Import the library.
- Set up the client.
- Create the write and query APIs.
import influxdb_client

client = influxdb_client.InfluxDBClient(
   url = "https://eastus-1.azure.cloud2.influxdata.com/",
   token = secret_store.get_bucket_secret(),
   org = "f1d35b5f11f06a1d"
)

write_api = client.write_api()
query_api = client.query_api()
I added this code at the top of my code file so I can use the write and query APIs easily throughout the module.
Create and write Points
Now that I have the client library and the related API’s set up, I can change my code from simply printing out the data that the user is uploading to actually saving it. The first part is to create a Point, which is an Object that represents the data I want to write.
I’ll do this by creating a new function “write_to_influx”:
def write_to_influx(data):
   p = influxdb_client.Point(data["sensor_name"]).tag("user",data["user"]).tag("device_id",data["device"]).field("reading", int(data["value"]))
   write_api.write(bucket="plantbuddy", org="f1d35b5f11f06a1d", record=p)
   print(p, flush=True)
The method receives a Python dictionary, and extracts the values to use for tags and the field. You can include multiple tags and fields in a Point, but Plant Buddy only uses a single field, “reading.” It also prints out the point at the end of the function, mostly so it is possible to see it working.
Now I can update my write endpoint to use that function:
@app.route("/write", methods = ['POST'])
def write():
   user = users.authorize_and_get_user(request)
   d = parse_line(request.data.decode("UTF-8"), user["user_name"])
   write_to_influx(d)
   return {'result': "OK"}, 200
I happen to have a Plant Buddy already writing points to the server, and it looks like it is working.
By running a simple query, I can confirm that the data is being loaded into my bucket.
Implement reads
The Plant Buddy webpage will be very simple to start. It will display a graph with the last 48 hours of Plant Buddy data. To make this work, I need to:
- Write a query that fetches the data
- Use the InfluxDB v2 Python client library to fetch the data
- Create a graph
- Loop through the results and add them to the graph
- Display the graph in the web page
Write the query
This is a simple query to write.
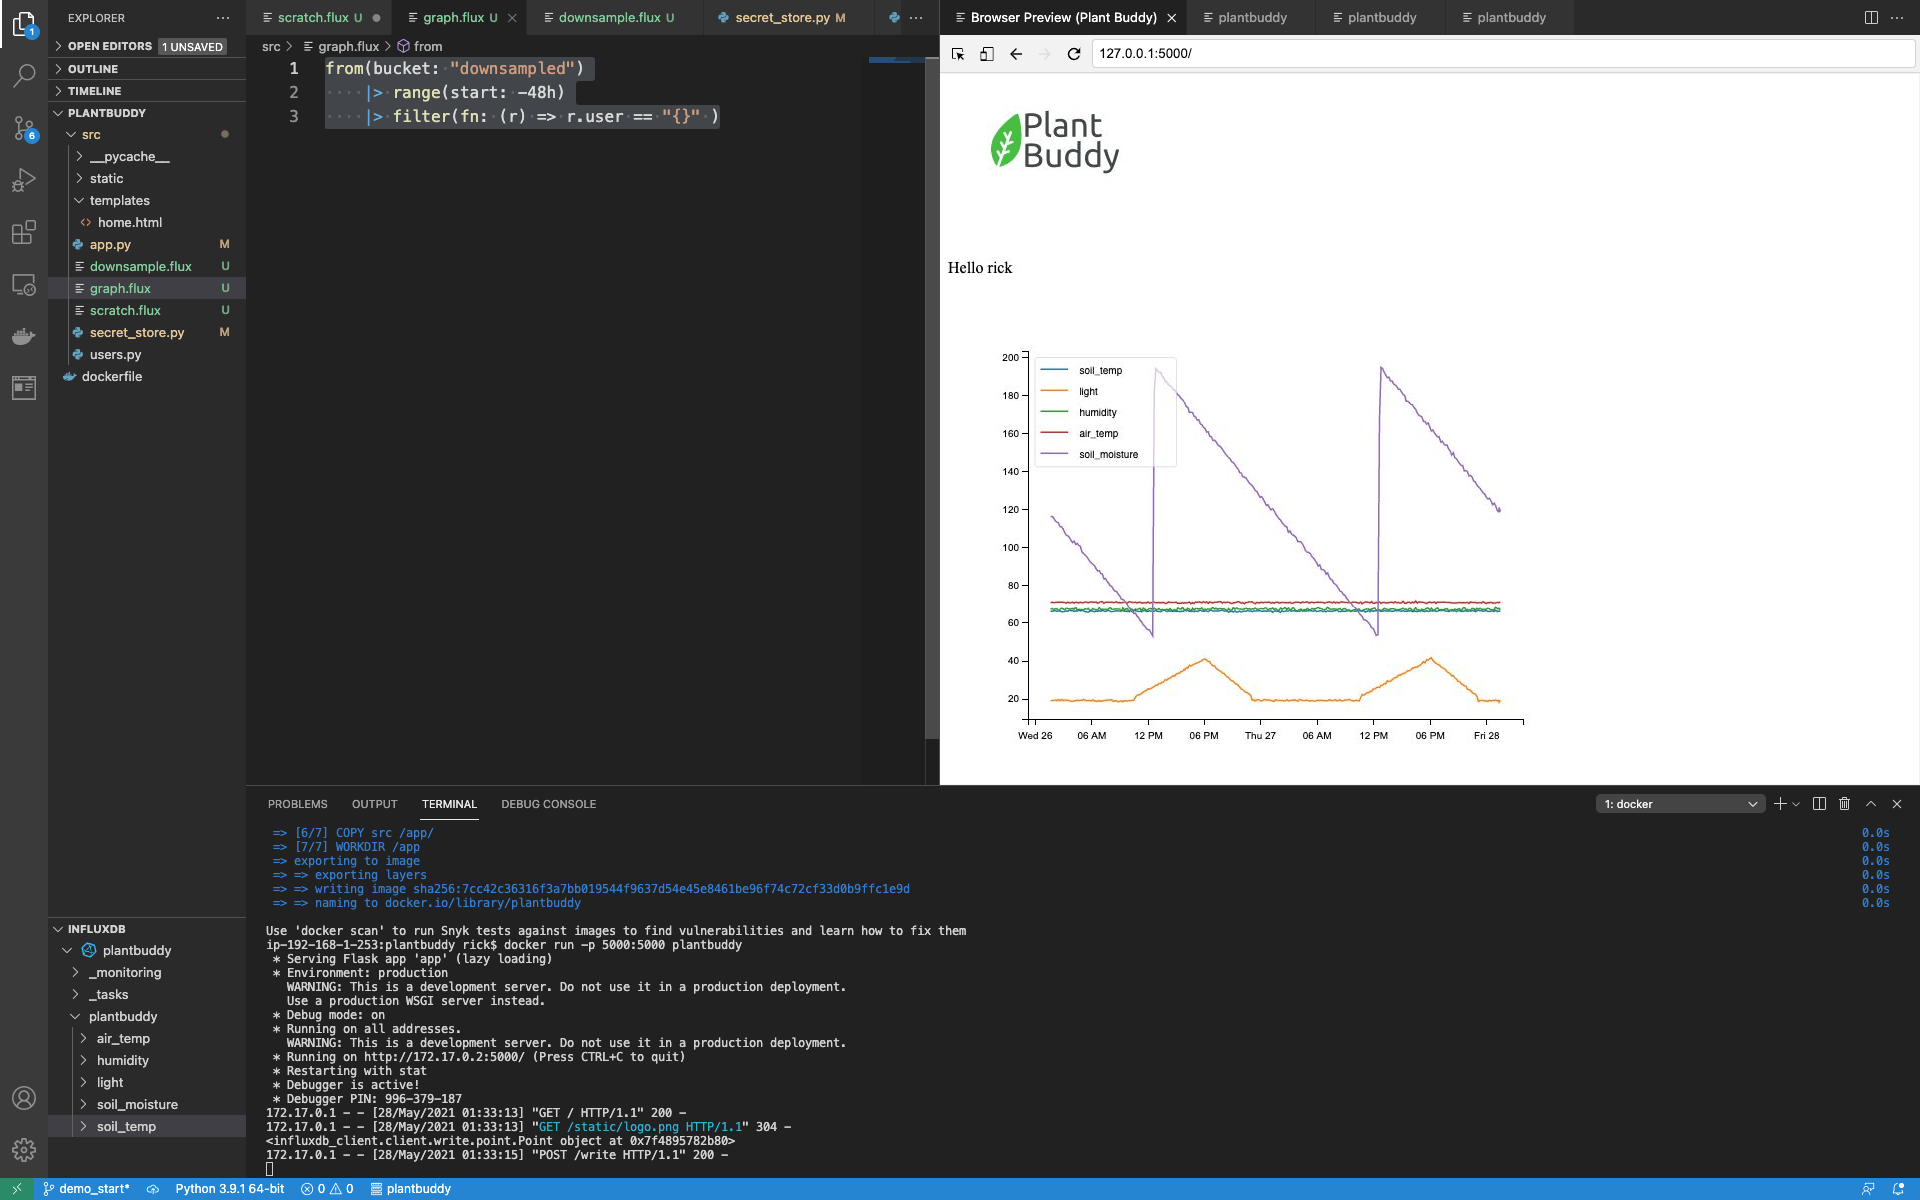
from(bucket: "plantbuddy")
   |> range(start: -48h)
   |> filter(fn: (r) => r.user == "rick")
This brings back a lot of data. What is important to understand is that the data comes back organized by time series. A time series is organized first by measurements, and then further broken down by tag values and fields. Each time series is then essentially a separate table of related data ordered by timestamp. Perfect for graphing, each time series table is a line in a graph.
However, I won’t know the user name at run time, so I need to parameterize the query. I am going to use simple string replacement for this. So, I just need to tweak the query a bit:
from(bucket: "plantbuddy")
   |> range(start: -48h)
   |> filter(fn: (r) => r.user == "{}")
Additionally, I am going to want to read this query at run time, so I added a file called “graph.flux” and saved the query in that file.
Now that I have the query ready, I can use it to fetch the data.
Fetch the data from InfluxDB
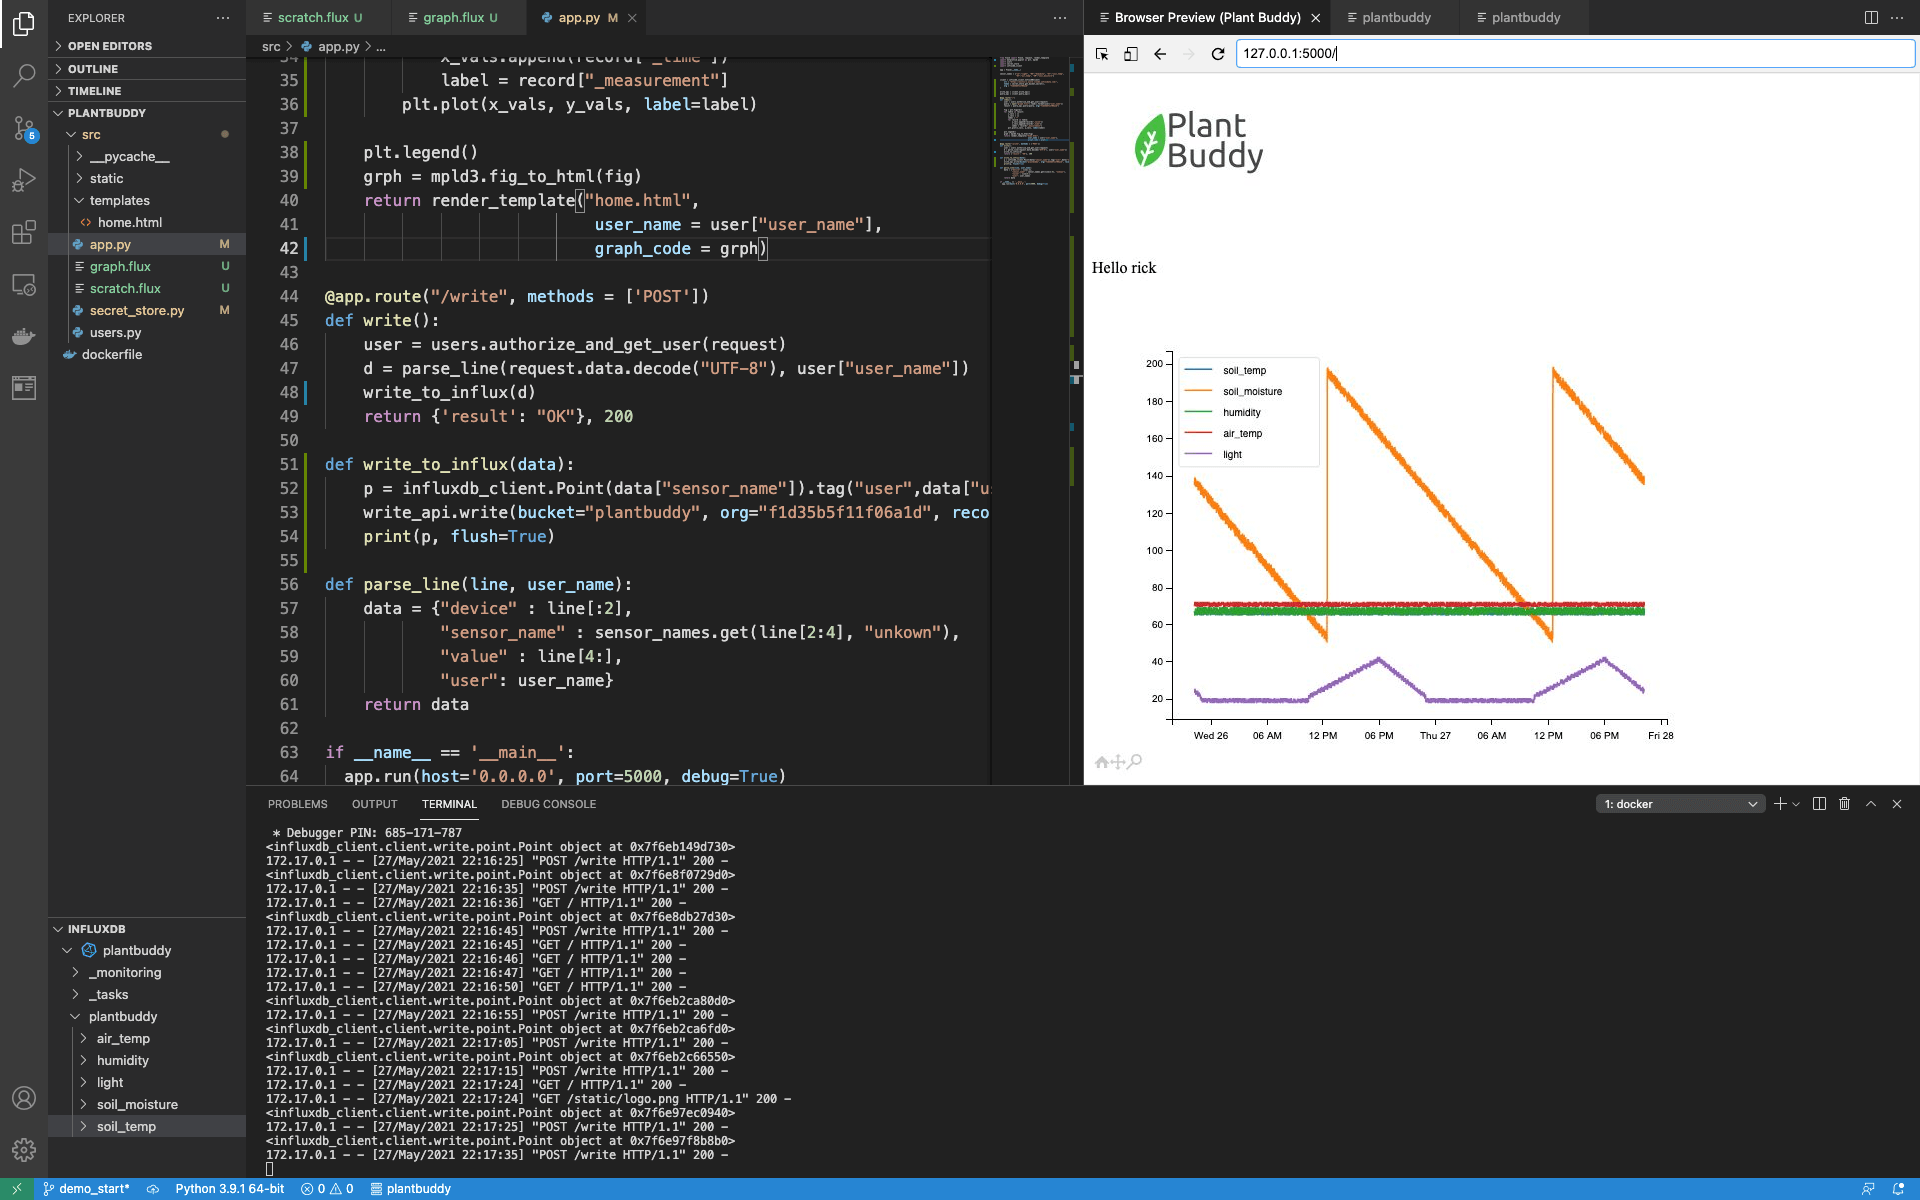
In my index() function in app.py, I start by opening the Flux file, replacing the user name, and then using the query api that I previously instantiated to get back a results set, adding this to my index() function:
query = open("graph.flux").read().format(user["user_name"])
   result = query_api.query(query, org="f1d35b5f11f06a1d")
Visualize time series with mpld3 and InfluxDB Cloud
For Plant Buddy, I have selected the mpld3 library to create my graphs. I chose this library because it is very easy to use.
After adding the mpld3 library and its dependencies to my environment, I need to import a couple of things:
import matplotlib.pyplot as plt, mpld3
Now I can go ahead and build the graph with the results. To do this, for each measurement (light, humidity, etc.) I need to create a list of values for the x-axis, and a list of values for the y-axis. Of course, the x-axis will be time.
As mentioned above, the Flux data model returns data in a perfect format for this application. It returns a table for each measurement, so I simply have to loop through the tables, then loop through each record in each table, build the lists, and ask matplotlib to plot them.
fig = plt.figure()
   for table in result:
       x_vals = []
       y_vals = []
       label = ""
       for record in table:
           y_vals.append(record["_value"])
           x_vals.append(record["_time"])
           label = record["_measurement"]
       plt.plot(x_vals, y_vals, label=label)
Then I finish off by requesting a legend, converting the graph to html, and passing it to the template to be rendered.
plt.legend()
   grph = mpld3.fig_to_html(fig)
   return render_template("home.html",
                           user_name = user["user_name"],
                           graph_code = grph)
And now, when I load the index page, you can see that the graph is working.
Aggregation and downsampling
Aggregation
One thing to note is that it takes matplotlib a fair amount of time to create the graph, and a fair amount of time for the mpld3 to convert it to html. But users don’t really need every point graphed. Therefore, we can speed up the UI by adding a bit of aggregation to the Flux query. Rather than retrieving every point, let’s retrieve just the average for every 10 minutes. I just add an aggregation to the query with the aggregateWindow() function:
from(bucket: "plantbuddy")
   |> range(start: -48h)
   |> filter(fn: (r) => r.user == "rick")
   |> aggregateWindow(every: 10m, fn: mean)
The page loads much faster now, and also the graph looks a bit nicer.
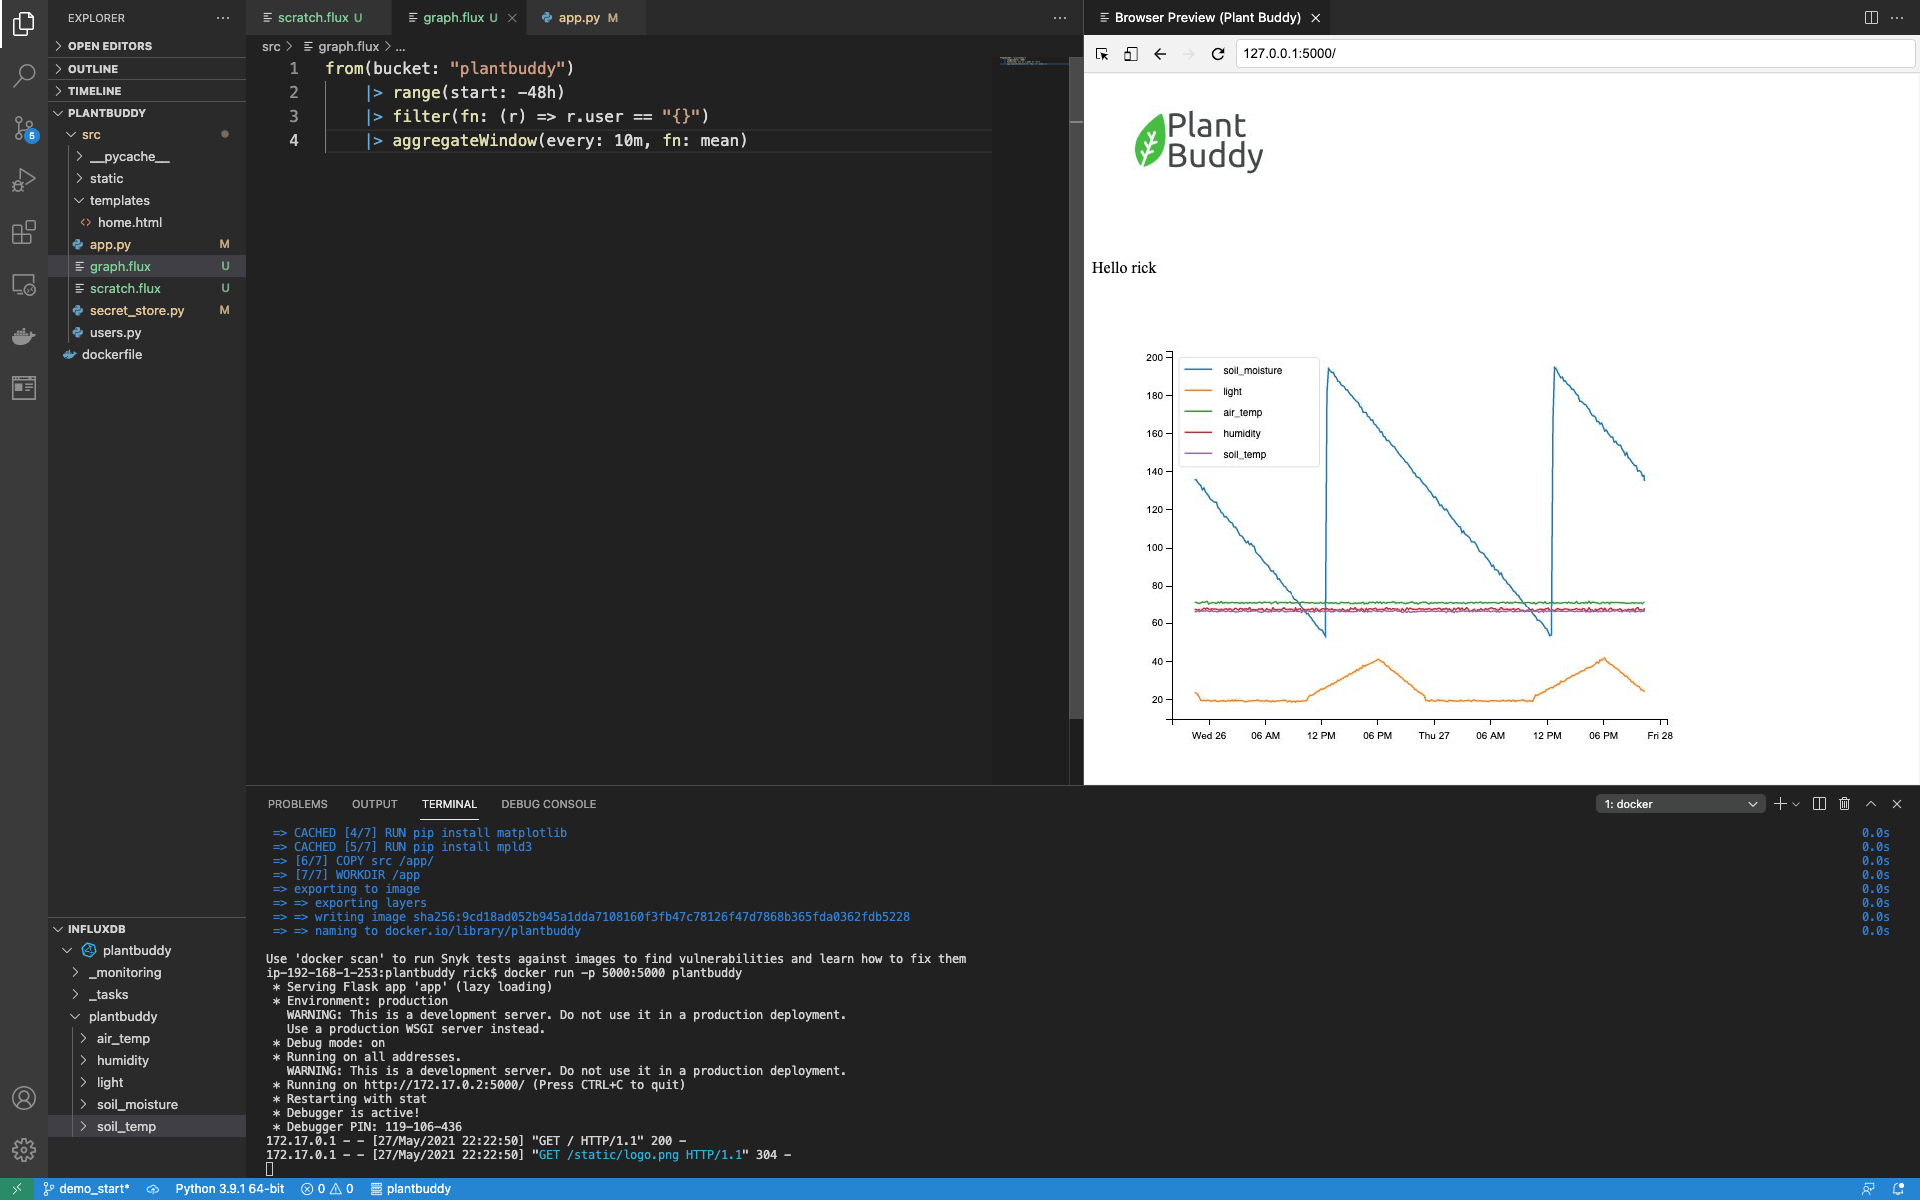
Realistically, for such a simple query and data set, such a query will perform more than adequately for production use cases. However, we can demonstrate how to optimize UI latency further by downsampling.
Downsampling
Downsampling entails calculating lower-resolution data to display from the high-resolution data, and saving that off pre-computed for displaying or further calculations. Other than making for a snappier user experience, it can also save you storage costs, because you can keep your downsampled data in a bucket with a longer retention period than your raw data.
To accomplish this, I need to:
- Create a new downsampling bucket and a new token that can read and write that bucket
- Create a downsampling Flux script
- Create a task to periodically run that script
- Change the flux in graph.flux to query the downsampled bucket
Create a new bucket and token
First I’ll create a new bucket as before and name it “downsampled.”
$ influx bucket create -n downsampled
The output kindly gives me the bucket id:
ID                      Name            Retention       Shard group duration    Organization ID
c7b43676728de98d        downsampled     720h0m0s        n/a                     f1d35b5f11f06a1d
However, for simplicity, I will create a single token that can read and write both buckets. First, list the buckets to get the bucket ids:
$ influx bucket list
ID                      Name            Retention       Shard group duration    Organization ID
d6ec11a304c652aa        _monitoring     168h0m0s        n/a                     f1d35b5f11f06a1d
fe25b83e9e002181        _tasks          72h0m0s         n/a                     f1d35b5f11f06a1d
c7b43676728de98d        downsampled     720h0m0s        n/a                     f1d35b5f11f06a1d
f8fbced4b964c6a4        plantbuddy      720h0m0s        n/a                     f1d35b5f11f06a1d
Then create the token with read and write permissions for both buckets:
$ influx auth create --write-bucket c7b43676728de98d --write-bucket f8fbced4b964c6a4 --read-bucket c7b43676728de98d --read-bucket f8fbced4b964c6a4
ID                      Description     Token                                                                                           User Name                       User ID                 Permissions
079820bd8b7c1000                        hf356pobXyeoeqpIIt6t-ge7LI-UtcBBElq8Igf1K1wxm5Sv9XK8BleS79co32gCQwQ1voXuwXu1vEZg-sYDRg==        [email protected]  078bedcd5c762000        [read:orgs/f1d35b5f11f06a1d/buckets/c7b43676728de98d read:orgs/f1d35b5f11f06a1d/buckets/f8fbced4b964c6a4 write:orgs/f1d35b5f11f06a1d/buckets/c7b43676728de98d write:orgs/f1d35b5f11f06a1d/buckets/f8fbced4b964c6a4]
Then grab that new token and replace the old token in my app’s secrets store. Restart and make sure everything is still working.
Create a downsampling Flux script
A downsampling script has two basic steps. First, do some aggregations, and second, write the aggregated data somewhere.
I have already figured out the aggregation that I want to do from creating the new graph.flux file. I will add a “downsample.flux” file using the existing aggregation as a starting point. One key difference is that I want to downsample ALL the data, not just the data for a particular user. As such, my aggregation step will skip the filter:
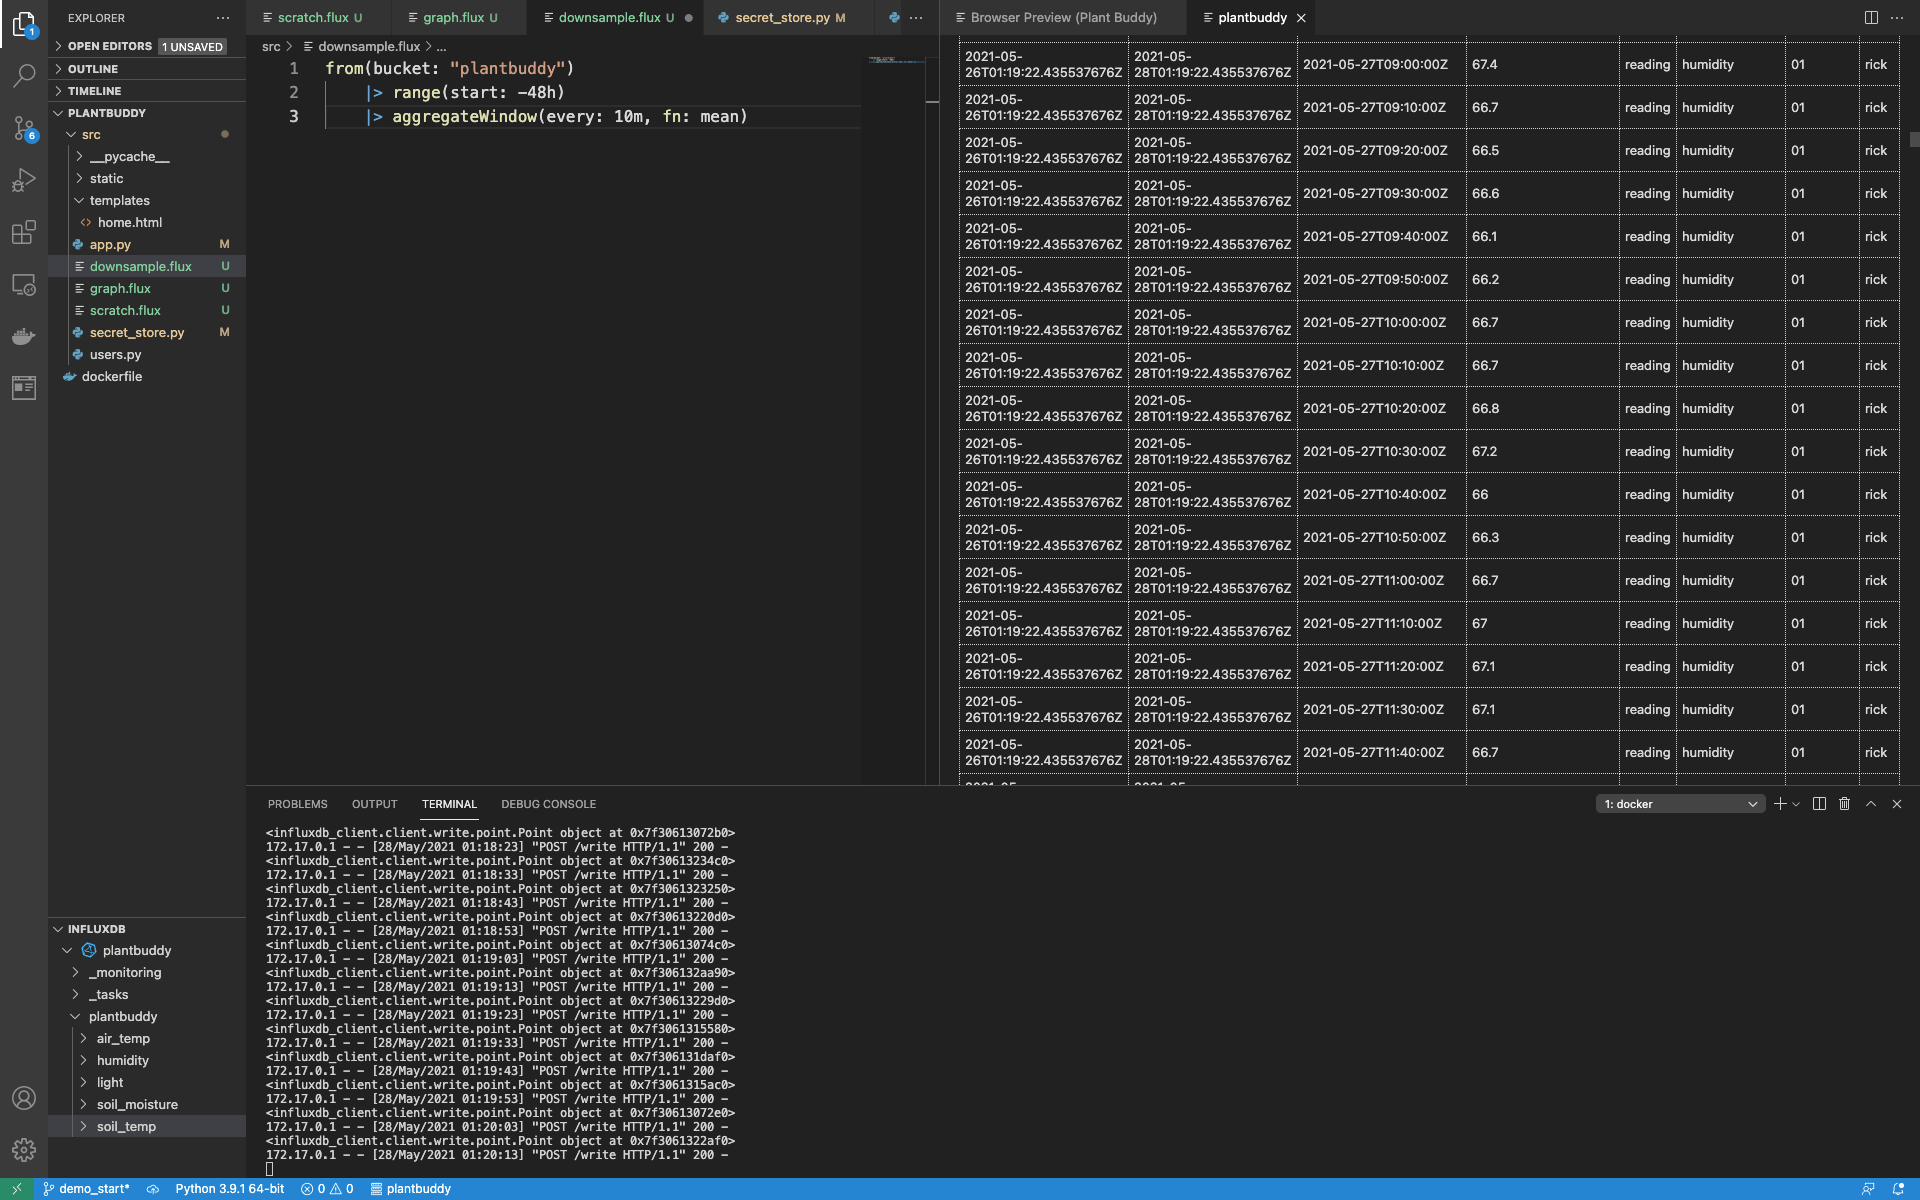
from(bucket: "plantbuddy")
   |> range(start: -48h)
   |> aggregateWindow(every: 10m, fn: mean)
Running this, I can see that this will aggregate all of the data in the bucket.
Now I just need to add the to() function to write all of the downsampled data to my downsampled bucket:
from(bucket: "plantbuddy")
   |> range(start: -48h)
   |> aggregateWindow(every: 10m, fn: mean)
   |> to(bucket: "downsampled")
Querying the downsampled bucket, I can see all the data is there.
I have downsampled all of the existing data, so next I will set up a task so that as data flows in, that will be downsampled as well.
Create a downsampling task from the Flux script
This is a simple matter of taking my downsample.flux script, and registering it as a task to run every 10 minutes.
The first step is to change the range to only look back for the last 10 minutes. I don’t want to constantly re-downsample data I’ve already downsampled.
from(bucket: "plantbuddy")
   |> range(start: -10m)
   |> aggregateWindow(every: 10m, fn: mean)
   |> to(bucket: "downsampled")
Next, I need to add an option that every task needs. There are different fields available, but all I need is a name and “every” which tells the task system how often to run the Flux.
Now my full downsample.flux looks like this:
option task = {
   name: "downsampled",
   every: 10m
}
from(bucket: "plantbuddy")
   |> range(start: -10m)
   |> aggregateWindow(every: 10m, fn: mean)
   |> to(bucket: "downsampled")
Now I just need to register it with InfluxDB Cloud. This is a simple matter of using task create with the CLI:
$ influx task create -f downsample.flux
ID                      Name            Organization ID         Organization                    Status  Every   Cron
079824d7a391b000        downsampled     f1d35b5f11f06a1d        [email protected]  active  10m
Since the output provides me with the task id, I can use that to keep an eye on the task:
$ influx task log list --task-id 079824d7a391b000And I can see that it ran successfully, along with some other useful information, such as what Flux was actually run.
RunID                   Time                            Message
079825437a264000        2021-05-28T01:30:00.099978246Z  Started task from script: "option task = {\n    name: \"downsampled\",\n    every: 10m\n}\nfrom(bucket: \"plantbuddy\") \n    |> range(start: -10m)\n    |> aggregateWindow(every: 10m, fn: mean) \n    |> to(bucket: \"downsampled\")"
079825437a264000        2021-05-28T01:30:00.430597345Z  trace_id=0adc0ed1a407fd7a is_sampled=true
079825437a264000        2021-05-28T01:30:00.466570704Z  Completed(success)
Update the graph query
Finally, I can update the query powering the graph to read from the downsampled bucket. This is a much simpler and faster query.
from(bucket: "downsampled")
   |> range(start: -48h)
   |> filter(fn: (r) => r.user == "{}" )
Restart everything, and it’s all working fast!
Notifications
The final feature we will add is the ability for plantbuddy.com to notify users if their soil gets too dry. With InfluxDB you can use tasks to create status checks and notification rules that will send a message to your application under whatever conditions you define. You should not add polling logic to your application to read a status; you should let InfluxDB do this for you!
While there are simpler ways to implement this functionality using a single task, for example by doing a simple query and then just using http.post() directly in the same task, plantbuddy.com will take full advantage of the whole Checks and Notifications System. The extra benefits particularly include records of the statuses and notifications stored in the _monitoring bucket. Additionally, since this data is stored in the standard format, tools such as dashboards and queries can be easily shared.
Threshold Check
The first kind of task I want to set up is a Threshold Check. This is a task that:
- Queries the data for values of interest
- Checks if those values exceed certain thresholds
- Uses the Flux monitor library to write time series data to the _monitoring bucket
- Create a task from the Flux script and start it running
Query for the value you want to check
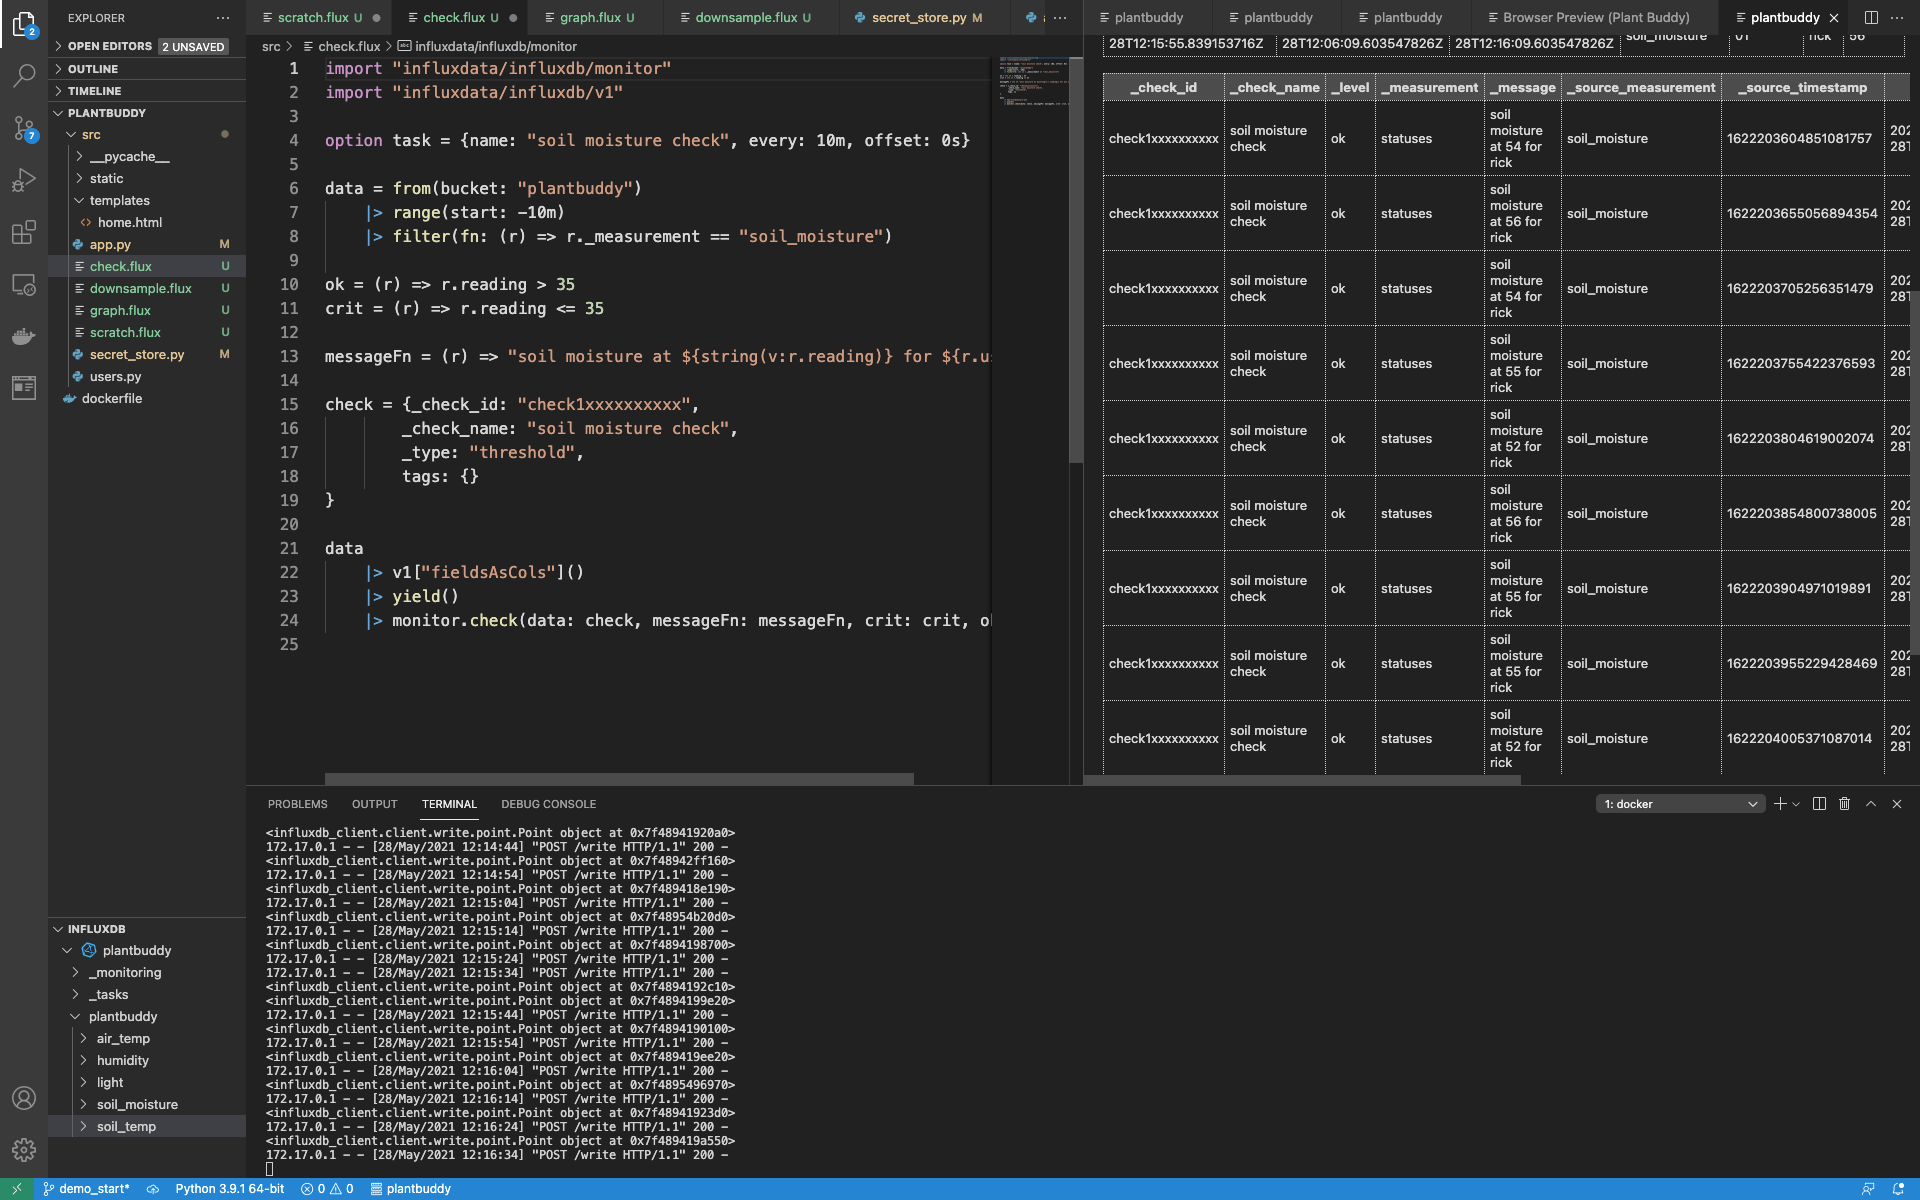
Plant Buddy will be able to provide a notification to any user if their soil moisture level becomes too dry. I will create the related Flux query (soon to be a task) in a new file, check.flux. A simple query can look back in time and find all (and only) the soil moisture levels:
data = from(bucket: "plantbuddy")
   |> range(start: -10m)
   |> filter(fn: (r) => r._measurement == "soil_moisture")
Notice I am querying the raw data in the plantbuddy bucket, rather than the downsampled data.
Define thresholds for the Value
Next I need to determine the different thresholds to watch for. The Checks system will use those thresholds to set the status for each row of data. There are 4 possible levels for a Threshold Check:
- ok
- Info
- warn
- crit
Set the threshold by creating a predicate function for each that returns a bool defining whether the value is within that threshold. You do not need to use all the levels in your threshold check. For Plant Buddy, soil moisture can be either “ok” or “crit” so I just define these two functions:
ok = (r) => r.reading > 35
crit = (r) => r.reading <= 35
Basically, if the soil moisture reading falls to 35 or below, it’s critical.
As mentioned above, the resulting status will be written to the _monitoring bucket. You also need to supply a predicate function to create a message that gets logged. This message can be complex or simple. I am keeping it simple:
messageFn = (r) => "soil moisture at ${string(v:r.reading)} for ${r.user}"These predicate functions are parameters for the monitor.check() function which generates the statuses and writes them to the _monitoring bucket, which we’ll use below.
Generate the status for each record with the monitoring.check() function
The monitoring package has a function called monitoring.check() that now does the work of calculating and recording the statuses for you. It will go through each record in the data that was returned, calculate the status level (ok or crit in this case), calculate the message string, and then record that in the _monitoring bucket for you along with some other information.
First, though, we need to supply some metadata to monitor.check. An id, name, type, and a list of tags is required. Tags are useful when you have multiple notification rules. Since currently, I am only planning one, I will leave the tags object empty.
check = {_check_id: "check1xxxxxxxxxx",
       _check_name: "soil moisture check",
       _type: "threshold",
       tags: {}
Now my script can go ahead and call monitor.check. A couple of things to note:
- Pipe forwarding through schema.fieldsAsCols() function is required. That is the shape that monitor.check function expects. It also helps make some checks easier to write because you can more easily write expressions that combine values from different fields.
- It's a little confusing because the check meta
data parameter is named “data”. I call the option for this “check” and I call the time series data that I retrieved “data”. That is just more clear to my mind.</li> <li>I added a yield() in order to make it easier for me to run the script and check the results.</li> </ol>
data
   |> v1["fieldsAsCols"]()
   |> yield()
   |> monitor.check(data: check, messageFn: messageFn, crit: crit, ok: ok)
It’s simpler to see how it works when you have it all in one place:
import "influxdata/influxdb/monitor"
import "influxdata/influxdb/v1"

option task = {name: "soil moisture check", every: 10m, offset: 0s}

data = from(bucket: "plantbuddy")
   |> range(start: -10m)
   |> filter(fn: (r) => r._measurement == "soil_moisture")

ok = (r) => r.reading > 35
crit = (r) => r.reading <= 35

messageFn = (r) => "soil moisture at ${string(v:r.reading)} for ${r.user}"

check = {_check_id: "check1xxxxxxxxxx",
       _check_name: "soil moisture check",
       _type: "threshold",
       tags: {}
}

data
   |> v1["fieldsAsCols"]()
   |> yield()
   |> monitor.check(data: check, messageFn: messageFn, crit: crit, ok: ok)
Now I can manually run my check. As expected, it created a _level of “ok” for every reading in the last 10 minutes.
I can go a little deeper and query the _monitoring bucket directly:
from(bucket: "_monitoring")
   |> range(start: -5m)
   |> filter(fn: (r) => r._field == "_message")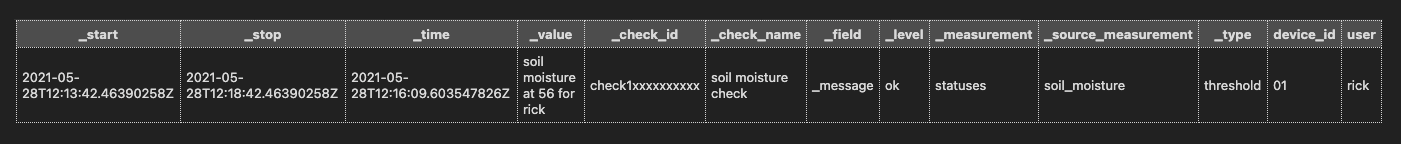
Everything looks good, so next, I will set up InfluxDB to run the code in check.flux on a schedule.
Create the Threshold Check task
I already added options to make the script into a task:
option task = {name: "soil moisture check", every: 10m, offset: 0s}So, now I can just create the task with the check.flux file:
$ influx task create -f check.flux
ID                      Name                    Organization ID         Organization                    Status  Every   Cron
0798ba98b30d5000        soil moisture check     f1d35b5f11f06a1d        [email protected]  active  10m
Now I have a task running every 10 minutes that is recording a status, so next I need to write a notification rule, which is another task that will call an endpoint on Plant Buddy, so Plant Buddy can notify the user.
Notification Rule
In order to write this task, I need to accomplish a few things:
- Add a secret to InfluxDB so Plant Buddy can authorize any communication back from InfluxDB Cloud
- Add an endpoint to plantbuddy.com to get called when the notification rules conditions are met
- Create an endpoint variable in Flux that points to a publicly accessible url (I punched a hole through my firewall so that my development server is accessible from InfluxDB Cloud)
- Use the monitoring library to search for any statuses that I want to notify users about (specifically if the _level is crit)
- Call the endpoint for every record that matches that condition, sending along the message created by the check
Store and use the secret in InfluxDB Cloud
First I want to store the token that Plant Buddy will use to verify that any incoming requests are coming from InfluxDB. I could simply add this to the Flux script, but it is much more secure to use the platform’s secret store than to keep them in source code.
$ influx secret update -k pb_secret -v sqps8LCY6z8XuZ2k
Key             Organization ID
pb_secret       f1d35b5f11f06a1d
Then I can retrieve the secret with this code. I created a new file called notifation_rule.flux to store this Flux. This is all that is involved in retrieving the secret as a string:
import "influxdata/influxdb/secrets"

secrets.get(key: "pb_secret")
Add an endpoint to Plant Buddy
Actually notifying the user in some way is not yet implemented, so, I will simply add this code to app.py so I can make sure that the system is working end to end:
@app.route("/notify", methods = ['POST'])
def notify():
   print("notification received", flush=True)
   print(request.data, flush=True)
   return {'result': "OK"}, 200
   # TODO: check the authorization and actually notify the user
Add the endpoint to Flux
Now I can reference that endpoint in my Flux:
endpoint = http.endpoint(url: "http://71.126.178.222:5000/notify")
You may notice that I have not yet supplied headers or a body. Because I want the body to be the message stored with the status for each status, I will dynamically add the header and body when the endpoint is actually called.
Find matching statuses
This code uses the convenience functions built into the monitor library to look back 2 minutes, and find any statuses that are set to crit:
monitor.from(start: -2m)
   |> filter(fn: (r) => r._level == "crit")
In the next steps, I will actually fire and record any matching notifications.
Set up the Notification Rule task
Just like a status check, the monitor library in Flux requires metadata in a certain format in order for the notify function to work. I define that in this object:
rule = {
   _notification_rule_id: "notif-rule01xxxx",
   _notification_rule_name: "soil moisture crit",
   _notification_endpoint_id: "1234567890123456",
   _notification_endpoint_name: "soil moisture crit",
}
Notify
I can now finish the job and call the monitor.notify() function. I just need to supply:
- The metadata I defined for the notification. This is used when a notification is fired to record in InfluxDB that the notification event occurred (and whether or not the notification was sent successfully).
- Supply a map() function that returns the headers and data I want to send via http.post() to the endpoint I defined.
monitor.from(start: -2m)
   |> filter(fn: (r) => r._level == "crit")
   |> monitor.notify(
       data: rule,
       endpoint: endpoint(
           mapFn: (r) => ({
               headers: {"Authorization":secrets.get(key: "pb_secret")},
               data: bytes(v: r._message),
           }),
       ),
   )
   |> yield(name: "monitor.notify")
When I run this, there are no results.
This is because there are no crit statuses. However, I can synthetically create a crit status to yield results:
$ influx write --bucket plantbuddy "soil_moisture,user=rick,device_id=01 reading=20i"
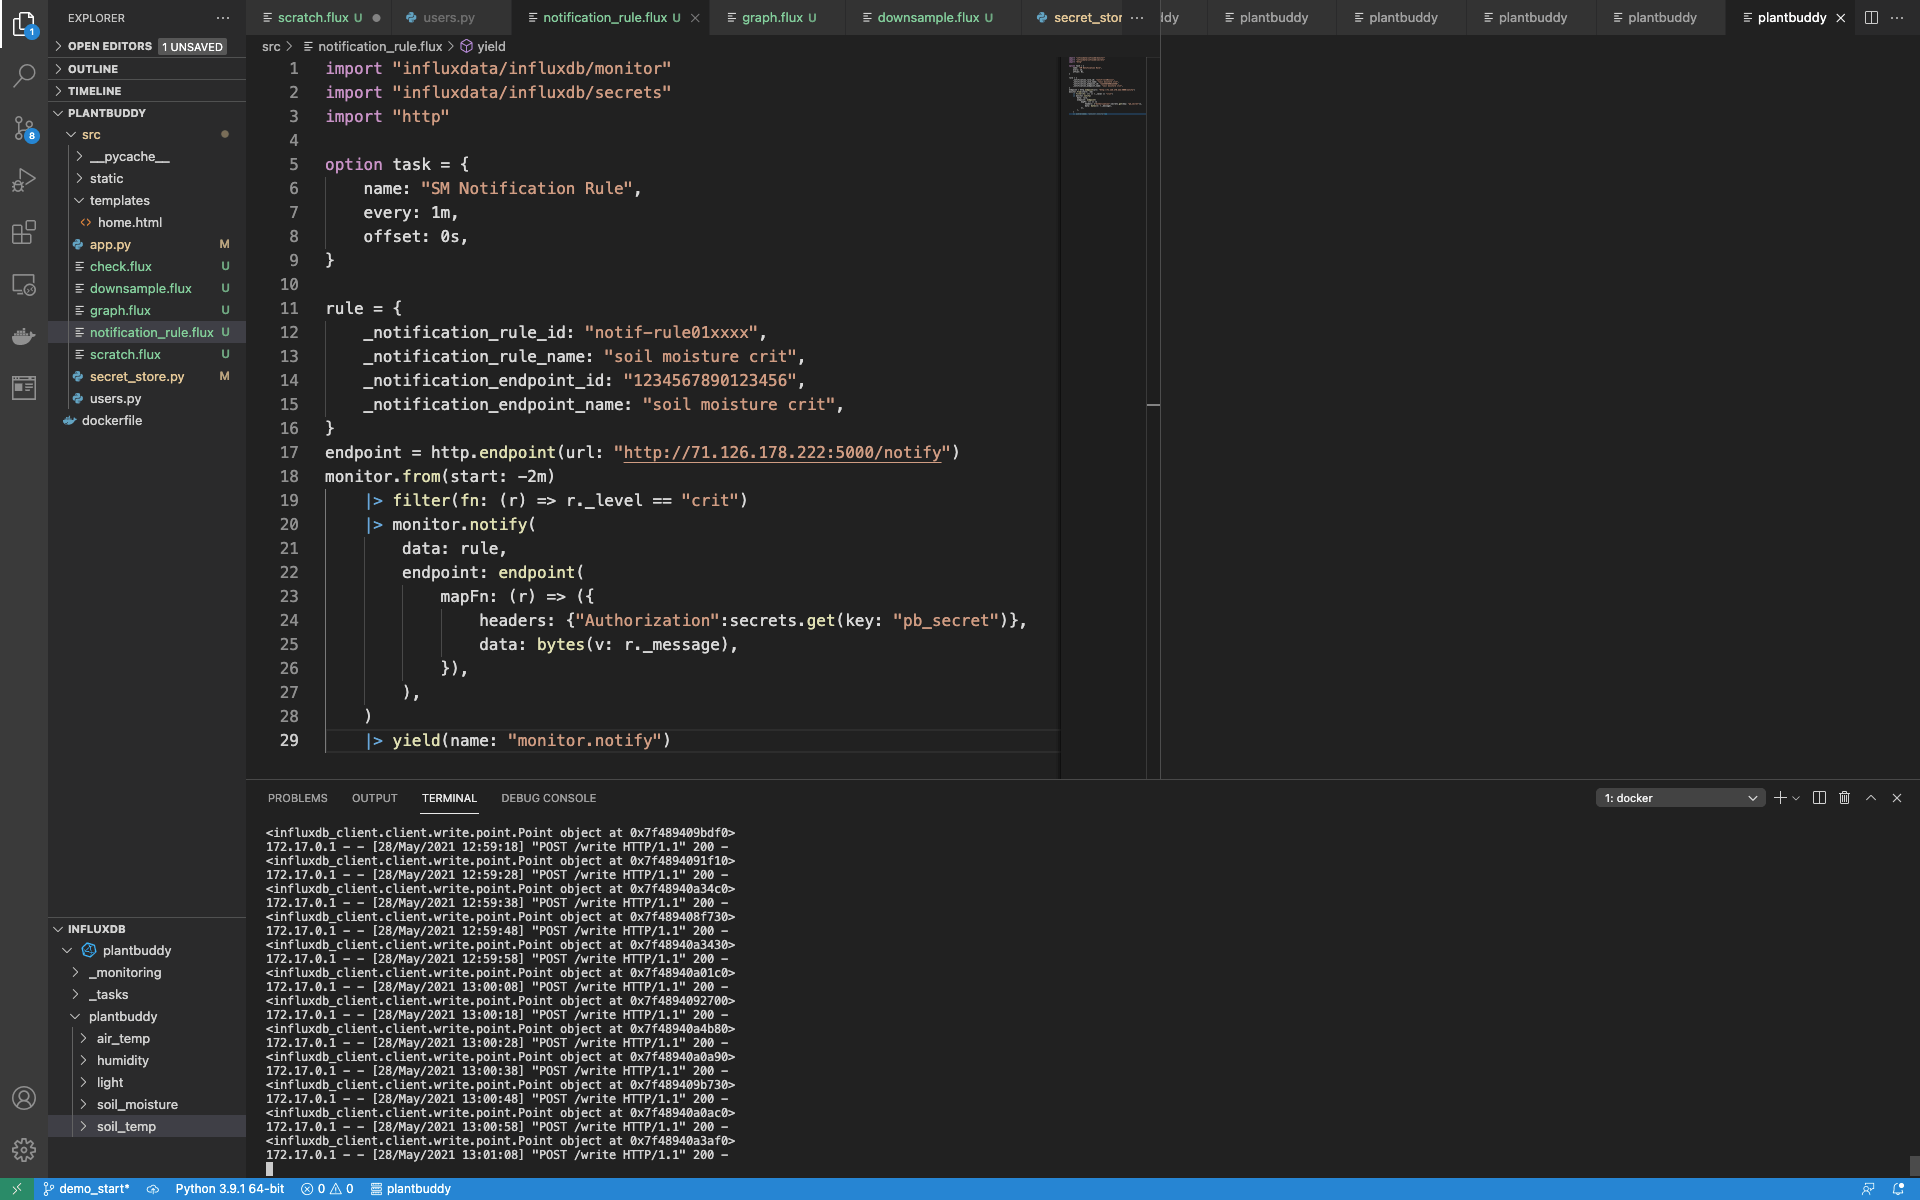
Then I can re-run check.flux and notifcation_rule.flux, and see that my application received the notification, and InfluxDB recorded the notification as sent.
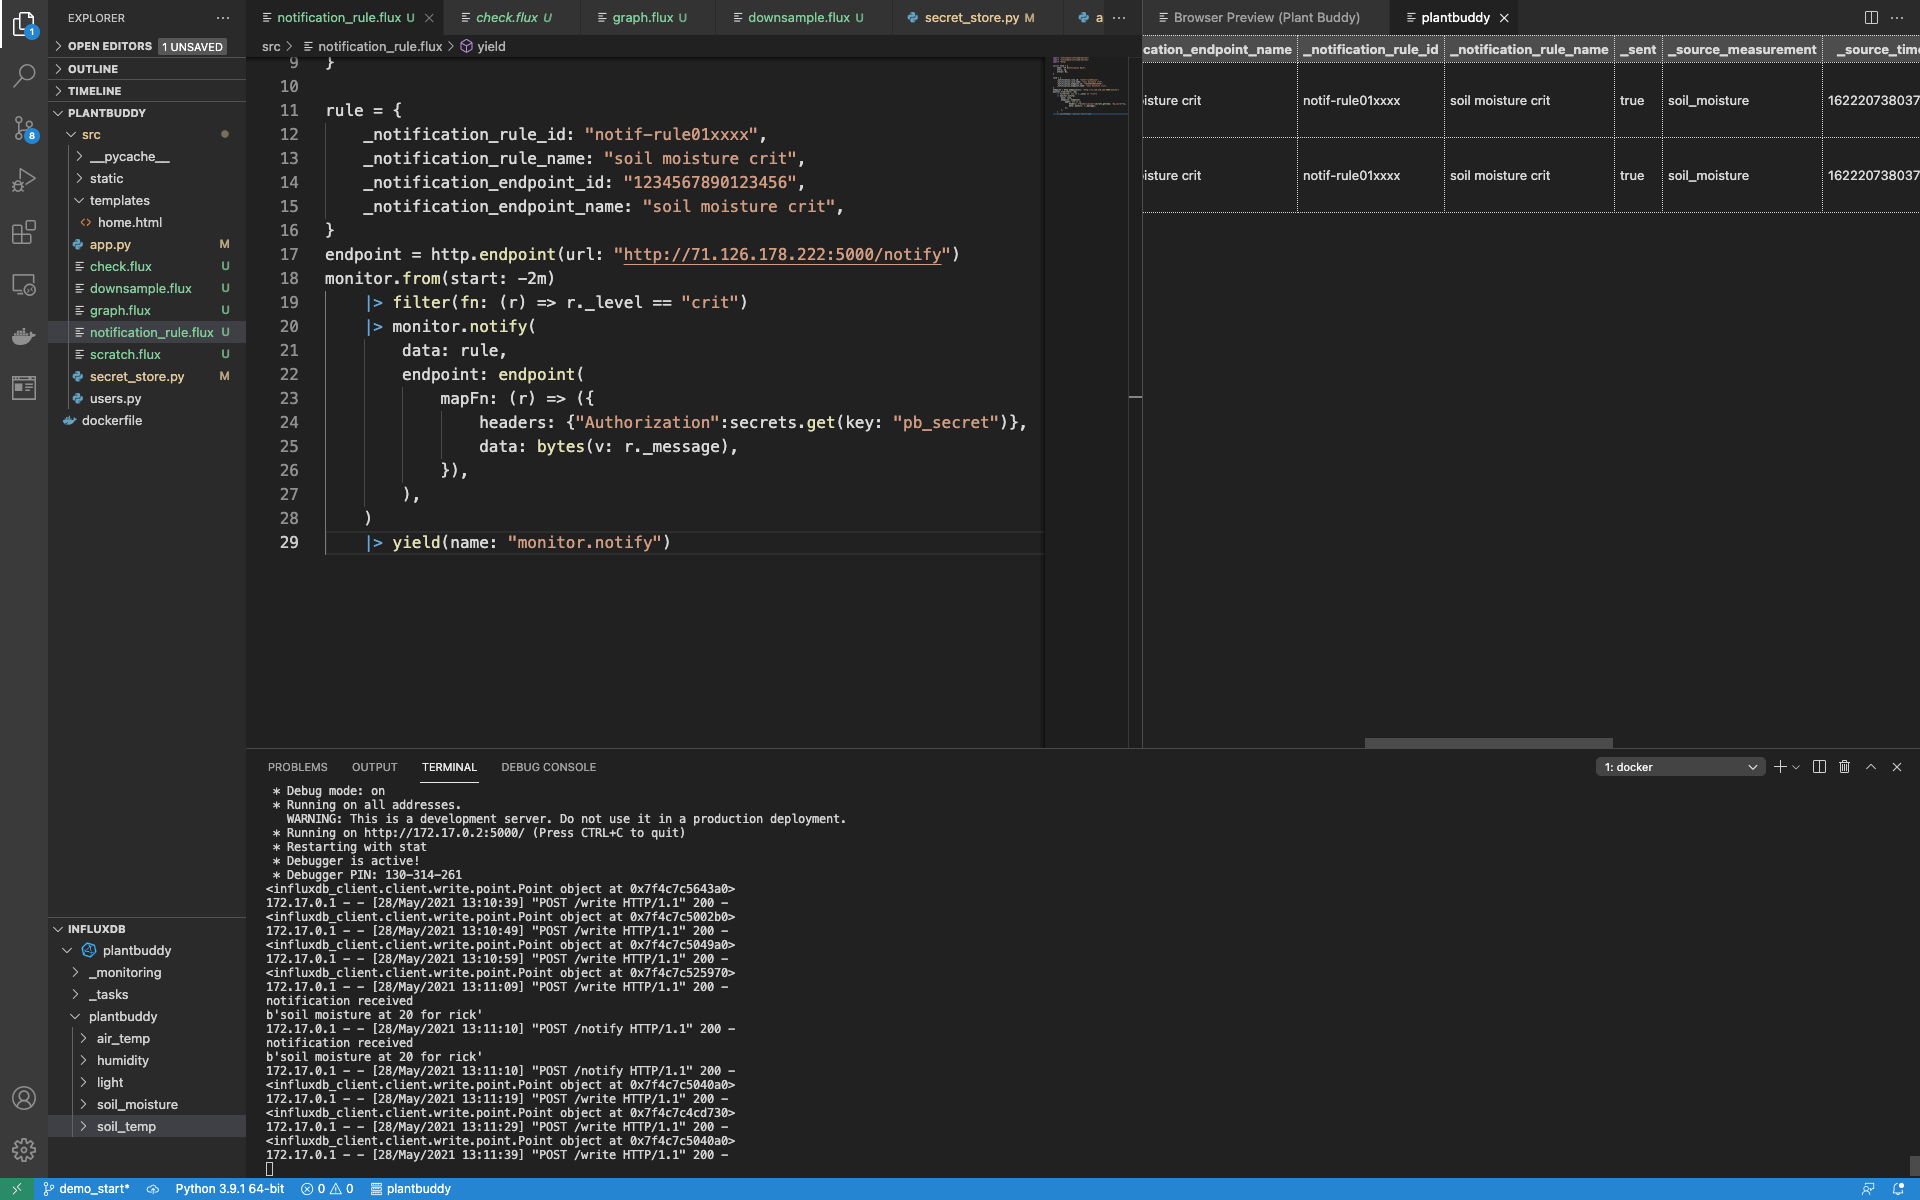
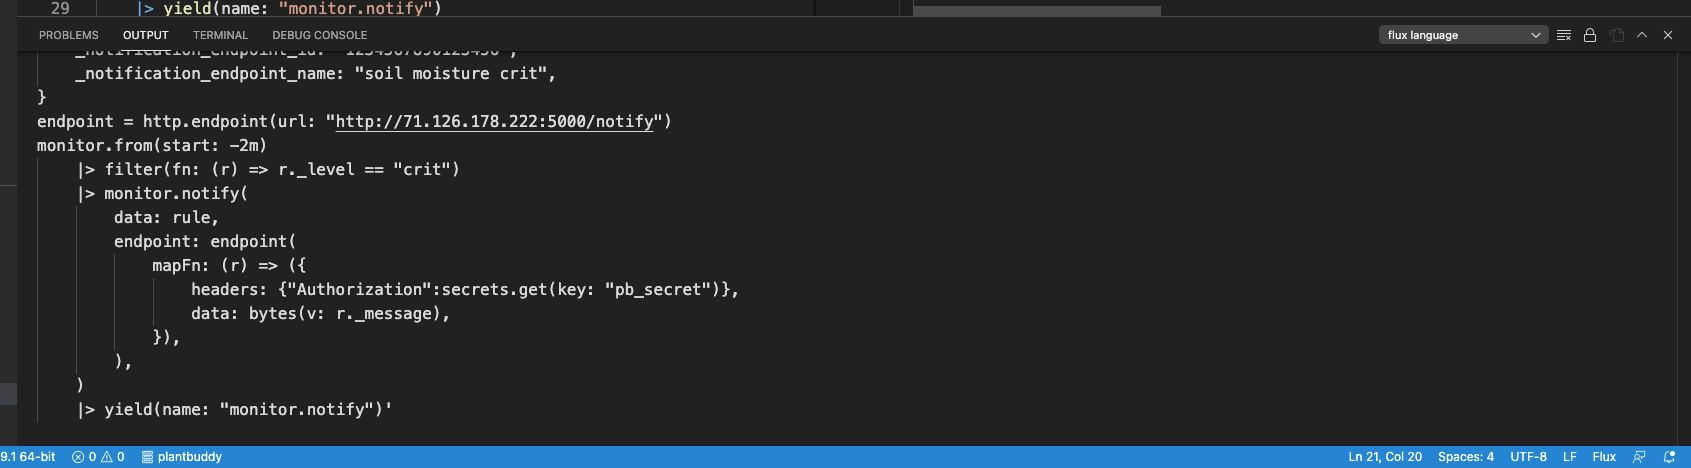
Once again, I think it is easier to see how it all works together when you see the full contents of notification_rule.flux:
import "influxdata/influxdb/monitor"
import "influxdata/influxdb/secrets"
import "http"

option task = {
   name: "SM Notification Rule",
   every: 1m,
   offset: 0s,
}

rule = {
   _notification_rule_id: "notif-rule01xxxx",
   _notification_rule_name: "soil moisture crit",
   _notification_endpoint_id: "1234567890123456",
   _notification_endpoint_name: "soil moisture crit",
}
endpoint = http.endpoint(url: "http://71.126.178.222:5000/notify")
monitor.from(start: -2m)
   |> filter(fn: (r) => r._level == "crit")
   |> monitor.notify(
       data: rule,
       endpoint: endpoint(
           mapFn: (r) => ({
               headers: {"Authorization":secrets.get(key: "pb_secret")},
               data: bytes(v: r._message),
           }),
       ),
   )
   |> yield(name: "monitor.notify")
Create the Notification Rule Task
Finally, to finish it off, I need to register the notification rule as a task with InfluxDB. As before, I need to create an option named task so that the task system knows how to handle the script:
option task = {
   name: "SM Notification Rule",
   every: 1m,
   offset: 0s,
}
Then, I can simply create the task as before.
$ influx task create -f notification_rule.flux
ID                      Name                    Organization ID         Organization                    Status  Every   Cron
0798c6de048d5000        SM Notification Rule    f1d35b5f11f06a1d        [email protected]  active  1m
Operational Monitoring
Regarding my InfluxDB backend, I now have:
- Data flowing into InfluxDB
- 3 tasks running: Downsampling Task, Threshold Check Task, and Notification Rule Task
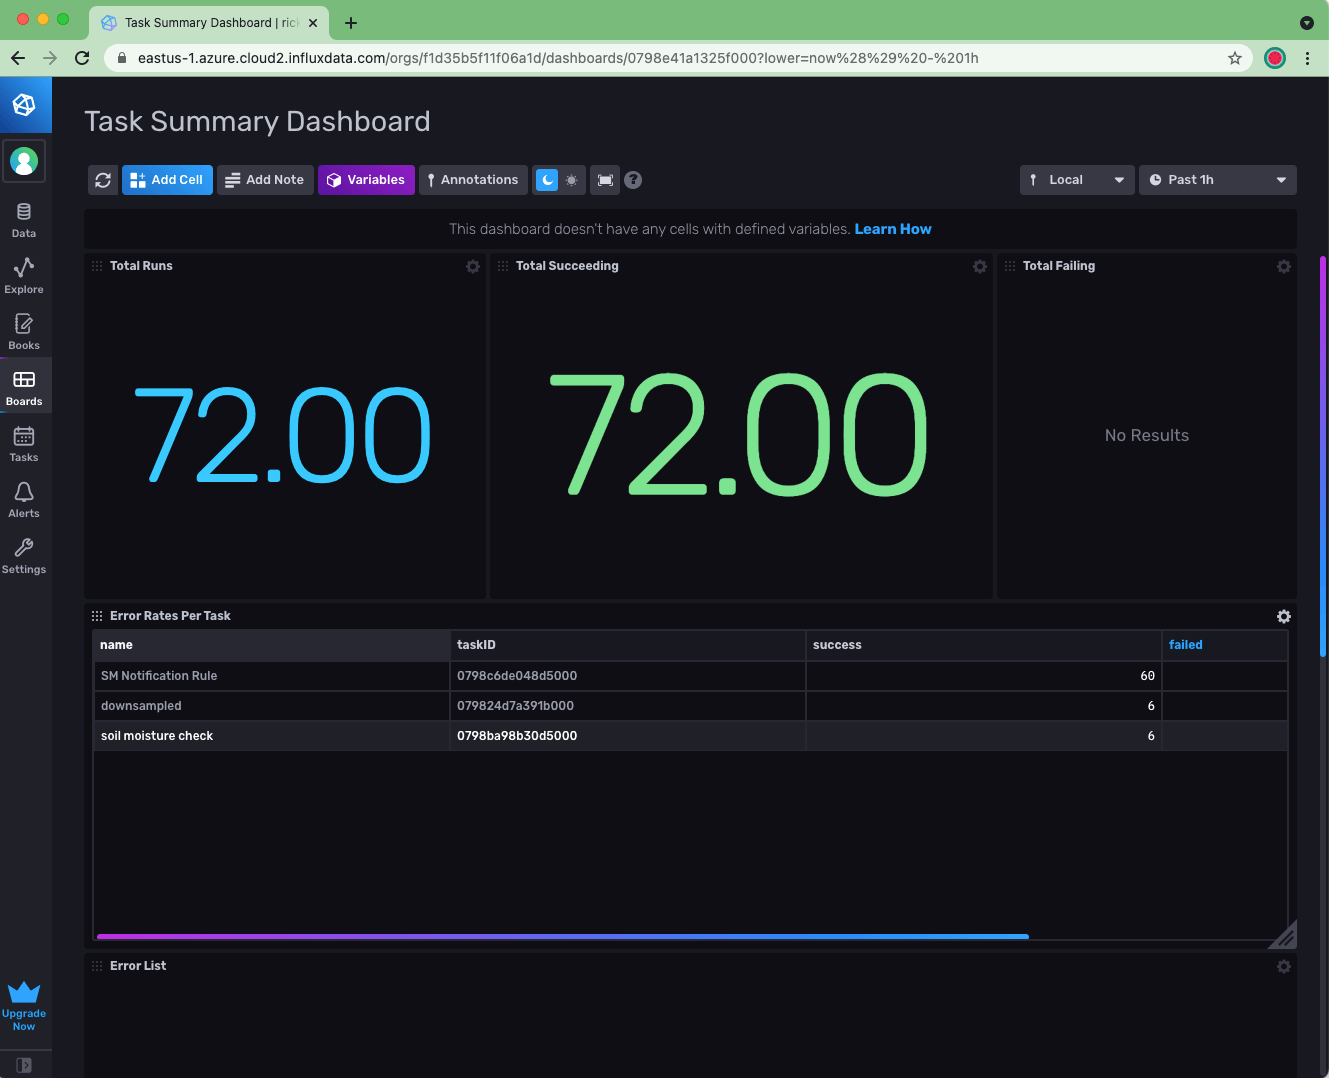
How do I keep tabs on whether the backend is operating correctly? This is easy to accomplish by installing the Operational Monitoring Template into your account. Note that you will need to upgrade from a free account in order to have enough bucket quota to install the template.
After installing the template, I can, for example, use the Task Summary Dashboard to confirm that all of my tasks are running fine. I can go on to create checks and notifications that can alert me (as opposed to my users) if any problems should arise.