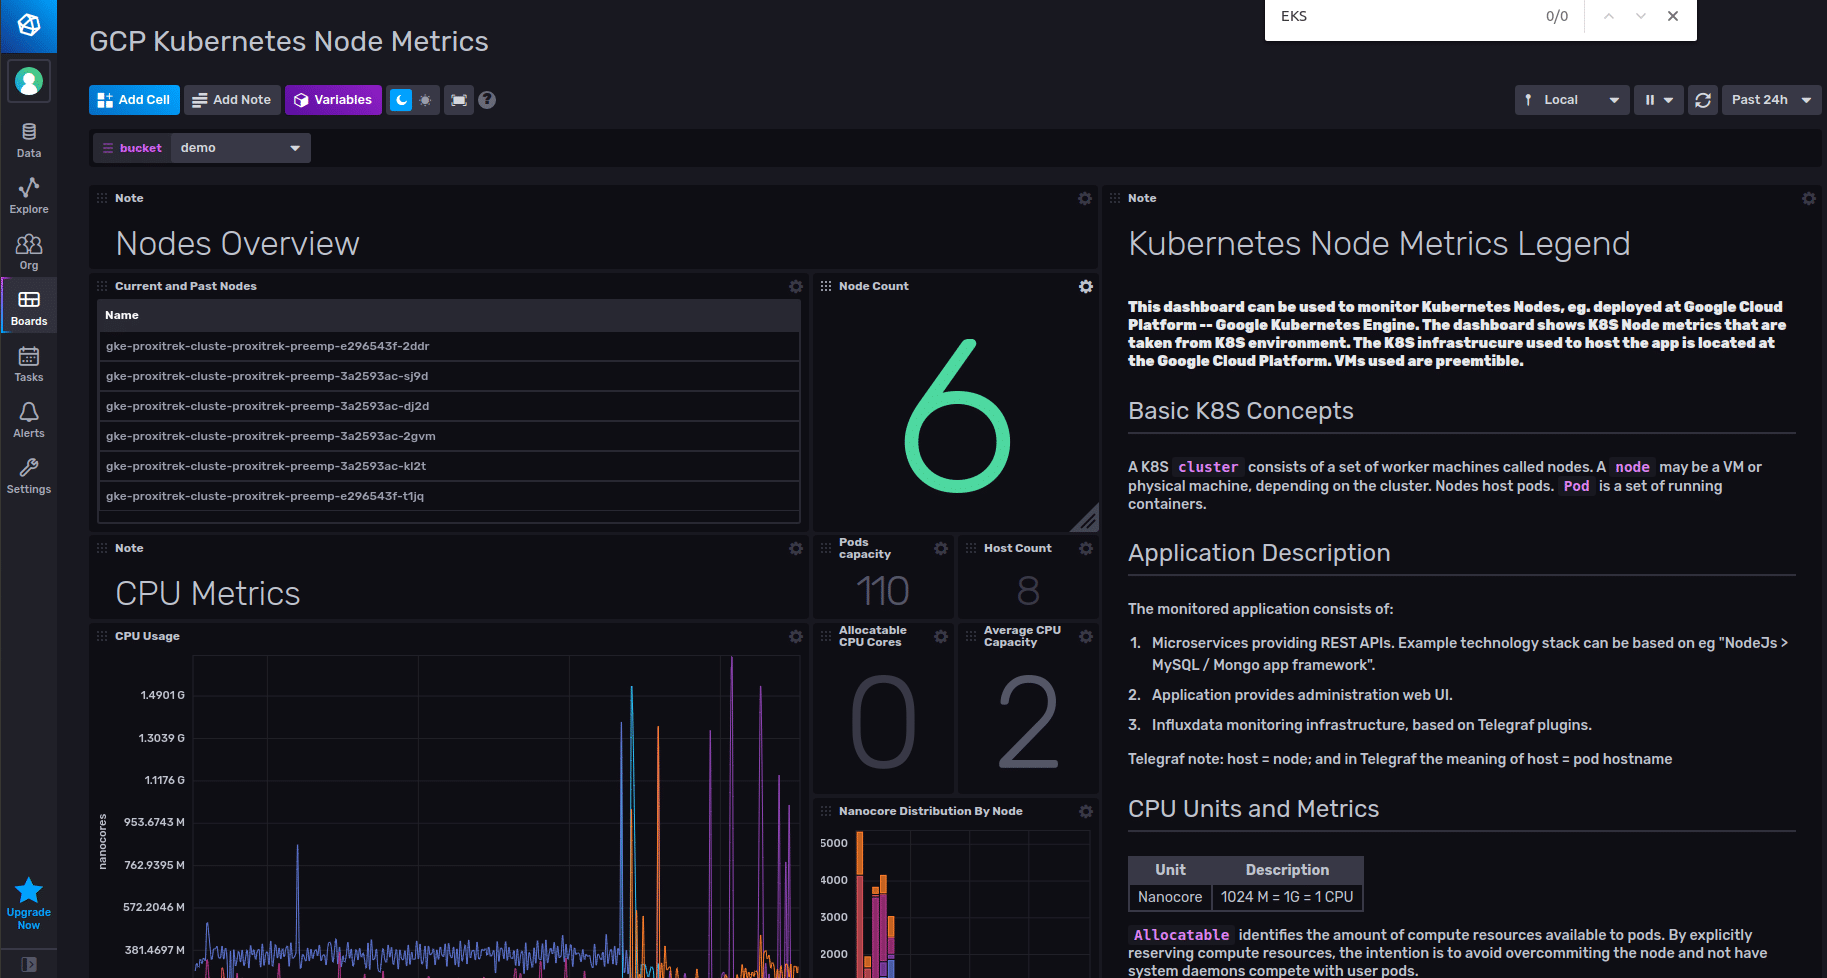
InfluxDB for Kubernetes Monitoring
#1
Time Series Database
Source: DB Engines
1B+
Downloads of InfluxDB
Take the complexity out of time series data management
Try InfluxDBTurn high-volume, high-velocity, high-resolution time series data into actionable intelligence without sacrificing performance.
Get high-speed ingestion, real-time querying, and seamless scalability in a highly performant time series database that can handle unlimited volumes of time series data, even as data complexity and cardinality increases.
Run InfluxDB at scale in any environment in the cloud, on-premises, or at the edge. InfluxDB consists of the core database and storage engine, an API, and an ecosystem of tools and integrations to manage time-stamped data. Easily integrate with 5K+ prebuilt connections using Telegraf, our open source agent with 5B+ downloads.
Run InfluxDB 3 where you need it
Start for free, scale in seconds
Start NowFor small workloads and getting started
Deploy anywhere: on-prem, private cloud, edge, or multi-tenant cloud.
Secure, dedicated cloud infrastructure
Run a Proof of ConceptFor scaled workloads
Fully-managed, single-tenant service with unlimited scale, high availability, secure private connections, and enhanced Support.
Own your data with enterprise features
Run a Proof of ConceptFor scaled workloads
Control your infrastructure with unlimited scale, high availability, enterprise-grade security, and enhanced Support. On-prem, private cloud, and edge deployment.
Why InfluxDB
Limitless data collection
Ingest and analyze millions of time series data points per second without limits or caps.
Predict and prevent
Maximize uptime and prevent costly failures with real-time monitoring and preventative insights.
Real-time query
Data is immediately available for querying in InfluxDB, enabling real-time SQL queries and lightning-fast responses.
Why monitor Kubernetes?
Kubernetes orchestration provides built-in fault tolerance, automating scaling and maintenance for a desired cluster state. However, visibility must come with the necessary granularity and information for fast identification of the source of trouble. Monitoring and accountability are what make automation reliable.
Why InfluxDB for Kubernetes monitoring?
Most production environments don’t have a singular approach when it comes to application monitoring. InfluxDB can monitor private and public cloud infrastructures (e.g., PaaS, SaaS, website) and provide deployment variances for scalability, as well as custom instrumentations for uniqueness and cross-measurement analytics advanced alerting. InfluxDB helps to identify and resolve problems before they affect critical processes, and most importantly, offers ways to implement Kubernetes monitoring that accommodates developers’ need for instrumentation without overloading IT operations.
Get broad insight and act in time
Monitor all Prometheus metrics, custom application metrics, K8s annotations, and logs from one pane. Multiple data collection options and a comprehensive view of infrastructure, containers, and applications status are fundamental to keeping services running without degradations or escalating issues that could lead to outages.
Optimize to be competitive at lower cost
InfluxDB is a performant store for time series data, both numeric and non-numeric. It avoids the need for expensive hardware and storage or to install and maintain multiple monitoring platforms. InfluxDB’s real-time stream analytics and highly efficient compression and compaction allow data to be ingested and stored cost-effectively.
HA and Scalability
InfluxDB’s purpose-built design for time series allows for very high volume storage of monitoring records while providing horizontal scalability and high availability with clustering. This makes it an ideal solution for long-term storage of Kubernetes monitoring data for historic records or modeling purposes.
InfluxData support for Kubernetes monitoring
InfluxData’s Telegraf is an open source, plugin-based agent ({{num_plugins}}+ plugins) that collects metrics and events from Kubernetes nodes, master nodes, pods, containers, and all Prometheus /metric endpoints. Telegraf is capable of monitoring itself and its metric pipeline, so you are alerted if essential metrics are not being collected. In Kubernetes cluster environments, Telegraf can be deployed as a DaemonSet in every node, as an application sidecar in pods, or as a central collector.
In addition to Telegraf’s versatility in collecting data from Kubernetes APIs, Prometheus /metrics endpoint, infrastructure (systems, VMs, and containers), and applications, InfluxData has implemented a Kubernetes Operator to facilitate the deployment and management of InfluxDB Instances.
Telegraf deployed as DaemonSet agent
Telegraf can be installed as a DaemonSet in every Kubernetes node. Telegraf can directly collect monitoring data from the nodes, containers, pods, and applications via a push or pull mechanism. This deployment option is good for baseline metrics that need to be collected from all nodes.
Telegraf deployed as a sidecar agent
Telegraf can be installed as an application sidecar in Kubernetes pod deployments. As a sidecar, Telegraf is encapsulated in the pod with the application sharing the same network. This deployment is particularly useful to isolate the impact of application instrumentation to the pod level, not overloading the entire Kubernetes monitoring. Sidecar deployment gives freedom to developers to expose and instrument metrics as they find necessary, without burdening IT Ops with scraping scaling issues.
Telegraf deployed as central agent with Kubernetes service discovery
Telegraf supports Kubernetes service discovery by watching Prometheus annotations on pods, thus finding out which applications expose /metrics endpoints. As a single agent, Telegraf can scrape /metrics endpoints exposed in the clusters and send collected data more efficiently to InfluxDB.
Specific Telegraf components
- Telegraf Kubernetes input plugin – The Kubernetes Input Plugin talks to the kubelet API to gather metrics about the running pods and containers.
- Telegraf Kubernetes Inventory plugin – The Kubernetes Inventory plugin collects kube state metrics (nodes, namespaces, deployments, replica sets, pods, etc.)
- Telegraf plugin for service discovery of Prometheus /metrics – The Prometheus Format Input Plugin for Telegraf discovers and gathers metrics from HTTP servers exposing metrics in Prometheus format.
- Telegraf self-monitoring of metric pipeline plugins – Telegraf can collect data about internal metrics and agent stats by enabling inputs.internal plugin, and also check its own availability by enabling http_response plugin.
InfluxDB for Kubernetes monitoring
InfluxData has added Kubernetes-specific capabilities to make it easier for its users to work with Kubernetes:
- Helm Charts for Faster Node Deployment – kube-influxdb is a collection of Helm Charts for the InfluxData TICK Stack to monitor Kubernetes with InfluxData.
- Native Kubernetes Operators – A Kubernetes Operator manages InfluxDB instances deployed as a Kubernetes object.
- High Availability (HA) and scalability of monitored data – Large volumes of Kubernetes metrics and events can be preserved in InfluxDB storage clusters, allowing long-term policy retention, high data granularity, and series cardinality.
- Integration with Prometheus Monitoring: Kubernetes native monitoring is based on Prometheus format. InfluxDB integration with Kubernetes Prometheus monitoring is supported in two ways:
- Remote Write API: Prometheus can write samples that it ingests to InfluxDB in a standardized format.
- Remote Read API: Prometheus can read (back) sample data from InfluxDB in a standardized format.
Learn more about Kubernetes monitoring implementations made available by the InfluxDB community
WEBINARS
- InfluxDB + Telegraf Operator: Easy Kubernetes Monitoring Shows how to use InfluxDB and the Telegraf Operator to monitor your Kubernetes containers.
- How InfluxData Makes Kubernetes an Even Better Master of Its Components Through Monitoring Shows how to use InfluxData to help Kubernetes orchestrate the scaling out of applications by monitoring all components of the underlying infrastructure.
- Kapacitor: Service Discovery, Pull, and Kubernetes Shows how Kapacitor’s Service discovery and scraping code will allow any service discovery target that works with Prometheus to work with Kapacitor.
BLOG POSTS
- Monitoring the Kubernetes Nginx Ingress with the Nginx InfluxDB Module
- Kubernetes Cluster Monitoring and Autoscaling With Telegraf and Kapacitor
- How to Spin up the TICK Stack in a Kubernetes Instance
- Packaged Kubernetes Deployments – Writing a Helm Chart
- Scaling Kubernetes Monitoring without Blind Spots or Operations Burden
“We recently introduced InfluxDB as our first-class time series database system, where we had the opportunity to work directly with InfluxData to ensure we were on a path that is scalable, robust, and in line with the future direction of their platform.”
Mike BellEngineer, Wayfair
Open data standards drive performance and interoperability
InfluxDB 3 is built in Rust and the FDAP stack—Flight, DataFusion, Arrow, and Parquet—leveraging Apache-backed technologies to efficiently ingest, store, and analyze time series data at any scale.
Try InfluxDBF
Flight for efficient columnar data transfer
D
DataFusion for high-performance querying

A
Arrow for optimized in-memory columnar analytics

P
Parquet for high-compression storage
InfluxDB’s columnar database supports time series data at a lower TCO
See ways to get started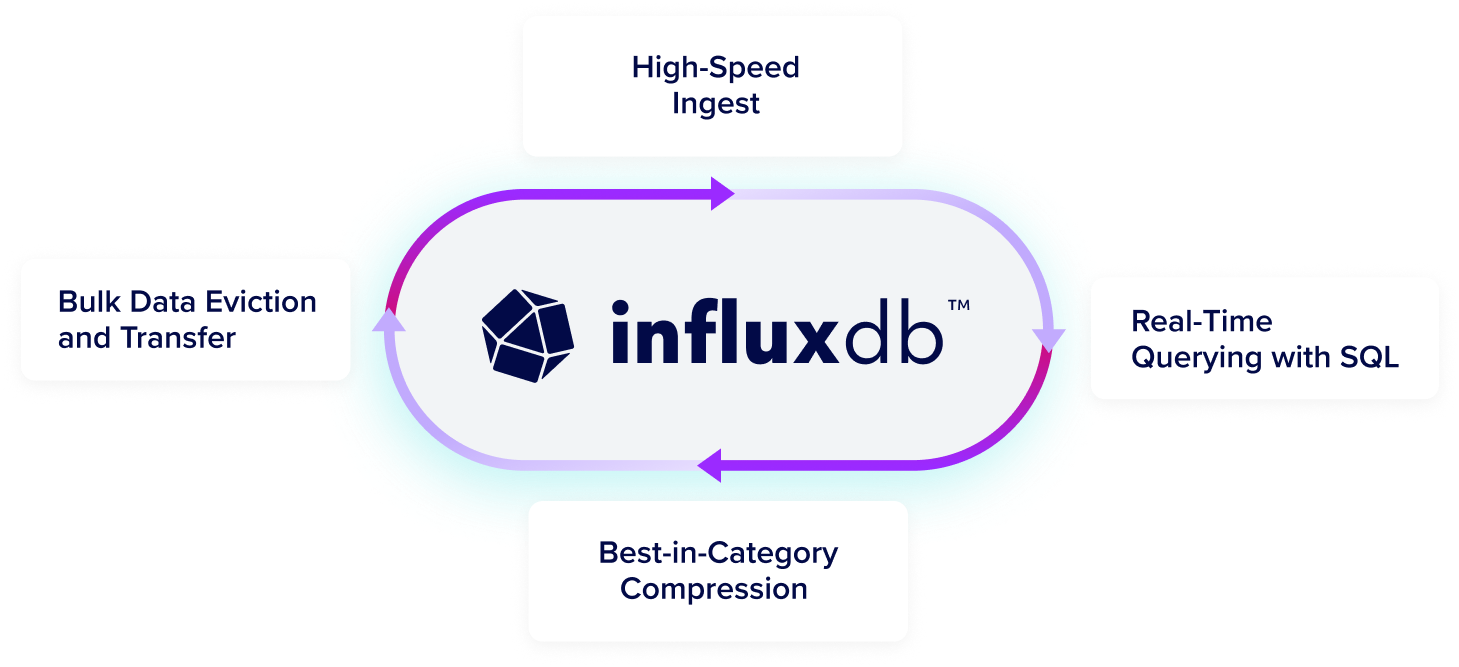

Loved by developers, trusted by enterprises

65M+
daly events processed
45x
more resource efficient
Siemens Energy
"[We] long used InfluxDB open source... Moving to commercial InfluxDB was a strategic move to unify our data infrastructure, ensuring we have the reliability, scalability, and real-time performance to keep pace with production... and proactive maintenance."
Jan Petersen
Senior Manufacturing Engineer
500M+
Metrics collected daily
Mission-critical monitoring
Real-time data access for queries
LOFT ORBITAL
Space Made Simple: How Loft Orbital Delivers Unparalleled Speed-to-Space with InfluxDB Cloud
Read Case Study65M+
daly events processed
45x
more resource efficient
CAPITAL ONE
"InfluxDB is a high-speed read and write database. The data is written in real-time, you can read it in real-time, and while reading, you can apply your machine learning model. So, in real-time, you can forecast and detect anomalies."
Rajeev Tomer
Sr. Manager of Data Engineering
50%
lower total cost of ownership
100K
real-time metrics with simplified deployment
TERÉGA
Teréga Replaced Its Legacy Data Historian with InfluxDB
Lorem ipsum
Lorem ipsum dolor sit amet consectetur.
65M+
daly events processed
45x
more resource efficient
WIDEOPENWEST
"I was blown away with how easy it was to install and configure InfluxDB. The clustering was easy. The documentation was great, and the support has been second to none."
Dylan Shorter
Engineer III, Software and Product Integration Engineering
45%
Less equipment downtime
10%
Reduced waste
MAJIK SYSTEMS
From Reactive to Proactive: How MAJiK Systems Embraced Predictive Maintenance with InfluxDB and Time Series Data
Dylan Shorter
Engineer III, Software and Product Integration Engineering
65M+
daly events processed
45x
more resource efficient
JU:NIZ ENERGY
"With InfluxDB Cloud Dedicated, the great thing is that we don't need to think about data storage costs or usage anymore because data storage gets way cheaper."
Ricardo Kissinger
Head of IT Infrastructure and IT Security

