Table of Contents
One of the most powerful things about working at InfluxData is the amazing open source community that is constantly using our software in new and exciting ways. With the latest release of Chronograf, we took a look at what our users were doing with our software and made it easier and more powerful than ever.
The latest release can be found on our InfluxData Downloads page.
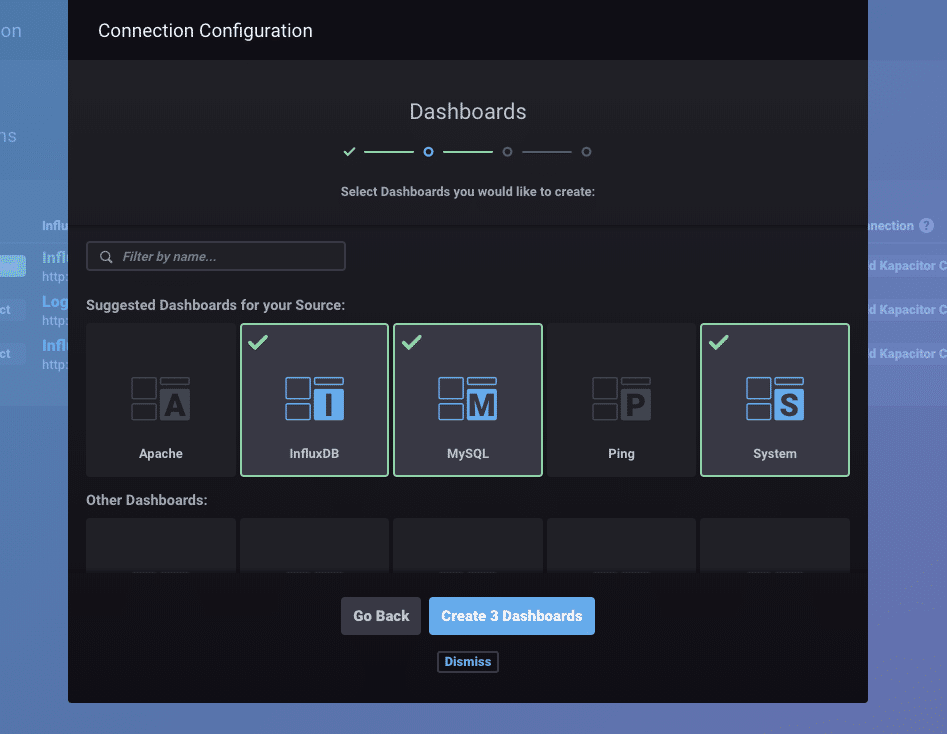
Predefined Dashboards and Simple Source Configuration
Let’s start with setting up Chronograf. We’ve added a step-by-step guide for adding your first InfluxDB and Kapacitor connections into Chronograf. To help users get started with building dashboards, we’ve also added predefined dashboards that you can import into Chronograf and use as a starting point to build the dashboard of your dreams. Available dashboards include MySQL, VMware vSphere, Kubernetes, and many more. These are populated via the corresponding Telegraf input plugins. Not sure which plugin to use? The new “notes on dashboards” feature (see below) provides explicit guidance on which plugins to use.
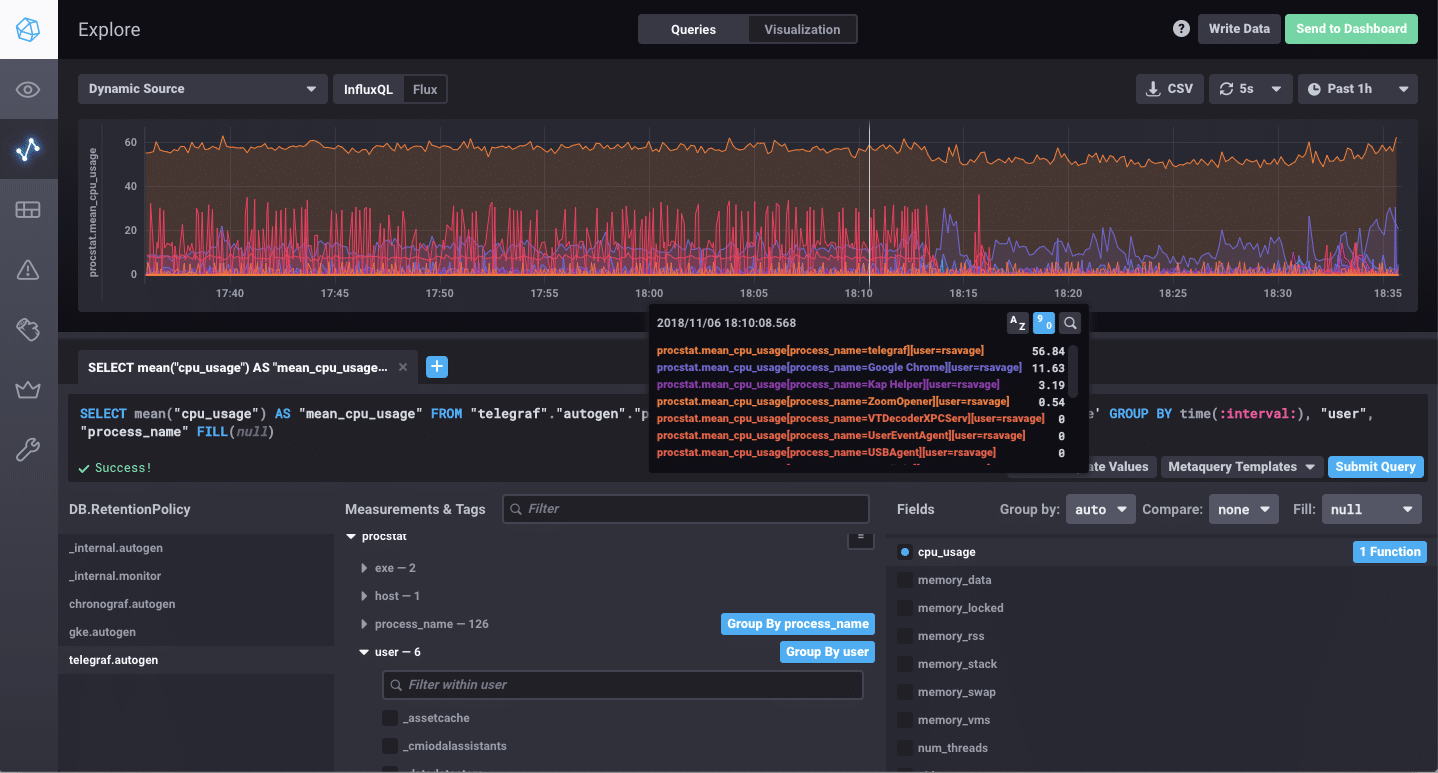
Explore Your Data and Send It Directly to Dashboards
The Data Explorer page has been completely overhauled with some great new features. You can now select any data source to run your query against without leaving the page, or you can choose a dynamic source, which is the data source Chronograf is currently connected to.
In addition, you can now also select any visualization type instead of just a line graph or a basic table. You can use the table graph type to explore tabular data without having to create a cell in a dashboard.
We’ve also added the ability to take the query you’ve been working on in the Explorer and publish it directly to one or multiple dashboards.
There are a ton of other smaller enhancements as well that make exploring your data much easier.
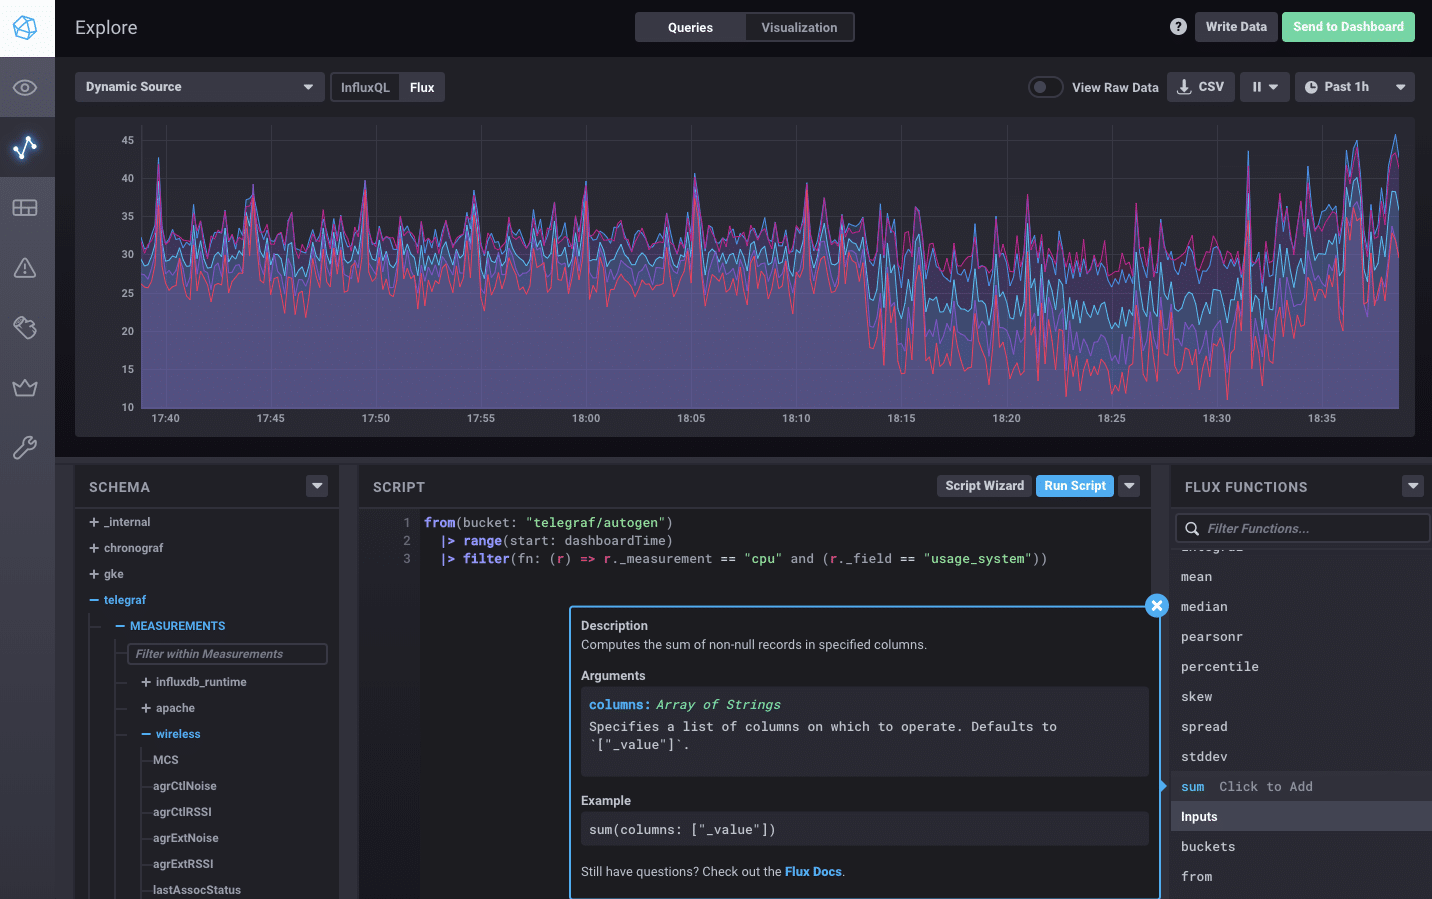
Full Flux Query Support for Exploration and Dashboards
For those of you using InfluxDB 1.7 and exploring the technical preview of Flux, we’ve added a corresponding technical preview of a completely dedicated Flux script builder to Chronograf which allows you to explore this powerful new language. We took all the great feedback received from our initial demos at InfluxDays London and incorporated it into a powerful builder.
There are a few ways to get started with building your first Flux query. The easiest way is to use the Script Wizard to select what you want to query. We build a starter script for you to modify as you get more comfortable with the language. The Schema window allows you to select the field you want to query and builds the Flux script for you.
Finally, once you’ve got the basics down, you can use the Function Explorer to discover other Flux functions and add them to your script.
One other really useful feature to take advantage of is the Raw Data view. This gives you a view of the annotated CSV data returned from your Flux query to give you an idea of how to transform your data.
Here’s a quick tip: You can submit a Flux query using the control + enter keyboard shortcut which triggers “Run Script”.
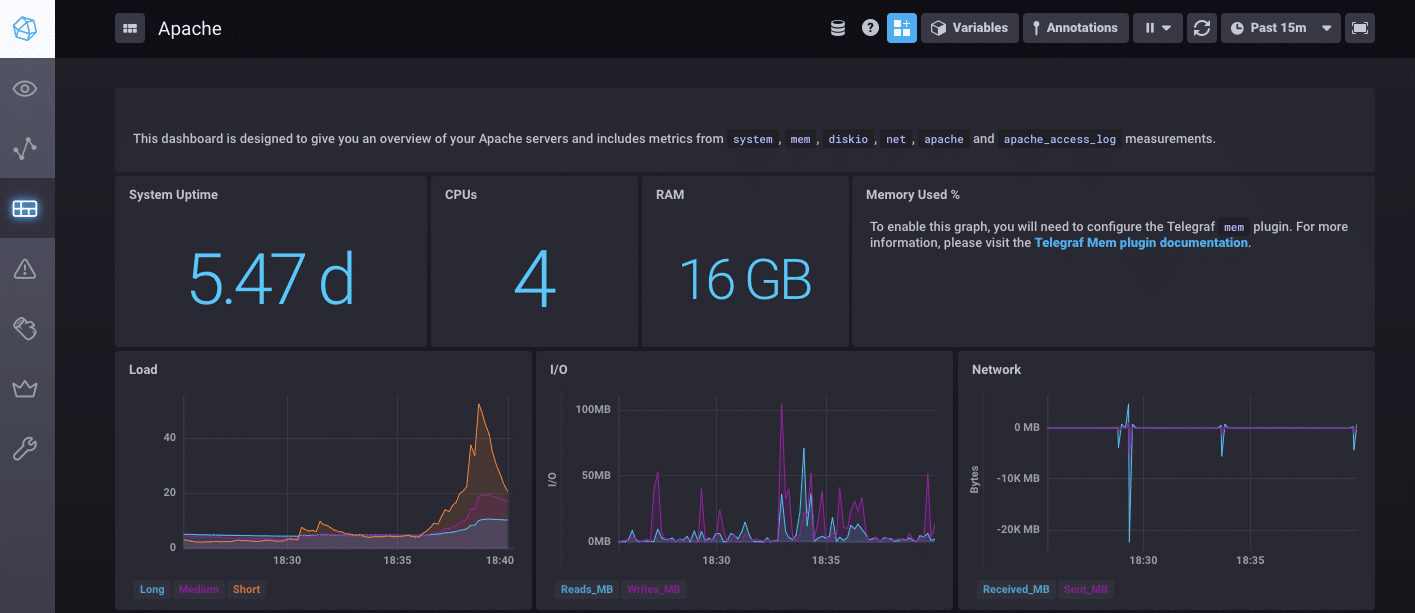
Notes on Dashboards and Scoped Annotations
Dashboards have a few new features as well. The first one is the ability to add notes to any dashboard cell in Chronograf. Notes can help others using your dashboard understand the data being queried, and more importantly, what to do if things go wrong. These notes support full Markdown syntax, which means you can link to other tools or even add images! In addition to adding notes to existing cells, we also have a Notes graph type that lets you just add text to your dashboards.
We’ve added the ability to scope annotations using the same tags as your data. This allows you to filter only annotations for a specific host, service, cluster, or any grouping you’d like. For dashboards which make use of template variables, this makes annotations significantly more useful. This is particularly true when multiple people are using the same dashboard, but are creating annotations based on different template variable values.
Wrapping Up
There are many other improvements to Chronograf including a faster, more powerful Log viewer, improvements to the Alert Rules page for switching between multiple Kapacitor instances, and much more.
Chronograf has an amazing community of users that provide valuable feedback to the team on the features we are building. This release adds some impressive new features to Chronograf while making some of the activities our users do every day much easier. We hope you’ll love this latest release of Chronograf, and we look forward to hearing from you on what we can make better.
