Table of Contents
I recently spoke with Jeremy White who is using InfluxDB to monitor his aquariums. By collecting IoT sensor data, he has been able to better understand his 200 gallon salt-water aquarium full of fish and coral. The entire project can be found on GitHub.
Caitlin: Tell us about yourself and your career.
Jeremy: I’m a Senior Network Automation Consultant at Network to Code, and my background is in networking engineering. Network to Code is an industry leader in network automation. I taught myself Python and Ansible, and I have built a full network automation framework. In addition to Python and Ansible, I’m familiar with Django REST frameworks, Flask and NetBox. I’m starting to dive into telemetry and analytics.
Caitlin: How did you learn about InfluxDB?
Jeremy: I have previously used InfluxDB at work. Some colleagues have used InfluxDB and Telegraf previously to monitor public DNS. They have also used InfluxDB, the purpose-built time series database, to monitor their home networks. Network to Code has implemented InfluxDB for various clients based on their needs. I was impressed with InfluxDB and thought it might be a great way to improve the monitoring of my saltwater aquarium.
Caitlin: Tell us about your aquariums.
Jeremy: I currently have two salt-water aquariums. One is 54 gallons and my new one is 200 gallons. I recently decided to upgrade to the 200 gallon aquarium. It’s definitely going to be a process moving all of my fish and coral to their new home. I need to ensure everything is stable and that it’s working the way I want it to.
I’m growing small polyp stony (SPS) coral. I have Acropora, Monitpora, Catalaphyllia, Lithophyllon, Discosoma, Zoanthus and Briareum corals. Many of these corals are found closer to the surface within coral reefs. They have a calcium-based skeleton with small polyps. These corals can be very vibrant and beautiful. I have a Staghorn coral which is a beautiful highlighter teal-bluish color.

Most of my coral is either aquaculture or mariculture. Aquaculture coral is grown in an aquarium or tank with artificial lighting. Mariculture coral is coral cultured in specifically designated farmed areas in the ocean. This means they are not pulling coral from native reefs. I’ve tried to make sure I’m as sustainable as possible. Most of the coral I have originated from Indonesia or Australia. I do have some coral fragments that are from someone who grew them in captivity for over 20 years.
Right now, I have a Coral Beauty Dwarf Angelfish, a Blue Hippo Tang, a Yellow Tang, a Yellow Watchman Goby, three Gladiator Clownfish, an Ocellaris Clownfish, a Copperband Butterflyfish and a Pixie Hawkfish. I also have a bunch of invertebrates including about 20 hermit crabs, roughly 20 snails, a Banded Serpent starfish, a Sand Sifting starfish, an Arrow crab and an Emerald crab.
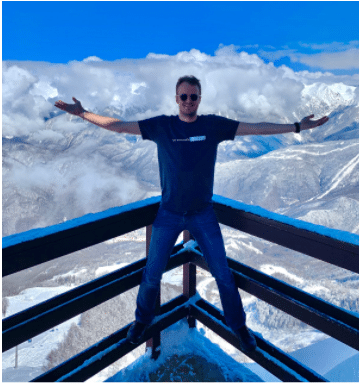
 <figcaption> 200-gallon saltwater aquarium monitored by InfluxDB</figcaption>
Caitlin: What were some of the challenges you were facing with your aquariums?
Jeremy: I knew I had proper lighting and proper water flow. However, I knew my corals weren’t growing at the rate that I thought I should be observing. There was minimal calcification on the SPS coral. They were alive and surviving, but they weren’t thriving. In addition to lack of growth, the coloration was off. Proper lighting provides the necessary energy for photosynthetic organisms like plants, animals, anemones and coral to survive. Lighting can also impact fish behavior and physiology.
The next aspect is water chemistry: I knew realistically that I was probably only going to check the status of the aquarium once a week. Having a bunch of individual tests that I’d have to run manually wasn’t going to happen as often as I’d like. I knew I needed to automate my monitoring solution to ensure I had the most recent accurate data about my aquarium.
It turns out my aquarium environment wasn’t as stable as I thought. Coral can survive in a wide range of water temperatures, and the pH of the water can vary. It’s more important that the levels stay consistent. Coral are very flexible creatures, so they are able to adapt and survive. Frequent fluctuations in their environment, like temperatures and salinity, can be very stressful for coral, and detrimental to their survival and growth.
Within three days of setting everything (my AquaPy controller) up, I started seeing results. I realized there is a two-degree temperature swing from day to night. As I work from home, I know that it isn’t because my house is getting too hot, as the temperature in my home is pretty consistent. A two-degree swing is pretty minimal, but it’s enough to impact the growth and color of my coral. After iterating with my setup (AquaPy), I got the temperature delta down to less than one degree. My tanks hover around the 79-81ºF mark. I want to minimize the difference as much as possible.
Caitlin: Tell us about the IoT monitoring solution you built using InfluxDB.
Jeremy: My whole stack is built using containers. I love containers! Whether it’s a work or personal project, If I can containerize it, I do. If there isn’t a prebuilt container, I’ll create one myself. I started off by purchasing sensors from Atlas Scientific. They make the IoT sensors and the small printed circuit board (PCB’s). The PCBs are used to read the data from the sensors using the I2C protocol within Raspberry Pi’s. There’s a company called Whitebox which makes a product called Tentacle T3 for Raspberry Pi which helps make the whole setup more plug-and-play.
I use Django to configure the sensors. Along with the Django admin portal, I’m using a django_rq worker, a Redis worker, to listen for the jobs as they come in. I’m using a Django Redis scheduler which is running crons and scheduling known jobs at its cron intervals. Right now, it’s scheduled for every minute. Every 60 seconds is the lowest interval you can set with the RQ scheduler.
The RQ scheduler is putting the job into Redis. Next, the RQ worker is actively listening to the Redis queue for the job. The RQ worker is communicating with a Postgres database to pull details needed about the job to allow it to execute and to collect the sensor data.
I have sensors pulling data on: water temperature, water salinity, water level and pH levels. My ideal pH level is 8.3. There is a bit of range due to carbon dioxide levels in the air and C02 created by the fish. On any given day, my tank pH ranges between 7.95-8.19.
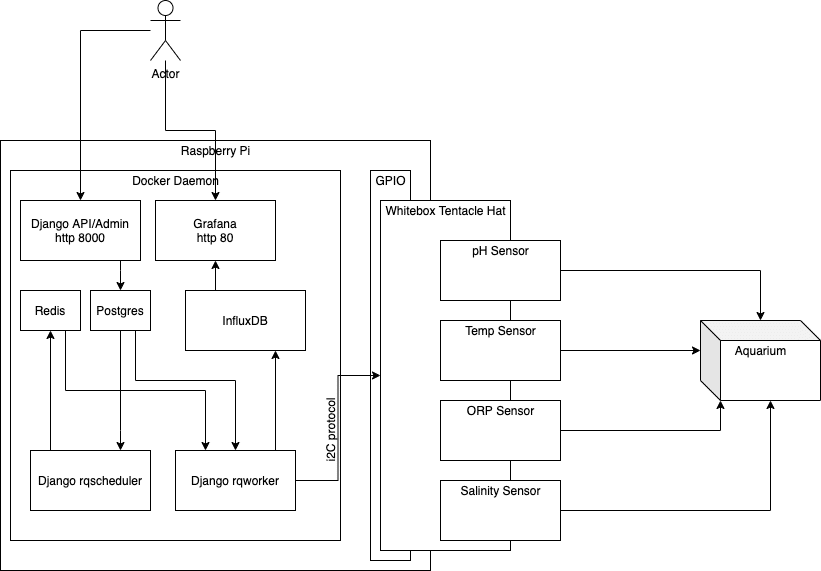 <figcaption> Aquarium IoT monitoring solution architecture diagram</figcaption>
Once collected, the data is stored in InfluxDB. After collecting and storing the telemetry data a new event job is added to the Redis queue for an rq worker to evaluate and action on the telemetry data accordingly.
I also have purchased home automation tools from WeMo, which is owned by Belkin. They’re pretty cool because they can be controlled within your home network using multicasts. Adding the WeMo switches to the stack gave me the ability to turn devices on and off based on the telemetry data collected. An example is when a high temperature threshold is met. The rq_worker pulls the event from the Redis queue and based on the event definition it knows exactly which Wemo device to call based on its MAC address. The rq_worker then sends a multicast message to the switch to toggle the power on or off and reports back the results to the Redis job status.
I also have another set of automation that is not directly integrated with the AquaPy, for instance I have an auto top off set up. It’s an optical sensor used to detect water level. If the water level drops too low, fresh water will automatically be added to the tank. Of course, adding too much fresh water the salinity would fall more than is acceptable. Simply adding an extra gallon of fresh water can stress the coral, and I could lose a colony. On the flip side, if there’s too much evaporation, the salinity level could become too high. If the water’s pH is skyrocketing, this could mean my doser is failing; the doser is responsible for adjusting the calcium and alkalinity. If the doser switch is stuck in the ON position, it will start dumping unnecessary chemicals into the tank. All of these factors can offset the balance of the tank.
Caitlin: After implementing InfluxDB, what did you learn about your aquariums?
Jeremy: Thanks to InfluxDB, I was able to set thresholds for temperature and other key metrics. If the water temperature rises above a certain level, I have a fan set up to automatically turn on. By automatically triggering the fan on, I’ve had less evaporation and the tanks have cooled down. As soon as the temperature has sufficiently dropped below the recovery threshold, the fan turns off automatically.
By monitoring my tank continuously, I know when something is amiss. A simple power outage can have a snowball effect on the health of my coral and tanks. Without power, the lights don’t work, which means the natural algae can’t convert the carbon dioxide back into oxygen. Even if the power is out for three hours, it could mean some of my coral could die. This is especially important if I’m introducing new pieces of coral to the tanks as they haven’t acclimatized to their new home.
I now have a UPS as a battery backup. It does help being a network engineer! ???? I now have enterprise-grade network equipment set up at home. Having spent a lot of time and money into my saltwater aquarium, I want to make sure I don’t lose anything. My internet connection, PoE network switch, router, firewall, etc. are all on separate UPSes. I recently moved, and while I don’t experience many power outages, there are still occasional brownouts.
I’m using Grafana to visualize and graph all of my data. Originally, I was using one of Grafana’s plugins to send me Slack alerts. Thanks to Slackbots, if I get a notification on my phone, I know to check it for an update.
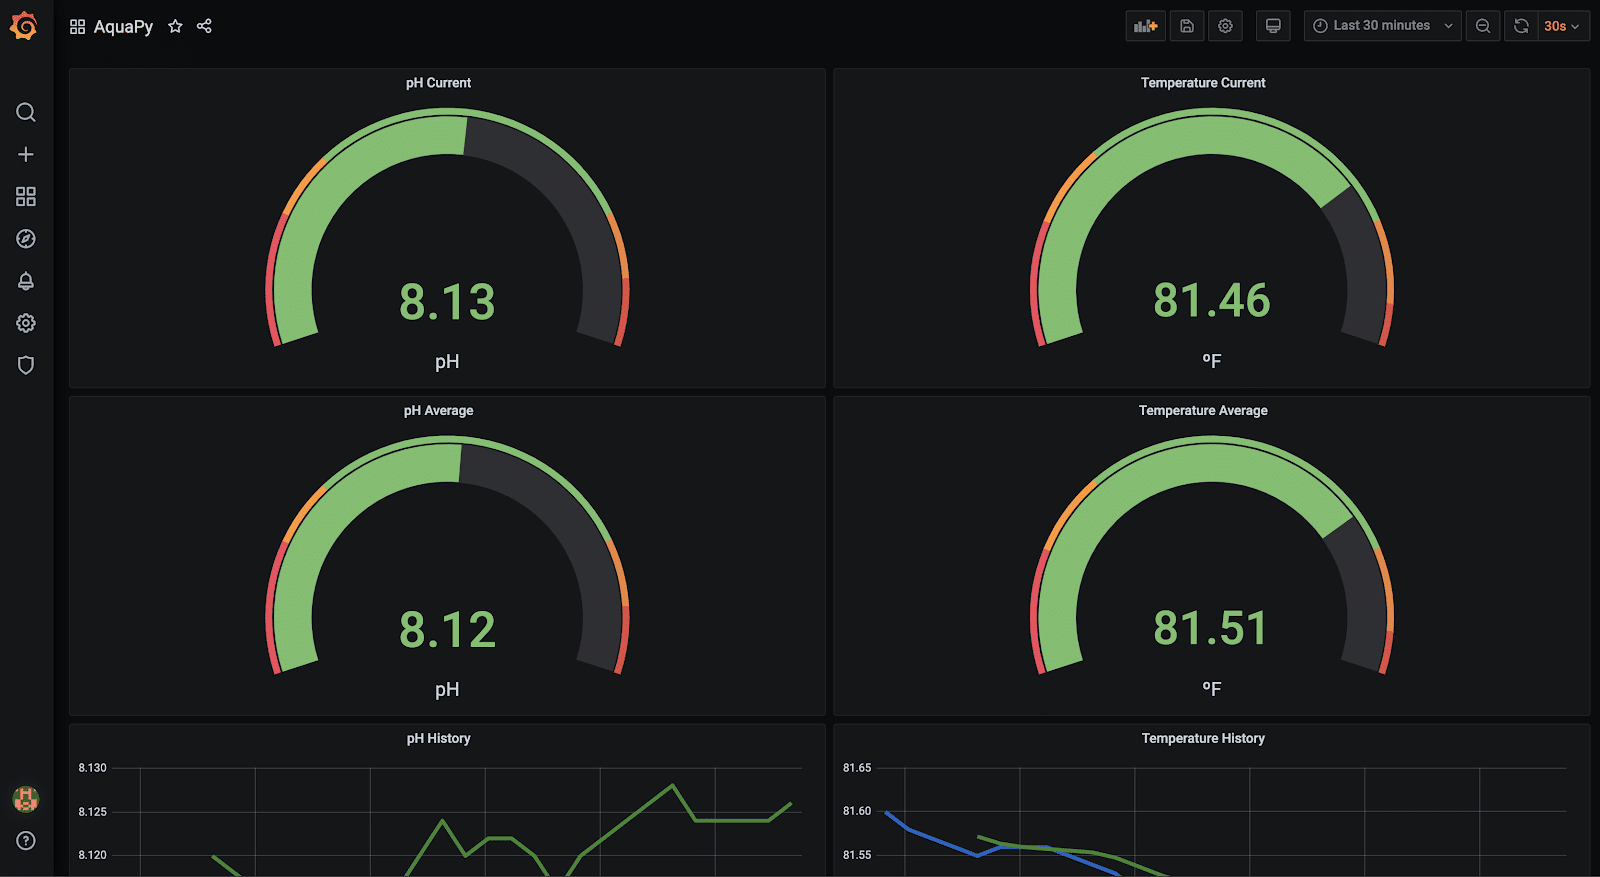 <figcaption> Grafana dashboard displaying aquarium sensor data</figcaption>
Caitlin: What are your future plans with your aquariums and InfluxDB?
Jeremy: As I run my tanks with higher levels of calcium and alkalinity, I want to create some form of controlled studies around home aquariums. I’d like to be able to demonstrate the benefits of running tanks at specific levels. Faster calcification of hard corals hasn’t been proven with controlled studies. There’s a company called Bulk Reef Supply who’s also working on short lived experiments. They are running different systems at various levels with the same coral for a few weeks to months and reporting results.
Once I get more data into InfluxDB, I’d like to start correlating my data. By having more time-stamped data, I’d like to set a baseline and determine a percentage deviation from baseline. I’d like to create these for all systems. As for right now, I’m not collecting metrics on threshold actions. These include when the fan turns on or off, time of day the dosing pump turns on, etc. My new aquarium lights are controlled via Bluetooth. In addition to adding all of this data into InfluxDB, I’d also like to incorporate the seasonal daylight times from Indonesia and northeast Australia better. As more of my coral is from there, I’d like to mimic the natural daylight cycle.
Long-term goals including helping the scientific community by helping improve the natural coral reefs. By improving the world’s growing coral in captivity practices, hopefully we can stop needing to go back to the natural reefs for coral. It would be amazing if we could aquaculture enough coral to give back to the natural coral reefs that we’re destroying as a society.
Here is a list of all of the parts I’m using:
- Raspberry Pi 4
- 64Gb SanDisk Micro SD
- Atlas Scientific i2c Toggler (needed to ensure EZO circuits are set to i2c)
- Atlas Scientific Temperature Kit (only using sensor and EZO circuit)
- Atlas Scientific Conductivity Probe K 0.1 ? 0.07-50,000 ?S/cm
- Atlas Scientific Lab Grade pH Probe
- Atlas Scientific Oxidation-Reduction Potential Lab Grade ORP Probe +/- 2000mV
- Atlas Scientific EZO-pH Circuit
- Atlas Scientific EZO-EC Embedded Conductivity Circuit 0.07 ? 500,000+ ?S/cm
- Atlas Scientific EZO-ORP Oxidation-Reduction Potential Embedded Circuit -1019.9mV-1019.9mV
- Whitebox Labs Tentacle T3 for Raspberry Pi
- Wemo Mini Smart Plug, WiFi Enabled, Works with Alexa, Google Assistant & Apple HomeKit
Do you have questions for Jeremy? Join us on September 23, 2020 for our virtual Time Series Meetup as he demonstrates how to use InfluxDB and Grafana to monitor your aquarium! RSVP today.
If you’re interested in sharing your InfluxDB story, click here.
For another interesting use case of Grafana and InfluxDB, read How to Integrate Grafana with Home Assistant.
