Table of Contents
If you keep up with the release announcements, you’ll have read about the new “Metrics First” Log Analysis addition to InfluxData stack. But knowing it’s there, and making it work, are two very different things so I thought I’d run through some basic steps to get your Telegraf instance pulling syslog data into InfluxDB. I’ve managed to get it working on both Mac OS and embedded Linux so far, so I’m going to assume that getting it up on a generic Linux will follow a similar pattern.
If you’re interested in following the discussion about getting this working on our Community Site, please head over here, or just keep reading.
MAC OS X
To start with, I’ll go through the Mac instructions, since I run Mac OS on a daily basis. If you’re running Linux, head on down to the Linux instructions. Here are the requirements:
Installing the requirements
- HomeBrew installed
- rsyslog installed via HomeBrew
Pretty straightforward. So let’s start with installing HomeBrew. In a Terminal window, enter the following command:
$ /usr/bin/ruby -e "$(curl -fsSL https://raw.githubusercontent.com/Homebrew/install/master/install)"That installs it. See how easy this is? Next, we’ll use HomeBrew to install rsyslog. Yes, Mac OS comes with syslog installed, but with the advent of the tighter security measures for Mac OS, it’s difficult to make syslog work properly, and installing rsyslog is easier and more straightforward. So, in the same terminal window, run:
$ brew install rsyslogAnd rsyslog is installed! Now on to configuration.
Configuring rsyslog
HomeBrew installs things in /usr/local, and configuration files typically go into /usr/local/etc - basically, HomeBrew prepends ‘usr/local’ to what would be a normal install location on other UNIX flavors. So our configuration file will be /usr/local/etc/rsyslog.conf. And we’ll need to edit it with superuser privileges, so if you’re a vi fan (like me) $ sudo vi /usr/local/etc/rsyslog.conf will do the trick. Here’s what you’ll add to that file:
$WorkDirectory /tmp/rsyslog # temporary directory for storing data
$ActionQueueType LinkedList # use asynchronous processing
$ActionQueueFileName srvrfwd # set file name, also enables disk mode
$ActionResumeRetryCount -1 # infinite retries on insert failure
$ActionQueueSaveOnShutdown on # save in-memory data if rsyslog shuts down
$ModLoad imudp #loads the udp module
#listen for messages on udp localhost:514 $UDPServerAddress localhost $UDPServerRun 514 *.*
@@(o)127.0.0.1:6514;RSYSLOG_SyslogProtocol23Format
You’ll need to restart rsyslog, so in your terminal, run:
$ sudo brew services restart rsyslogNow your rsyslog will be forwarding all its messages out to a TCP port, and that is where we’ll have Telegraf pick them up!
Linux
The linux instructions are much the same as the Mac OS X instructions thanks to the fact that Mac OS is just another Unix variant. We’re still going to use rsyslog, but on many Linux distributions, rsyslog is now the default, so we’re already close. The easiest way to tell is to simply look in /etc and see if you have a syslog.conf file or an rsyslog.conf file. If you don’t have an rsyslog.conf file, you’ll need to install it.
$ sudo apt-get install rsyslogwill get you there on Ubuntu and other Debian-based systems. If your Linux uses a different package manager like yum, etc. use that to install rsyslog.
Configuration
Like on Mac OS, we will need to add a few lines to the rsyslog.conf file, so using sudo and your favorite editor, add the following to your configuration file:
$WorkDirectory /tmp/rsyslog # temporary directory for storing data
$ActionQueueType LinkedList # use asynchronous processing
$ActionQueueFileName srvrfwd # set file name, also enables disk mode
$ActionResumeRetryCount -1 # infinite retries on insert failure
$ActionQueueSaveOnShutdown on # save in-memory data if rsyslog shuts down
$ModLoad imudp #loads the udp module
#listen for messages on udp localhost:514 $UDPServerAddress localhost $UDPServerRun 514 *.*
@@(o)127.0.0.1:6514;RSYSLOG_SyslogProtocol23Format
You will of course need to restart rsyslog to force it to read the new configurations file. If you’re on a Linux variant that supports systemd, then
$ sudo systemctl restart rsyslogwill do the trick. If you’re not, you can always simply run
$ ps -elf | grep syslogAnd issue a kill -HUP PID for the process ID you get back. Your rsyslog should now be publishing syslog messages to the TCP port and we can move on to configuring Telegraf.
Configuring Telegraf
First, note that you will need to have the latest version of Telegraf which, at the time of this post, is v1.7. If you’re not sure what version of Telegraf you have installed then
$ telegraf --versionwill tell you.
Now you’ll go into your telegraf.conf file (on Linux it’s typically in /etc/telegraf and on Mac OS it’s typically in /usr/local/etc/telegraf) and uncomment the following lines:
# # Accepts syslog messages per RFC5425
 [[inputs.syslog]]
#   ## Specify an ip or hostname with port - eg., tcp://localhost:6514, tcp://10.0.0.1:6514
#   ## Protocol, address and port to host the syslog receiver.
#   ## If no host is specified, then localhost is used.
#   ## If no port is specified, 6514 is used (RFC5425#section-4.1).
 server = "tcp://localhost:6514"
If you have kept an older version of your configuration file when you upgraded, you can just add those lines to the file.
Now restart Telegraf and you should be getting log files in your database. From the command line:
$ influx
> use telegraf
Using database telegraf
> show measurements
...
syslog
...
You now have syslog data in your database! Great! But what good is it?
Visualizing Your Log Data
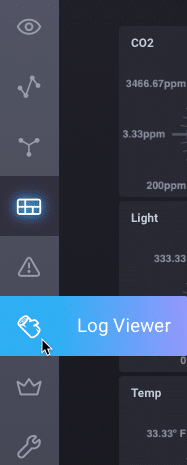
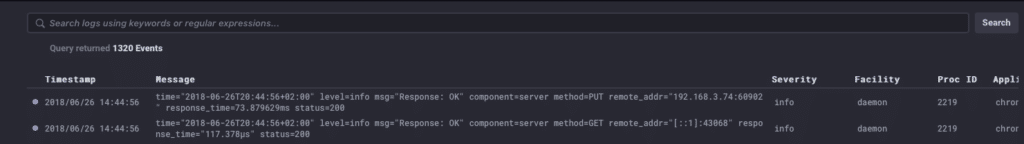
Now that you have your syslog data going into InfluxDB, what can you do with it? Well, if you’re brave, you can install the nightly build of Chronograf and use the Log viewer in there to watch your logs go by, and drill down into them:
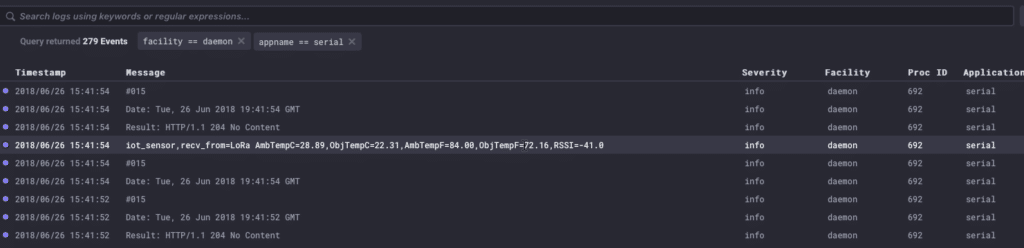
I can easily see all the log events from my serial daemon process by simply clicking into them to filter:
So, the question is, what will you be able to do now that you can visualize your syslog data in Chronograf?
