How to Monitor Your Modbus Devices with InfluxDB
By
Samantha Wang
updated December 14, 2025
Product
Use Cases
Developer
Navigate to:
We released a new Modbus input plugin in Telegraf 1.14 and in this blog I’d like to tell you more about that plugin and how you can use it.

What is Modbus?
Modbus is a messaging protocol for industrial devices that was developed by Modicon (now Schneider Electric) for main-secondary communication between these intelligent devices. It has become an ideal protocol for remote terminal units (RTUs) where wireless communication is necessary. Modbus is open and free for manufacturers to build into their equipment without having to pay any royalties. The Modbus protocol is now controlled by Modbus.org, a US nonprofit trade association.
Where is Modbus used?
Since the Modbus is a royalty-free, open protocol, it has become one of the most widely used network protocols in the industrial manufacturing environment. Modbus has been implemented by hundreds of vendors on thousands of different devices to transfer discrete/analog I/O and register data between control devices. Over 7 million Modbus nodes have been reported by industry analysts in just North America and Europe.
How do I retrieve data from my IoT devices that use Modbus?
A little background from Simply Modbus on how data is stored in standard Modbus. The secondary device stores information in 4 different tables: two tables store on/off discrete values (coils) and two store numerical values (registers). The coils and registers each have a read-only table and read-write table with a maximum of 9999 values. Coil/Register Numbers can be thought of as location names since they do not appear in the actual messages; their data addresses are used in the messages.
| Object type | Access | Size | Address Space |
| Coil | Read-write | 1 bit | 00001 - 09999 |
| Discrete input | Read-only | 1 bit | 10001 - 19999 |
| Input register | Read-only | 16 bits | 30001 - 39999 |
| Holding register | Read-write | 16 bits | 40001 - 49999 |
You might be wondering: What’s the difference between Modbus coils and discrete inputs? Coils can be read or written, while discrete inputs are read-only. Coils are usually associated with relay outputs.
You may also ask: What’s the difference between Modbus input registers and holding registers? Input registers are read-only, while holding registers can be read or written.
You can use the Telegraf Modbus Input Plugin to collect the data from Discrete Inputs, Coils, Input Registers and Holding Registers via Modbus TCP or Modbus RTU/ASCII. Like most Telegraf plugins, the Modbus input plugin does not require exhaustive configuration.
To take advantage of the Modbus plugin, you need to determine the metrics that you wish to collect from your device by configuring the digital variables from your discrete_inputs and coils. This is done by configuring their variable name (name) and variable address (address). As for the analog variables, the name, byte_order, data_type, scale, and address need to be configured for each metric you are collecting from your holding_registers and input_registers.
Below is a sample configuration for the Modbus Input Plugin that can be used in Telegraf to retrieve Modbus metrics.
[[inputs.modbus]]
  ## Connection Configuration
  ##
  ## The module supports connections to PLCs via MODBUS/TCP or
  ## via serial line communication in binary (RTU) or readable (ASCII) encoding
  ##
  ## Device name
  name = "Device"

  ## Slave ID - addresses a MODBUS device on the bus
  ## Range: 0 - 255 [0 = broadcast; 248 - 255 = reserved]
  slave_id = 1

  ## Timeout for each request
  timeout = "1s"

  ## Maximum number of retries and the time to wait between retries
  ## when a slave-device is busy.
  # busy_retries = 0
  # busy_retries_wait = "100ms"

  # TCP - connect via Modbus/TCP
  controller = "tcp://localhost:502"

  ## Serial (RS485; RS232)
  # controller = "file:///dev/ttyUSB0"
  # baud_rate = 9600
  # data_bits = 8
  # parity = "N"
  # stop_bits = 1
  # transmission_mode = "RTU"

  ## Measurements
  ##

  ## Digital Variables, Discrete Inputs and Coils
  ## name    - the variable name
  ## address - variable address

  discrete_inputs = [
    { name = "Start",          address = [0]},
    { name = "Stop",           address = [1]},
    { name = "Reset",          address = [2]},
    { name = "EmergencyStop",  address = [3]},
  ]
  coils = [
    { name = "Motor1-Run",     address = [0]},
    { name = "Motor1-Jog",     address = [1]},
    { name = "Motor1-Stop",    address = [2]},
  ]

  ## Analog Variables, Input Registers and Holding Registers
  ## measurement - the (optional) measurement name, defaults to "modbus"
  ## name       - the variable name
  ## byte_order - the ordering of bytes
  ##  |---AB, ABCD   - Big Endian
  ##  |---BA, DCBA   - Little Endian
  ##  |---BADC       - Mid-Big Endian
  ##  |---CDAB       - Mid-Little Endian
  ## data_type  - INT16, UINT16, INT32, UINT32, INT64, UINT64, FLOAT32, FLOAT32-IEEE (the IEEE 754 binary representation)
  ## scale      - the final numeric variable representation
  ## address    - variable address

  holding_registers = [
    { name = "PowerFactor", byte_order = "AB",   data_type = "FLOAT32", scale=0.01,  address = [8]},
    { name = "Voltage",     byte_order = "AB",   data_type = "FLOAT32", scale=0.1,   address = [0]},
    { name = "Energy",      byte_order = "ABCD", data_type = "FLOAT32", scale=0.001, address = [5,6]},
    { name = "Current",     byte_order = "ABCD", data_type = "FLOAT32", scale=0.001, address = [1,2]},
    { name = "Frequency",   byte_order = "AB",   data_type = "FLOAT32", scale=0.1,   address = [7]},
    { name = "Power",       byte_order = "ABCD", data_type = "FLOAT32", scale=0.1,   address = [3,4]},
  ]
  input_registers = [
    { name = "TankLevel",   byte_order = "AB",   data_type = "INT16",   scale=1.0,     address = [0]},
    { name = "TankPH",      byte_order = "AB",   data_type = "INT16",   scale=1.0,     address = [1]},
    { name = "Pump1-Speed", byte_order = "ABCD", data_type = "INT32",   scale=1.0,     address = [3,4]},
  ]
*Note: We have reached out to the Modbus organization to rename the master/slave terminology so it can be updated in the Telegraf configuration.
What metrics are collected via the Telegraf Modbus plugin?
Metrics collected from the Modbus input plugin are custom and configured using the discrete_inputs, coils, holding_register and input_registers options in the example above.
Tags:
The tags in the Modbus plugin will return the device name labeled as host.
Fields:
In the example configuration above, the fields collected are as follows and dependent upon what is set in the holding_registers and input_registers options.
From holding_registers configuration:
PowerFactorVoltageEnergyCurrentFrequencyPower
From input_registers configuration:
TankLevelTankPHPump1-Speed
What's an easy way to get Modbus monitoring up and running with InfluxDB?
InfluxDB 2.0 recently launched InfluxDB templates prepackaged InfluxDB configurations that contain everything from dashboards and Telegraf configurations to notifications and alerts in a single manifest file. InfluxDB Templates allow you to get a fresh instance of InfluxDB set up quickly and create reusable templates for common setups.
Ray Farias contributed a Modbus template for Island Pulse Monitoring. This InfluxDB Template can be used to gather data from a Modbus device.
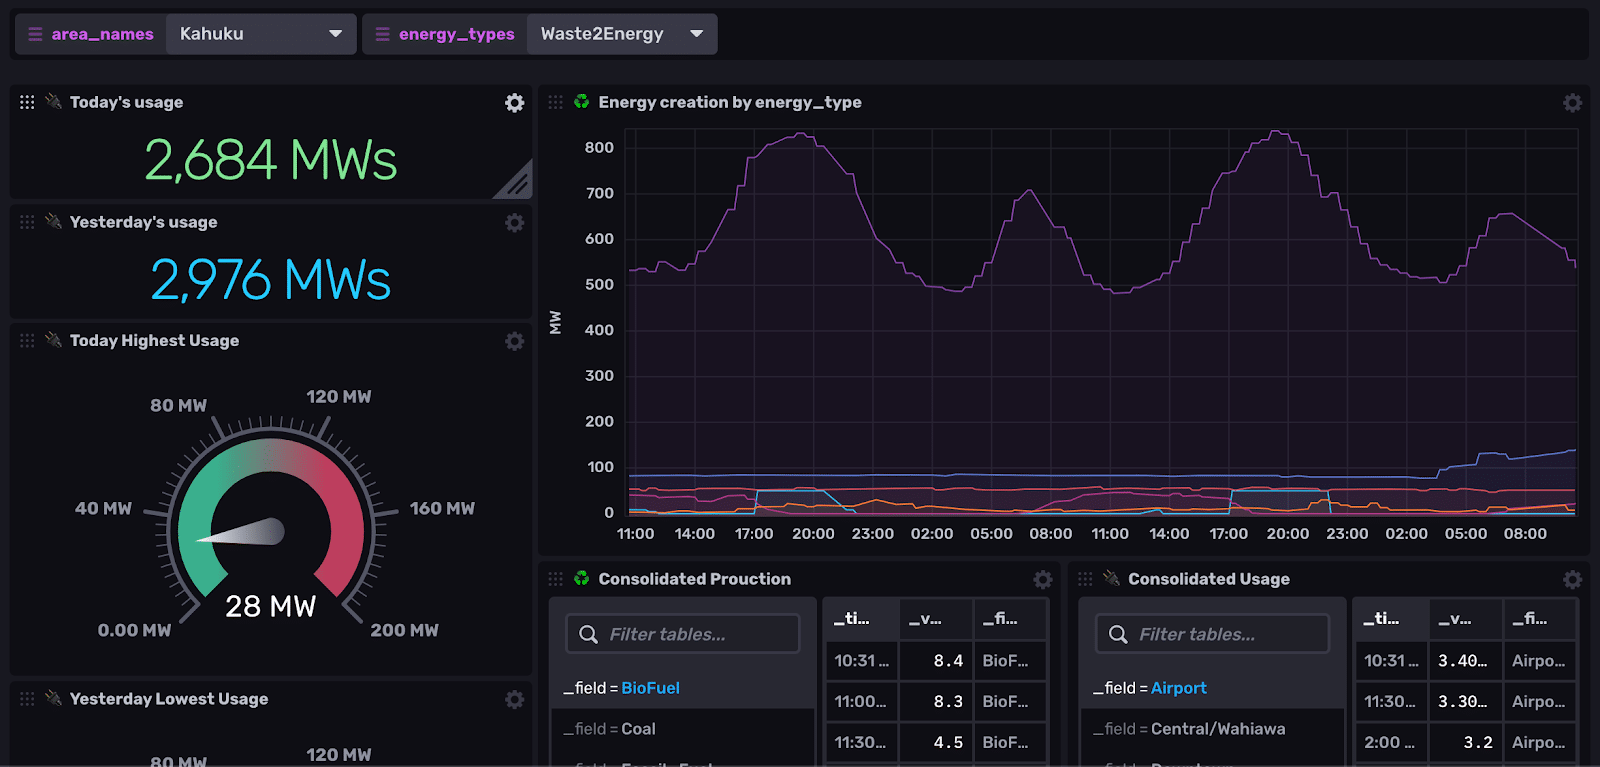 <figcaption> Island Pulse Monitoring Dashboard included in the InfluxDB Template</figcaption>
The template includes an Island Pulse Demo Modbus Device repository for a working demo device you can use to explore the InfluxDB Template and/or the Modbus Telegraf Input Plugin.
Get started with InfluxDB and Modbus!
Lastly, a big thanks to Antonio Garcia who contributed the Modbus Input Plugin and Ray Farias for the first InfluxDB Template that leverages it! InfluxData would not be where it is today without contributors like Antonio and Ray.
If you or your company are looking for a way to monitor your Modbus devices, try out everything you read in this Telegraf plugin. We’d love to hear how you’re monitoring Modbus using this plugin or any other InfluxData products. Join our Community Slack Channel where you can ask questions and engage with other people using InfluxDB.
