Table of Contents
If you’ve been following along with my Flux journey as I implement Flux queries with Rails and GraphQL, you’ll know that I’ve been using train data when implementing various functions in Flux. In order for the GraphQL gem in my Rails project to work properly (it calls a method on an object for each of the attributes), I need to create a Ruby object for each train data point that has each of my tags and fields separated out into their own attributes, like so:
class Train
   attr_reader :time, :measurement, :driver, :location, :train, :outdoor_temp, :speed, :track_temp

   def initialize(train)
      @time = train["_time"]
      @measurement = train["_measurement"]
      @driver = train["driver"]
      @location = train["location"]
      @train = train["train"]
      @outdoor_temp = train["outdoor_temp"]
      @speed = train["speed"]
      @track_temp = train["track_temp"]
   end

end
Without the right Flux function, when I query my database to return train data points, my tags will be separated out into their own columns, but my fields will be aggregated into a single column, _field. My data won’t be shaped the way I want it to be with a base query, as you can see below with the following query, and the result it returns:
from(bucket: "trains")
    |> range(start: -60d)
    |> filter(fn: (r) =>
        r._measurement == "train_speed"
    )
    |>group(columns: ["driver"])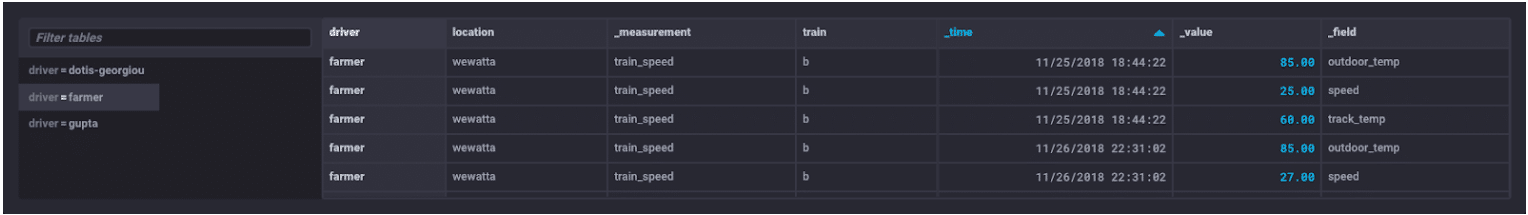
Do I have to write code to re-shape the data? That doesn’t seem right. So how can I make a clean Ruby object if I can’t extract the fields into their own columns for easier parsing? The pivot function allows me to do just that.
Flux provides a pivot function which allows you to re-shape data that exists in a single column into multiple columns, thus ensuring that your data is returned from the query engine in a way which is easier to use without actually changing the underlying data itself. Where you would normally be resigned to a predetermined set of columns and rows, pivot allows you to designate how data should be organized and displayed and can make it easier to read and directly use without having to write additional application code. Let’s take a look at how it works. From the docs:
The output is constructed as follows:
- A new row is created for each unique value identified in the input by the rowKey parameter.
- The initial set of columns for the new row is the row key unioned with the group key, but excluding columns indicated by the columnKey and valueColumn parameters.
- A set of value columns are added to the row for each unique value identified in the input by the columnKey parameter. The label is a concatenation of the valueColumn string and the columnKey values using _ as a separator.
- For each row key + column key pair, the appropriate value is determined from the input table by the valueColumn. If no value is found, the value is set to null.
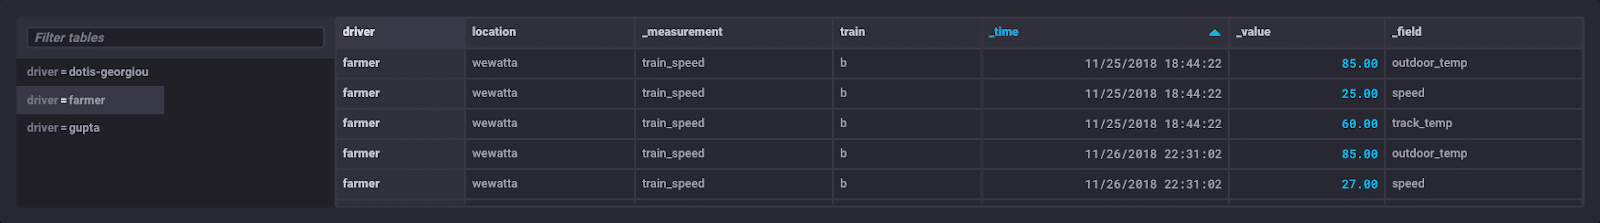
To explore the pivot function, I used InfluxDB v1.7 with Flux technical preview (but the workflow is the same for the v2.0 Alpha release). First, I seeded a bucket named trains with data points containing train data using the write endpoint. The measurement is train_speed. The tags are driver, location, and train. The fields are outdoor_temp, speed, and track_temp. I would like to see all of my fields broken out into their own columns, rather than aggregated in a single column, so that I can make a clean Ruby object as I mentioned above. As a reminder, here is a sample of the data shape I’m starting with, grouped by driver, where you can see that my fields are all aggregated into a single column, _field:
The table visualization for the above grouping by driver was achieved using the following query:
from(bucket: "trains")
    |> range(start: -60d)
    |> filter(fn: (r) =>
        r._measurement == "train_speed"
    )
    |>group(columns: ["driver"])
In this query, I’m fetching data from my trains bucket, setting a range of the last 60 days (setting a time range is required in Flux), and asking for the broadest possible filter, the measurement. Then I group my data by driver to see all of the available data associated with each driver. This is about as broad of a filter as you can create, and it probably isn’t wise to use on a large dataset, but it’s useful to illustrate at a high level what filtering does.
As a result of this query, my measurement and tags all get sorted into their own columns, but all of my fields are collected together in the same _field column. I can confirm this by looking at the raw data output in the UI, which is useful for confirming whether or not I’m getting the data shape I want. What if I want a table where I see all of those fields separated out into their own columns? I can run the following query to implement the pivot function:
from(bucket: "trains")
|> range(start: -60d)
|> filter(fn: (r) =>
r._measurement == "train_speed"
)
|>group(columns: ["driver"])
|> pivot(
rowKey:["_time"],
columnKey: ["_field"],
valueColumn: "_value"
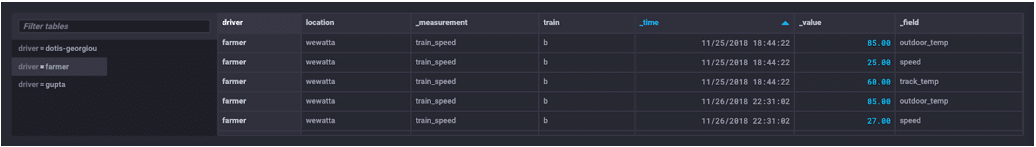
)This query returns a result that looks like this:
You can see that each of my fields now has its own column, but I no longer see my measurement or tags. What if I want to see those fields separated out into their own columns while still grouping by driver and retaining rows for the measurement and tags? Unless those original columns are present in the group function or in the rowKey, they will be dropped. So I can implement the pivot function to ensure that every field will have its own column by setting its columnKey value to _field and setting my rowKey to contain not only _time but also location, train, and _measurement:
from(bucket: "trains")
|> range(start: -60d)
|> filter(fn: (r) =>
r._measurement == "train_speed"
)
|>group(columns: ["driver"])
|> pivot(
rowKey:["_time", "location", "train", "_measurement"],
columnKey: ["_field"],
valueColumn: "_value"
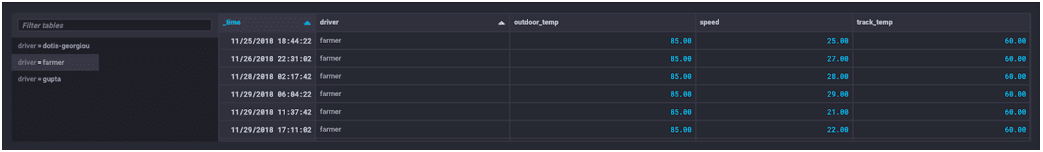
)This query returns a result that looks like this:
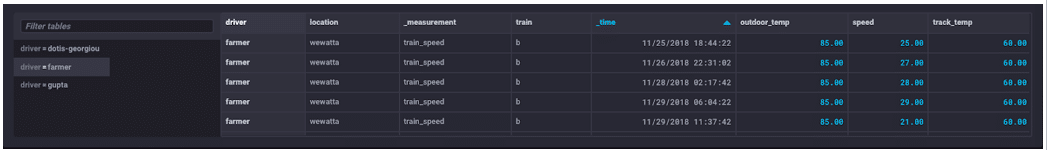
I now have my fields broken out into their own columns and have also retained my measurement and tags as row keys. As a reminder, this is what I started with:
Later we’ll see what happens when we add additional values to the columnKey array.
But what if I need to sort the data according to the values which existed at a particular timestamp? You can modify the pivot as shown below:
from(bucket: "trains")
    |> range(start: -60d)
    |> filter(fn: (r) =>
        r._measurement == "train_speed"
    )
    |>group(columns: ["driver"])
    |> pivot(
        rowKey:["_field", "location", "train", "_measurement"],
        columnKey: ["_time"],
        valueColumn: "_value"
      )
By making _time my columnKey, and _field a rowKey, I’m now able to produce data that looks like this:
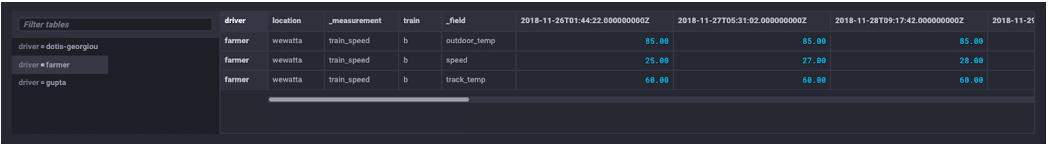
I now have a row for each of my fields and a column for each timestamp. Scrolling to the right allows me to see all the timestamps with their various row values.
Another useful pivot allows you to have each of the tags appear in the column name along with the field, which increases readability by allowing you to have more specific column names. This can come in handy if you have multiple values for a particular tag, but should be used with caution if you have a lot of different possible values for a tag. You can run the following query:
from(bucket: "trains")
|> range(start: -60d)
|> filter(fn: (r) =>
r._measurement == "train_speed"
)
|>group(columns: ["driver"])
|> pivot(
rowKey:["_time", "location", "_measurement"],
columnKey: ["_field", "train"],
valueColumn: "_value"
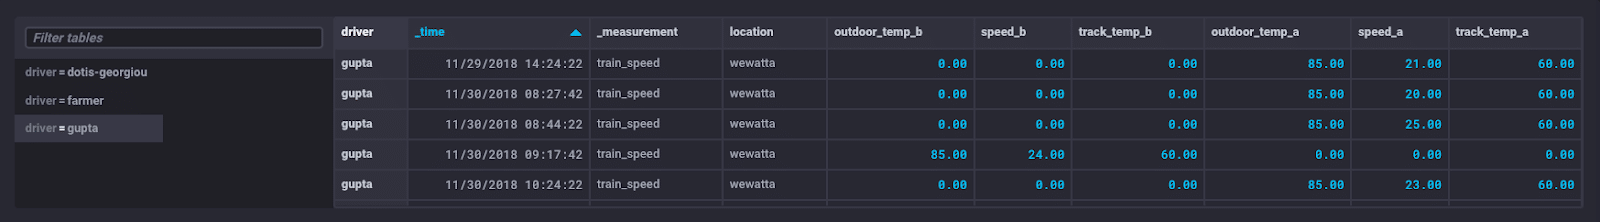
)This query produces a result where driver Gupta has driven both train a and train b. You get separate columns with all possible train values (there are only two, so this query isn’t resource intensive) included in the column names, and separated from the field key by an underscore:
So now you have an idea of how pivot works in Flux. It’s a useful function for returning data in a different format than that prescribed by default constraints. There are a number of different ways you can implement the function, and I find it useful to experiment with changing the values in the rowKey and columnKey arrays to see how data is returned differently. I encourage you to do the same, and to enjoy playing around with all of the functionality offered in Flux!

