InfluxDB for Google Cloud Monitoring
#1
Time Series Database
Source: DB Engines
1B+
Downloads of InfluxDB
Take the complexity out of time series data management
Try InfluxDBTurn high-volume, high-velocity, high-resolution time series data into actionable intelligence without sacrificing performance.
Get high-speed ingestion, real-time querying, and seamless scalability in a highly performant time series database that can handle unlimited volumes of time series data, even as data complexity and cardinality increases.
Run InfluxDB at scale in any environment in the cloud, on-premises, or at the edge. InfluxDB consists of the core database and storage engine, an API, and an ecosystem of tools and integrations to manage time-stamped data. Easily integrate with 5K+ prebuilt connections using Telegraf, our open source agent with 5B+ downloads.
Run InfluxDB 3 where you need it
Start for free, scale in seconds
Start NowFor small workloads and getting started
Deploy anywhere: on-prem, private cloud, edge, or multi-tenant cloud.
Secure, dedicated cloud infrastructure
Run a Proof of ConceptFor scaled workloads
Fully-managed, single-tenant service with unlimited scale, high availability, secure private connections, and enhanced Support.
Own your data with enterprise features
Run a Proof of ConceptFor scaled workloads
Control your infrastructure with unlimited scale, high availability, enterprise-grade security, and enhanced Support. On-prem, private cloud, and edge deployment.
Why InfluxDB
Limitless data collection
Ingest and analyze millions of time series data points per second without limits or caps.
Predict and prevent
Maximize uptime and prevent costly failures with real-time monitoring and preventative insights.
Real-time query
Data is immediately available for querying in InfluxDB, enabling real-time SQL queries and lightning-fast responses.
Why Google Cloud Monitoring?
Google Cloud Monitoring with InfluxDB provides visibility into the performance, uptime, and overall health of your Google Cloud-powered applications cost-effectively and at cloud scale.
What is the InfluxDB Google Cloud monitoring solution?
The presence of InfluxDB Cloud on GCP means that customers have ready-to-use access to the industry’s leading time series and data analytics platform for real-time decision-making. InfluxDB is easy and straightforward—your data can start producing value on day one.
Having InfluxDB as part of the menu of the integrated application infrastructure and services is powerful for customers migrating to data-driven workflows. That’s because InfluxDB is not only a purpose-built time series database—it is a platform for ingesting, processing, visualizing, and analyzing time series data—the central nervous system for acquiring and serving time series data to and from various application systems and frameworks.
With InfluxDB Cloud on GCP, customers can address a wide range of use cases.
Get broad insight and act in real time Monitor all infrastructure metrics, custom application metrics, K8s annotations, and logs from one pane. Multiple data collection options and comprehensive view of infrastructure, containers and application status are fundamental to keeping services running without degradations or escalating issues that could lead to outages.
Automate workflows and provisioning Intelligent triggers integrated with auto-remediation unload the burden from IT Ops teams, and help them focus on struggling services and potential breakpoints before they impact user experience.
Monitor and optimize the user experience Synthetic or real user traffic can monitor user experience to keep it consistent and optimal, which translates to higher conversion and retention rates.
Integrated with Google services and products
InfluxDB’s plugin-based (300+) collector agent Telegraf—together with its RestAPI, client libraries, and real-time streaming engine—provide a foundation for integrations with legacy and modern applications and data pipelines.
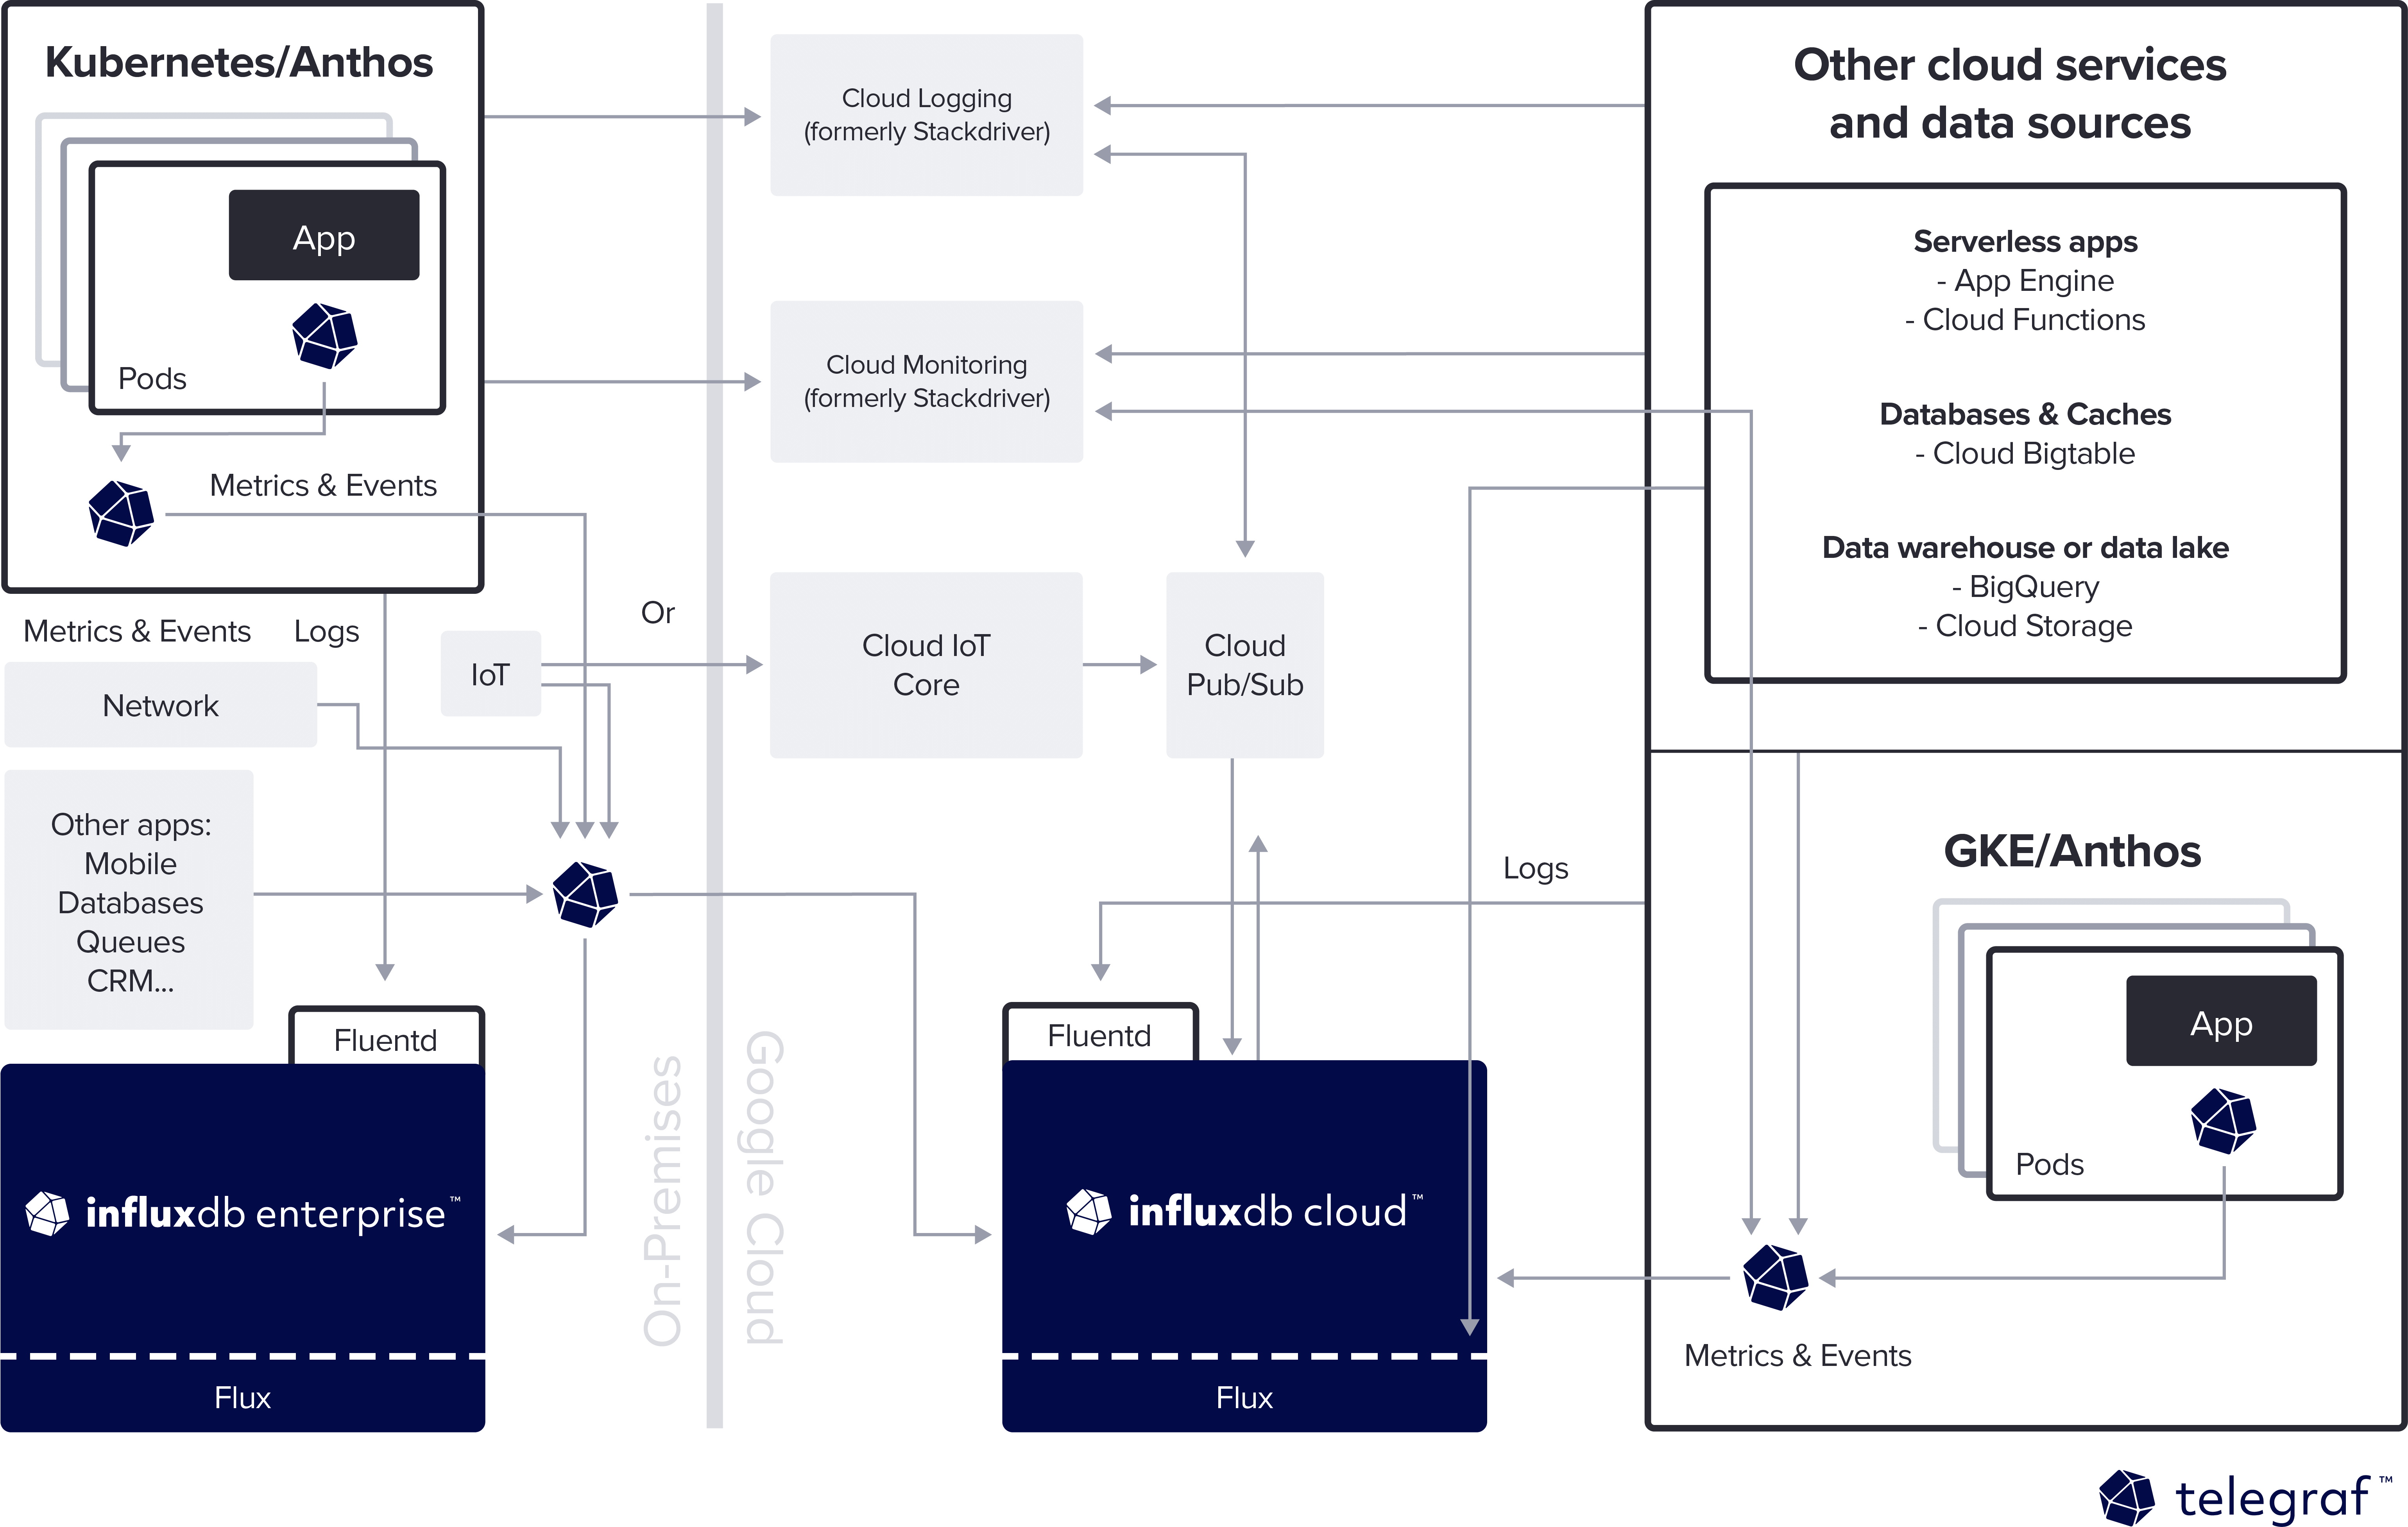
- PubSub Integration: Telegraf can be configured as a pull or push subscription on Google Cloud Pub/Sub via the PubSub Plugin and PubSub Push plugin. Telegraf can also send data from InfluxDB to be published to a topic on Google Cloud Pub/Sub service using its Pubsub Output Plugin. From Cloud Pub/Sub, the data can be consumed in the Google Cloud ecosystem, such as Stackdriver Logging, Dataflow, BigQuery, Bigtable, Cloud Storage, App Engine, Compute Engine, etc.
- Google Kubernetes Engine (GKE) & Anthos Integration: The InfluxDB platform provides a comprehensive solution to fully monitor Kubernetes components: control plane, add-on services, and node clusters. Telegraf Kubernetes plugin talks to Kubelet API and gathers metrics on pods and containers running on a host. Telegraf’s Kube Inventory plugin gathers metrics derived from the state of Kubernetes resources at cluster level, such as daemonsets, deployments, nodes, pods, containers, etc. And there’s the Telegraf Prometheus plugin, which gathers metrics from applications and services exposing metrics in Prometheus format (/metrics endpoint). Telegraf can be deployed as a DaemonSet in the same fashion as Prometheus’ Node Exporter to collect metrics at node level or as a sidecar collecting metrics and events from applications and services running on containers in a pod. All metrics and logs from the Anthos application platform collected by Stackdriver monitoring and logging services can be sent to InfluxDB Cloud for unified visualization, root cause analysis, and alerting.
- Cloud Build Integration: Telegraf can monitor containers used by Google Cloud Build with Docker plugin and Docker Log plugin.
- Compute Engine: Telegraf can monitor virtual machines spun up by Google Compute Engine, using its monitoring plugins to capture metrics for server CPU, disk, memory, network, processes, swap, and system uptime. Telegraf can use its vast menu of application plugins to monitor also the custom applications running on GCP virtual machines as well as common application components such as NGINX, Apache Web server, MySQL, PostgreSQL, Cassandra, etc.
- IoT Core: Telegraf integrates with Google IoT Core via Pub/Sub push integration, from which it can ingest metrics from devices and sensors. Additionally, Telegraf can consume MQTT topics using its MQTT input plugin and output data to MQTT.
InfluxDB Cloud on GCP makes it easy and painless to become a data-centric organization while keeping the organization’s data fluid, buildable, and increasingly valuable.
See below a diagram of how InfluxDB offers observability on-premises and in the cloud:
Related resources for developers
Open data standards drive performance and interoperability
InfluxDB 3 is built in Rust and the FDAP stack—Flight, DataFusion, Arrow, and Parquet—leveraging Apache-backed technologies to efficiently ingest, store, and analyze time series data at any scale.
Try InfluxDBF
Flight for efficient columnar data transfer
D
DataFusion for high-performance querying

A
Arrow for optimized in-memory columnar analytics

P
Parquet for high-compression storage
InfluxDB’s columnar database supports time series data at a lower TCO
See ways to get started

Loved by developers, trusted by enterprises

65M+
daly events processed
45x
more resource efficient
Siemens Energy
"[We] long used InfluxDB open source... Moving to commercial InfluxDB was a strategic move to unify our data infrastructure, ensuring we have the reliability, scalability, and real-time performance to keep pace with production... and proactive maintenance."
Jan Petersen
Senior Manufacturing Engineer
500M+
Metrics collected daily
Mission-critical monitoring
Real-time data access for queries
LOFT ORBITAL
Space Made Simple: How Loft Orbital Delivers Unparalleled Speed-to-Space with InfluxDB Cloud
Read Case Study65M+
daly events processed
45x
more resource efficient
CAPITAL ONE
"InfluxDB is a high-speed read and write database. The data is written in real-time, you can read it in real-time, and while reading, you can apply your machine learning model. So, in real-time, you can forecast and detect anomalies."
Rajeev Tomer
Sr. Manager of Data Engineering
50%
lower total cost of ownership
100K
real-time metrics with simplified deployment
TERÉGA
Teréga Replaced Its Legacy Data Historian with InfluxDB
Lorem ipsum
Lorem ipsum dolor sit amet consectetur.
65M+
daly events processed
45x
more resource efficient
WIDEOPENWEST
"I was blown away with how easy it was to install and configure InfluxDB. The clustering was easy. The documentation was great, and the support has been second to none."
Dylan Shorter
Engineer III, Software and Product Integration Engineering
45%
Less equipment downtime
10%
Reduced waste
MAJIK SYSTEMS
From Reactive to Proactive: How MAJiK Systems Embraced Predictive Maintenance with InfluxDB and Time Series Data
Dylan Shorter
Engineer III, Software and Product Integration Engineering
65M+
daly events processed
45x
more resource efficient
JU:NIZ ENERGY
"With InfluxDB Cloud Dedicated, the great thing is that we don't need to think about data storage costs or usage anymore because data storage gets way cheaper."
Ricardo Kissinger
Head of IT Infrastructure and IT Security
