Grafana Guide
A Guide to the TIG Stack — Telegraf, InfluxDB, and Grafana
Grafana is an open-source software platform for visualizing time series analytics and monitoring. Various Grafana data sources, such as InfluxDB, AWS CloudWatch, Timestream, and Prometheus, can be used seamlessly to produce Grafana dashboards. These dashboards are helpful because they bring together data and help users gather real-time insights. So no matter where your data is or what kind of database it lives in, you can get it together with Grafana.
What is Grafana?
Grafana is an open-source visualization and analytical tool that allows users to query, visualize, get alerts on and explore the actual application and system metrics and events that matter most to them – regardless of where they are stored.
In layperson’s terms, Grafana allows users to turn multiple data sources like the InfluxDB time series database (or TSDB for short) into graphs and visualizations that take even the most sophisticated concepts and make them far more accessible for people to understand.
All of this is in service of the most crucial goal: ensuring developers have access to the information they need to make more intelligent and informed decisions about the performance of their IoT, analytics, and cloud applications.
How Grafana and InfluxDB work
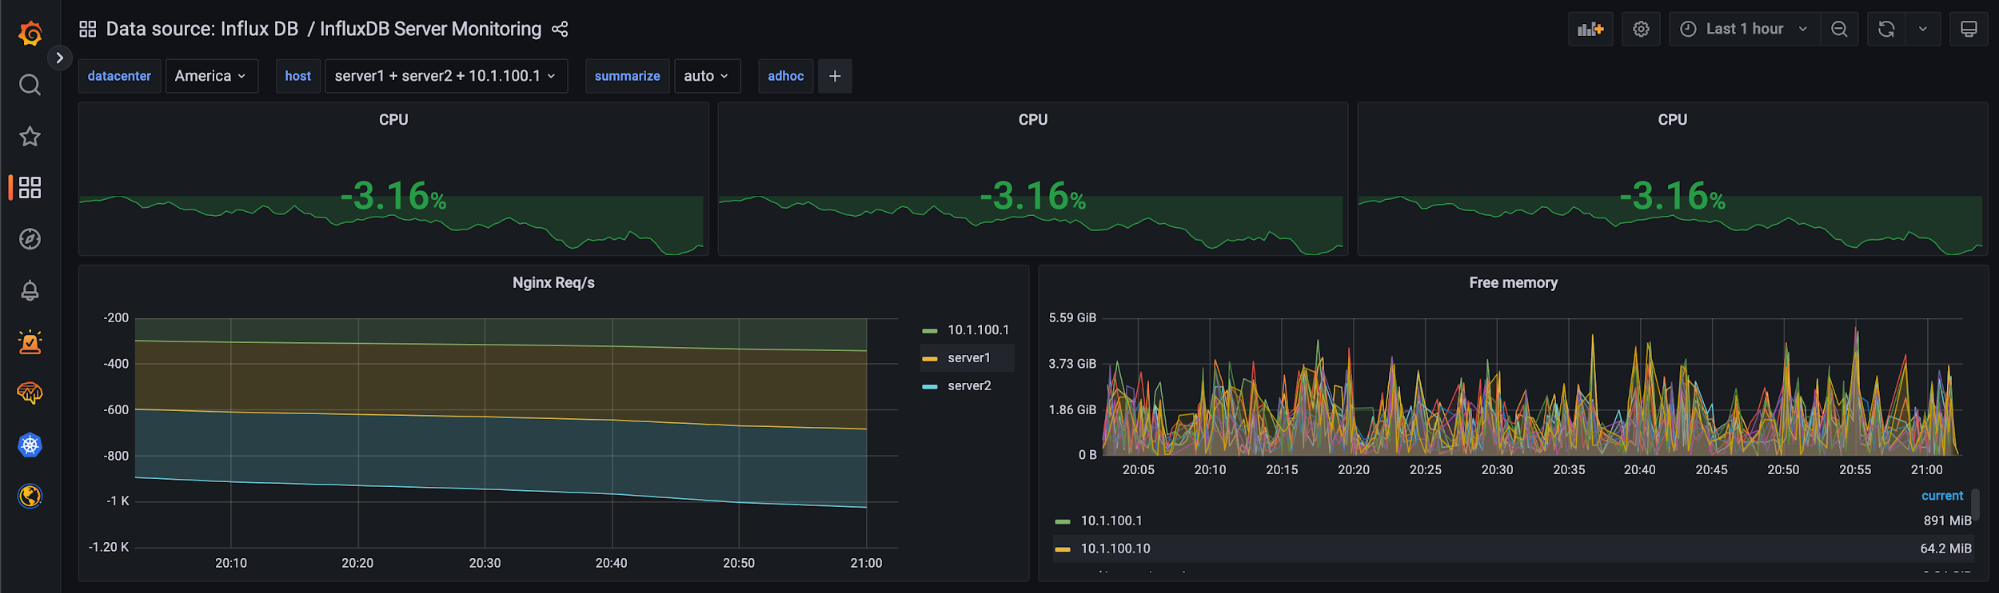
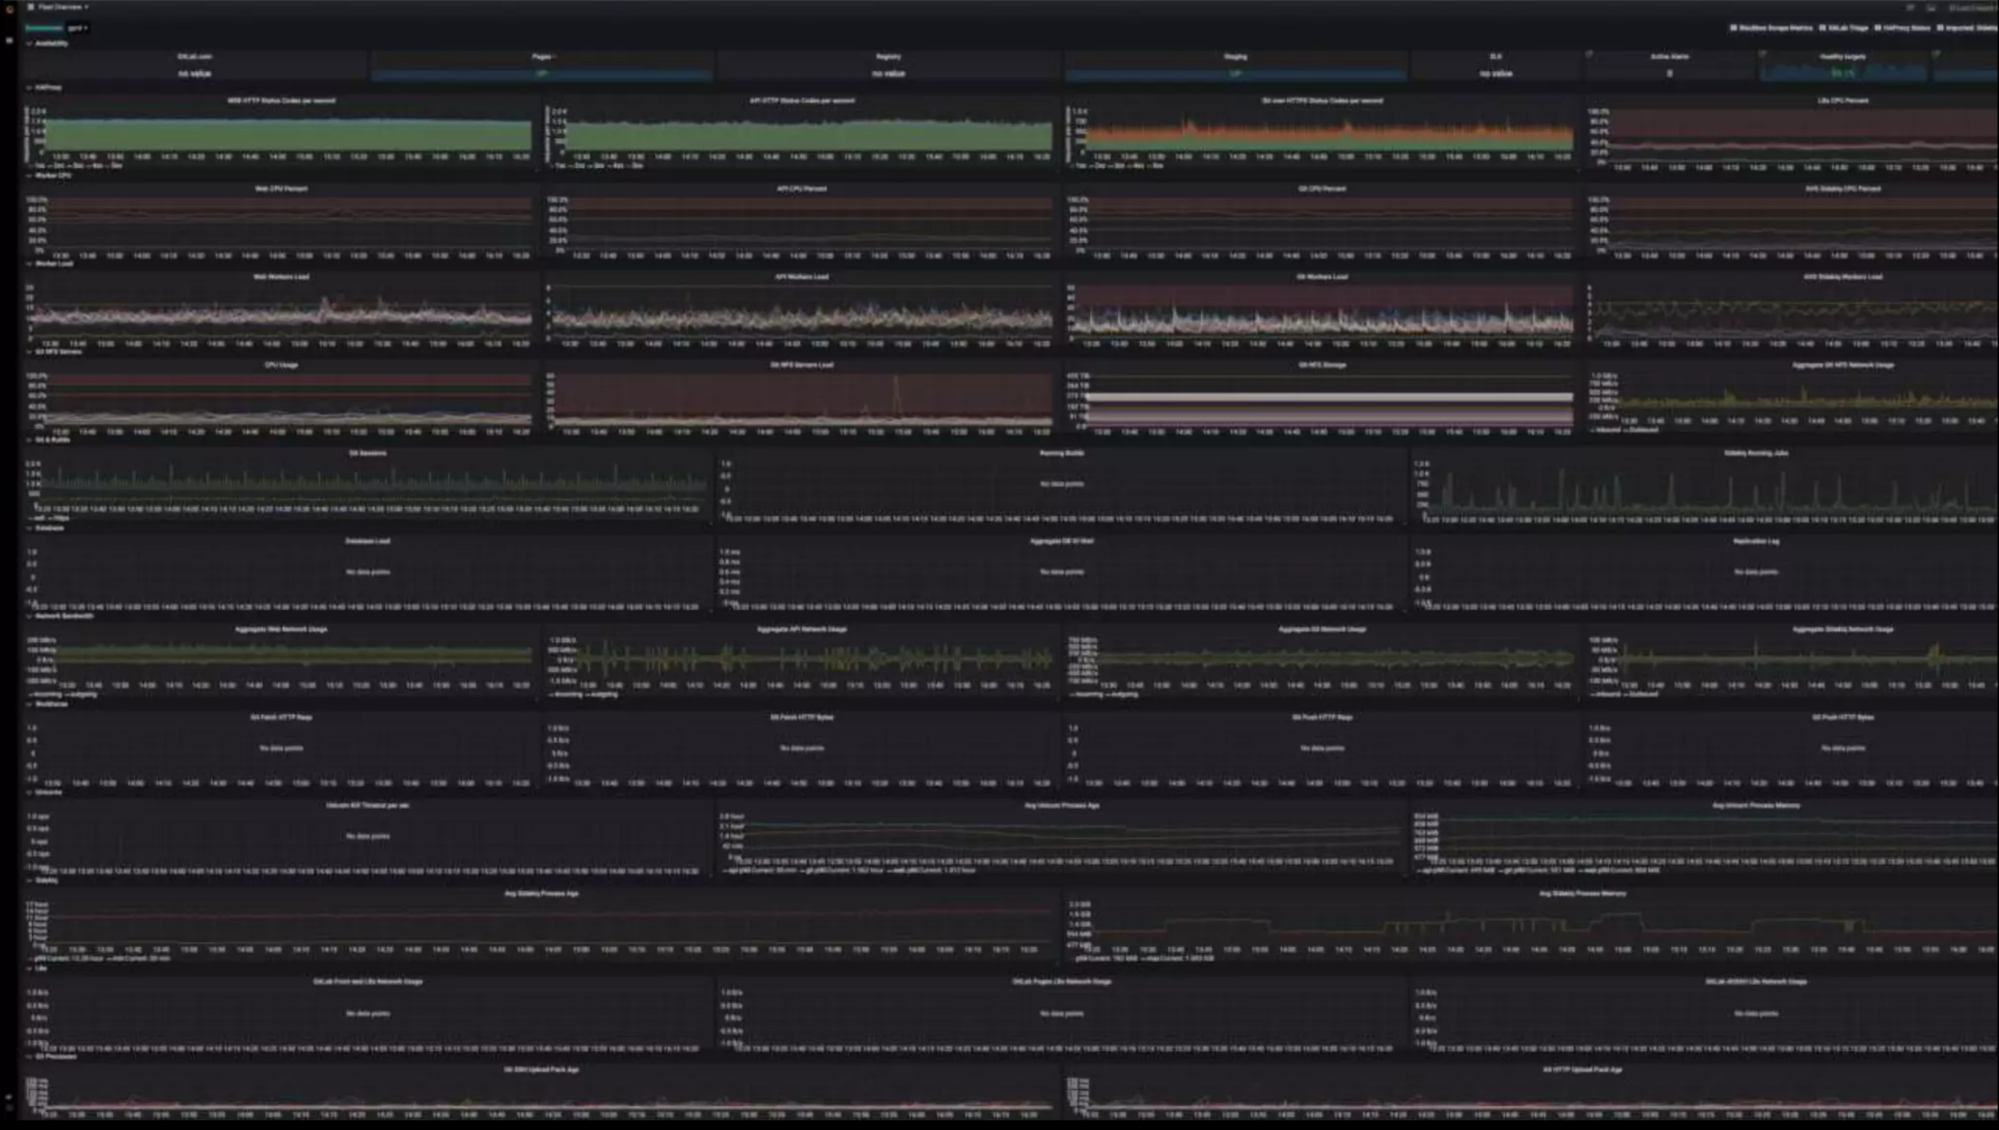
Grafana provides out-of-the-box support for graphing data collected by Telegraf and stored in an InfluxDB database to help developers build monitoring solutions to collect data from system loads like CPU, memory, Disk IO, and custom metrics. Once the InfluxDB data source is connected to your Grafana instance, you can use one of the supported query languages (InfluxQL, Flux, or SQL). These queries can be the basis of your Grafana dashboards.
Telegraf
Telegraf is an open-source plugin-driven server agent collecting and sending metrics and events from databases, systems, and IoT sensors. Some popular plugins include Kafka, MQTT, SQL Server, JMeter, and more.
InfluxDB
The InfluxDB database is the open source time series database for developers to help them get any data – metrics, events, logs, traces. Data from systems, sensors, queues, databases, and networks is stored in a high-performing engine capable of ingesting billions of data points per second.
Grafana
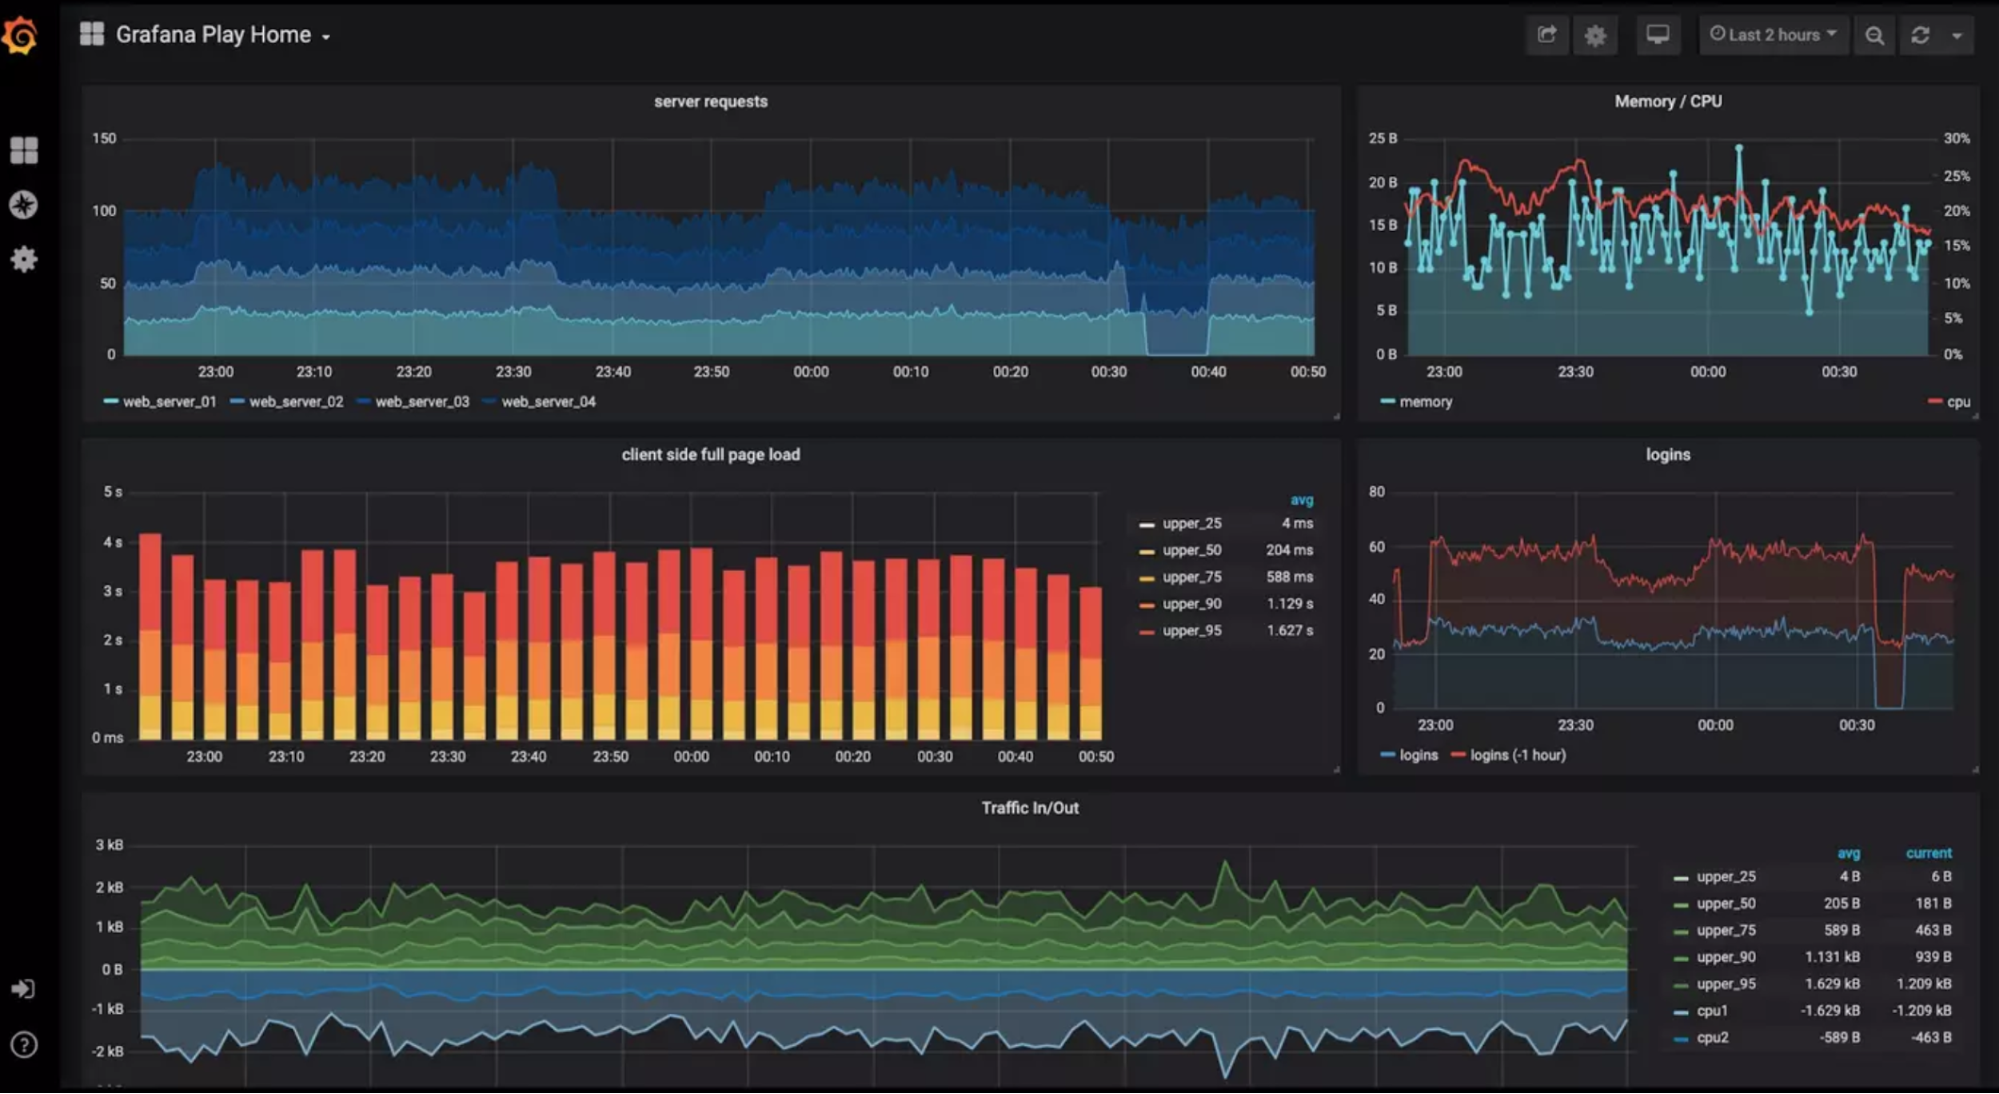
An open-source visualization and analytical tool that can natively query and visualize time series data collected by Telegraf and stored in InfluxDB. Grafana supports several visualization options, such as time series, heatmaps, histograms, bar charts, traces, logs, and node graphs.
To connect Grafana to InfluxDB, in the Grafana UI, click “Add data source” and choose InfluxDB.
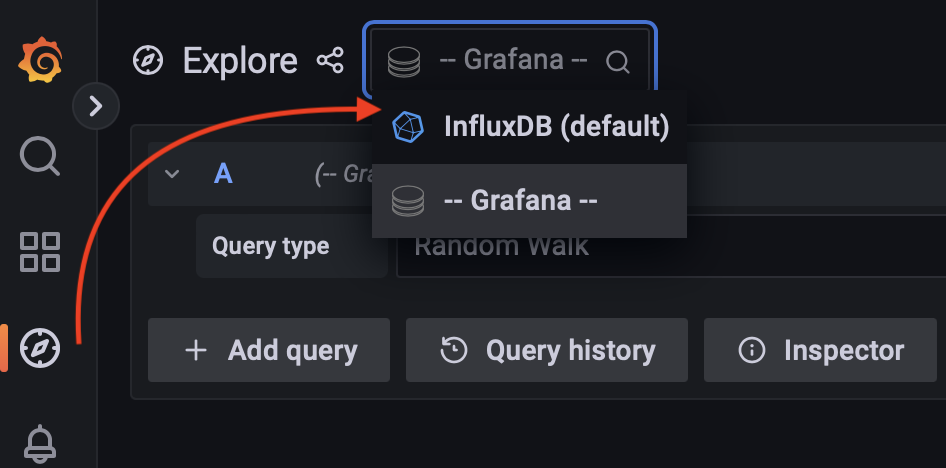
Once configured to use the InfluxDB data source, Grafana has support for popular query languages like InfluxQL, Flux, and SQL to allow you to visualize metrics on your terms. For example, you can dive deep into your time series data using ad-hoc queries or dynamic drill-down.
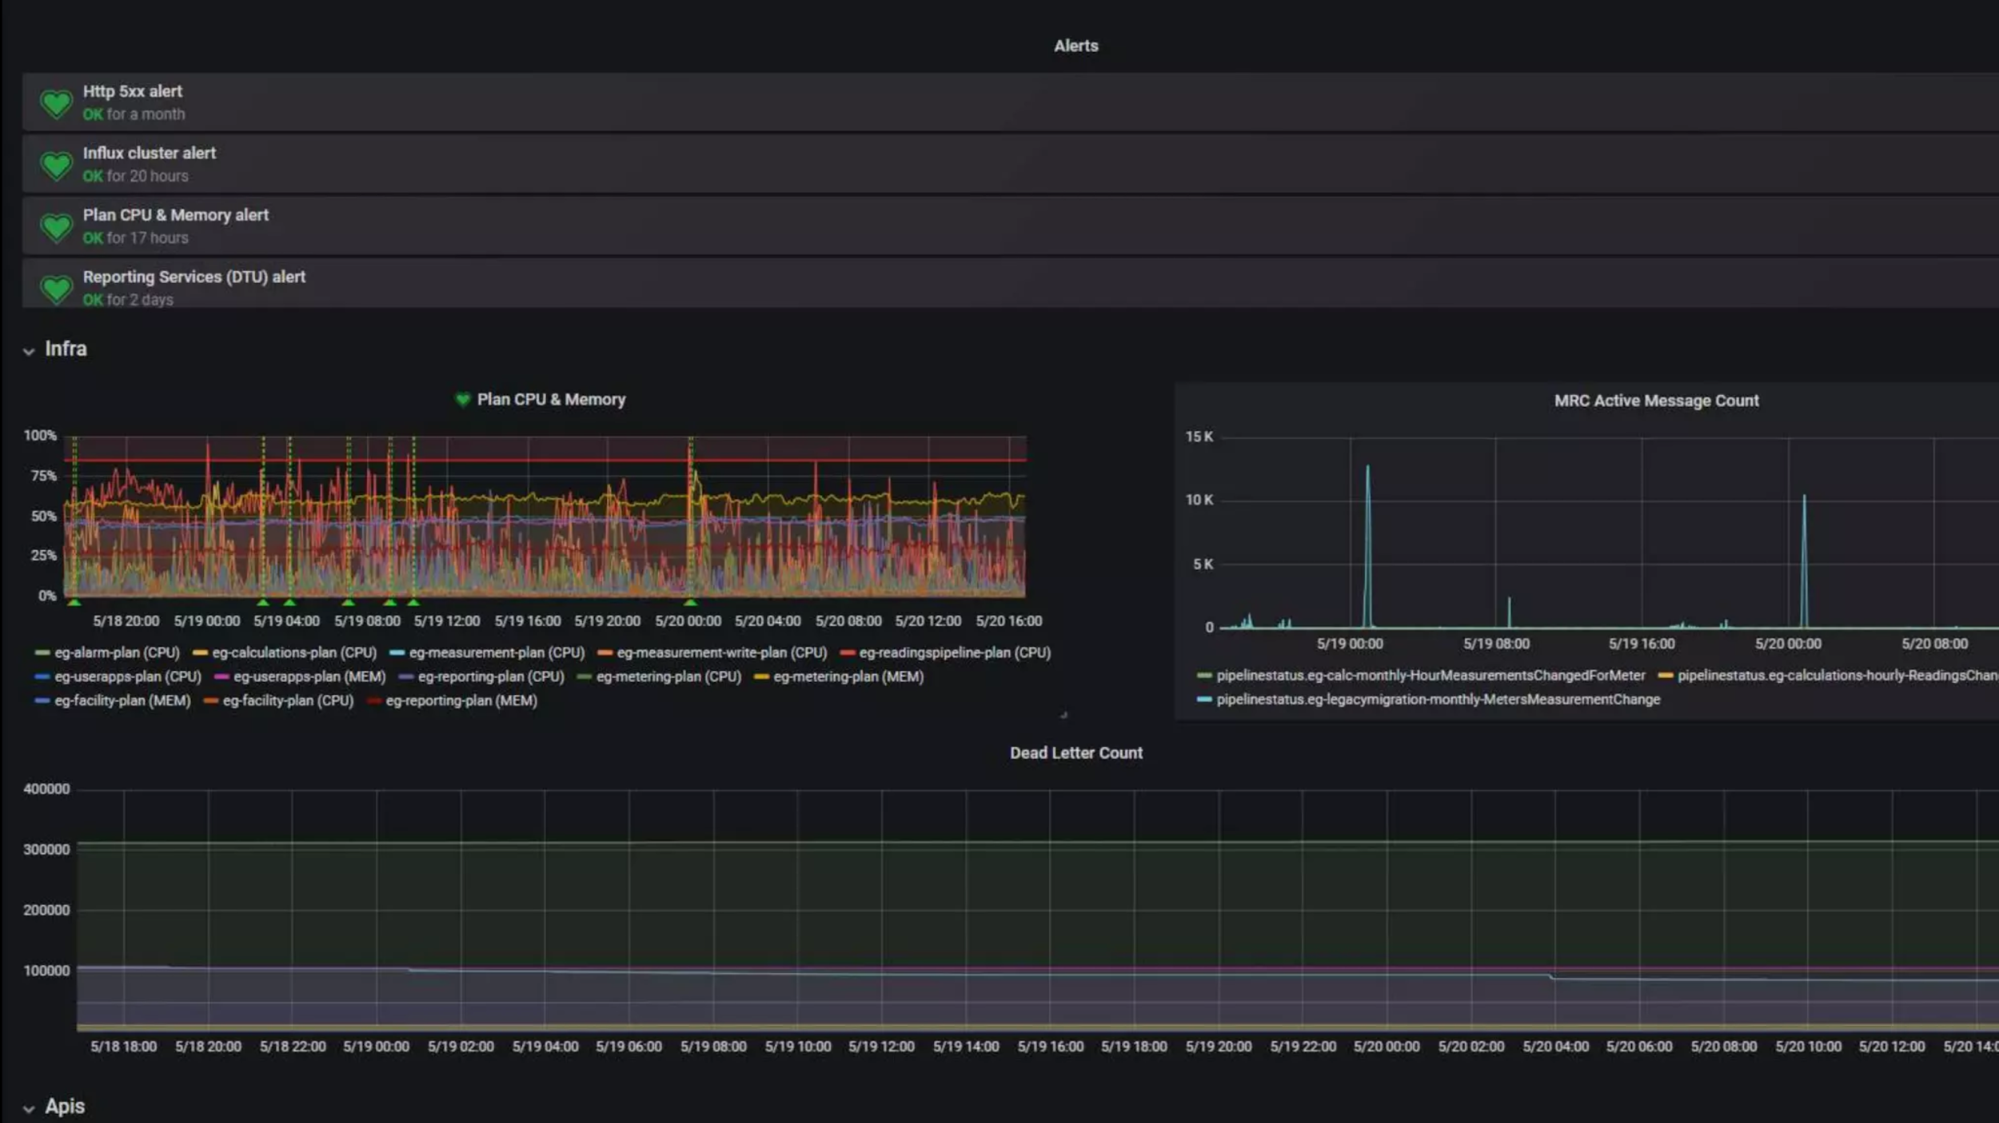
In addition, you can employ the split view features to look at how different time ranges compare or view entire data sources side-by-side. Alerts also allow you to create various notifiers with minimal code required to ensure you’re always aware of important events, no matter what.
Grafana use cases
Developers use the Grafana stack sometimes referred to as the TIG stack (Telegraf, InfluxDB, Grafana) to build time series solutions that cover various industries for various use cases.
Monitoring with Telegraf, InfluxDB, and Grafana
Use the TIG Stack to collect metrics and gain observability into applications, servers, and networks.
Network monitoring use cases with InfluxDB and Grafana
Featured customers include Red Hat, who collected metrics from over 14,000 interfaces and 1600+ devices to build an observability solution that improved operational visibility.
DevOps monitoring use cases with InfluxDB and Grafana
Use infrastructure and application performance monitoring metrics to gain visibility into applications, networks, containers, routers, switches, private and public clouds, and environments. Featured customers include Cisco, who built custom DevOps Monitoring solutions that helped them achieve greater observability by leveraging the InfluxDB platform.
Developer tools
Rely on InfluxDB and Grafana to simplify and expedite the ingestion and use of time-stamped data for better workflows and alerting.
Game monitoring with Telegraf, InfluxDB, and Grafana
Use the TIG Stack for better gaming environment observability for faster detection and reduced downtime. Playtech built a system that combines monitoring and alerting for business indicators (BIs) and Key Performance Indicators (KPIs) using the regularity of economic processes with the use of InfluxDB, Alerta, and Grafana.
Grafana and InfluxDB built monitoring solutions for cloud applications
The TIG stack gives you everything you need to construct a system to monitor your cloud-based applications. For example, Robinhood used InfluxDB, Grafana, and Faust, an open-source Python stream processing library for Kafka streams, to create an automated threshold-based anomaly detection system.
IoT and IIoT monitoring use cases with InfluxDB and Grafana
Use Telegraf, InfluxDB, and Grafana to collect sensor and device metrics from factories, manufacturing plants, satellites, and smart devices. This will allow management and operations teams to gain deep insights into the health and productivity of the machines on the factory floor.
Industrial IoT analytics with the TIG Stack
Industrial IoT solutions using Telegraf, InfluxDB, and Grafana provide real-time insight and analytics into manufacturing processes — collecting, storing, and visualizing data from sensors, PLCs, SCADAs, and industrial equipment. Texas Instruments uses the TIG stack to discover inefficiencies across its operations and to improve product standards.

Enterprise IoT solutions with Grafana and InfluxDB
Such solutions enable businesses to connect physical objects with enterprise systems. EnerKey’s energy management platform dramatically increases their customers’ energy cost savings.
Install Telegraf, InfluxDB, and Grafana
Telegraf
Telegraf is written in Go, compiling into a single binary with no external dependencies, and requires a minimal memory footprint. Download Telegraf for your platform or architecture (Linux, Windows, Mac OS, Ubuntu & Debian, RedHat & CentOS) and follow the installation instructions in the documentation.
InfluxDB
InfluxDB is written in Go and contains everything you need in a single binary. Download InfluxDB for your platform or architecture (Linux, Windows, Mac OS, Docker, Kubernetes, Raspberry Pi) and follow the installation instructions in the documentation. Once your InfluxDB instance is up and running, you can update your Telegraf configurations to send the data to your instance.
Grafana
Download and install Grafana for your platform (Debian / Ubuntu, RPM-based Linux - CentOS, Fedora, OpenSuse, Red Hat, macOS, and Windows). Once installed, in the data source configuration, select InfluxDB data source, then start to explore metrics.
Grafana and InfluxDB resources and tools
- Blog: How to Build Grafana Dashboards with InfluxDB, Flux, and InfluxQL
- Docs: Use Grafana with InfluxDB Cloud
- Integrations: InfluxDB and Grafana
- Webinar: How to Monitor DOCSIS Devices Using SNMP, InfluxDB, Telegraf, and Grafana
- Blog: How to Setup InfluxDB, Telegraf and Grafana on Docker: Part 1 & Part 2

InfluxDB and Grafana FAQ
What are InfluxDB and Grafana?
InfluxDB is an open source time series database that collects and stores metrics from your systems, devices, and stacks. Grafana is an open source dashboard tool used with a number of data sources. Together developers can build real-time monitoring systems for DevOps and IoT analytics use cases.
How do I link InfluxDB to Grafana?
Grafana has native support for InfluxDB as a data source. Users configure Grafana to use either InfluxDB Cloud or a local InfluxDB instance when building dashboards with their preferred query language (SQL, InfluxQL, or Flux).
Which database is best for Grafana?
Grafana supports several different data sources like time series databases such as Graphite, Prometheus, InfluxDB, AWS Timestream, and more. In addition, you can use Grafana with log data stores like Elasticsearch and Splunk.
For what purpose is Grafana used?
Developers use Grafana with InfluxDB to build visualizations (dashboards) for their time series (metric and event) data. These dashboards support many useful graphs across various use cases.
Is there any GUI for InfluxDB?
Yes. InfluxDB has a built-in web administration user interface that helps users take a look at their buckets, query their data, assign permissions, build queries and tasks as well as some light dashboards use. For any significant use, whether writing or querying data, the HTTP API (reading, writing), the client libraries, or the command line interface are other options.
Is Grafana the same as Tableau?
There are major differences between Grafana and Tableau. Grafana is an extensive software application while Tableau focuses more on Business Analytics. Grafana has excellent capabilities in time series, application monitoring, and server monitoring. It’s surprisingly difficult for a person to learn Tableau using a server.
What is the difference between Kibana and Grafana?
Kibana can be used to convert ELK log data into time series data for visualization and can also store and retrieve logs. Grafana has been developed as an interactive visualization tool that can handle a few sets of data, like time series from logs as well. However, Grafana is not designed to handle text search.

