New in Telegraf 1.18.0: Beat, Directory, NFS, XML, Sensu, SignalFX and More!
By
Samantha Wang
updated December 14, 2025
Use Cases
Product
Developer
Navigate to:
Last week we released Telegraf 1.18 with a range of new plugins including Elastic Beats, directory monitoring, NFS, XML parsing and some aggregators and processors to help with your data ingestion. All of these packages were written in Go 1.16.2.
This was one of our largest releases in a while and couldn’t have been done without the 70+ Telegraf community members who contributed to writing plugins, fixing bugs, reviewing code, and everything else to improve Telegraf!
Here’s a quick look into some new plugins and features we launched in Telegraf 1.18.
How to monitor your NFS devices with Telegraf
NFS (Network File System) was designed by Sun Microsystems in 1984. NFS is a distributed file system protocol that allows users on a client computer to access files over a network in the same way they would access a local storage file.
The Telegraf NFS Client Input Plugin collects NFS Client per-mount statistics (/proc/self/mountstats) data. By default, only a limited number of general system-level metrics are collected including basic read/write counts, total number of bytes exchanged during an operation, number of milliseconds it took to process the operation, and the round-trip time for operations. Depending on your configuration settings in the plugin, you may retrieve additional metrics about your NFS operations.
An NFS plugin has been a request from the Telegraf community for a while, so a big shout-out to Telegraf community member @pmoranga for getting the final version of the plugin over the finish line and into our 1.18 release.
How to monitor your Elastic beat instances with Telegraf
Elastic beats are lightweight data shippers and consist of Filebeat, Kafkabeat, Metricbeat, and many more. The Telegraf Beat Input Plugin provides the capability to collect metrics of your Beat instances. The plugin collects Beats metadata, read/write errors, memory usage, and more depending on what type of beat you’re monitoring.
Thank you to Telegraf community member Nathan Ferch (@nerfch) for the plugin!
How to monitor a directory of files with Telegraf
People using Telegraf to read a file will very often use the File Input Plugin or Tail Input Plugin. For every specified interval, the inputs.file plugin parses the complete contents of a CSV, Line Protocol or any other supported input data format. Meanwhile, the aptly named Tail Input Plugin “tails” or reads in only the newly appended lines of a file.
However, neither of these plugins have the capability to monitor an entire directory of files while being able to move files after processing them or handling errors. The new Telegraf Directory Monitoring Input Plugin in Telegraf 1.18 monitors a single directory (without looking at sub-directories), and parses and ingests each file placed in the directory. Supported input formats include Prometheus, line protocol, JSON, XML, CSV, and more.
The plugin will gather all files in the directory at a configurable interval, and parse the ones that haven’t been picked up yet. Once a file has been gathered, it will be placed in another directory, in order to not be picked up again by the plugin.
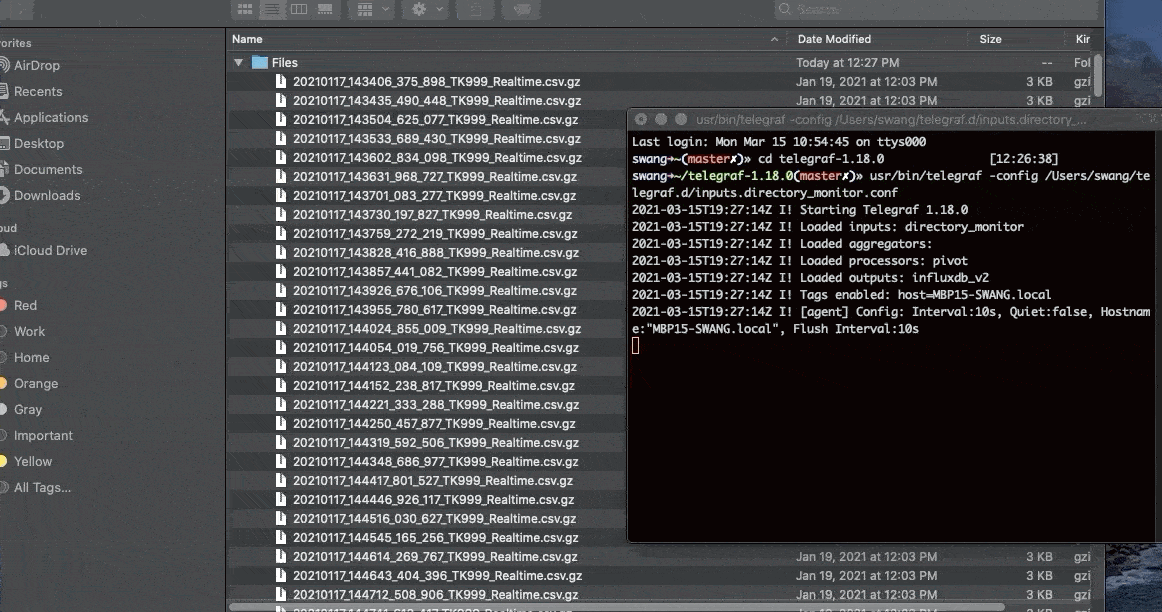
This plugin is intended to read files that are moved or copied to the designated directory monitored, and thus files should also not be used by another process, or else they may fail to be gathered. The directory monitoring plugin, like the File and Tail plugins, expect messages to be in one of the supported input data formats.
Many thanks to Influxer David Bennett (@jagularr) for creating this plugin.
How to enrich your AWS EC2 metrics with Telegraf
A new AWS EC2 Metadata Processor Plugin was also added to the release. This processor gathers metadata from your EC2 instances, including account ID, image ID, instance ID, region, and more.
Major props to Patryk Malek (@pmalek-sumo) from Sumo Logic for the processor!
How to enrich Telegraf metrics with geographic data
Telegraf community member a-bali added a GeoIP Processor Plugin that looks up IP addresses in the MaxMind GeoLite2 database and adds the respective ISO country code, city name, latitude and longitude. From there, you can process your lat/long coordinates using the Telegraf s2 geo processor. Make sure you include the order you want your processors run with order=n or else they will run with a random sequence. When your data is in InfluxDB, query the data using the Flux Geo package to find data points within a specified region, using s2 geometry that can represent any region on Earth, from many miles across to about one centimeter across.
This allows you to better understand where your time series data points are coming from, which is often useful in a range of IoT (Internet of Things) use cases, such as viewing fixed buildings or structures on a map. It’s also useful when viewing customer engagement metrics, such as end-user response time monitoring.
How to parse your XML data with Telegraf
XML (Extensible Markup Language) was designed to store and transport data with focus on describing what the data is. XML has tags that identify the data and is used to store and organize the data. It provides a flexible way to create tags and electronically share your structured data.
With the Telegraf XML parser, XML is now one of the supported input data formats for Telegraf. Any input plugin containing the data_format option can be set to xml and begin parsing your XML data. The XML parser will break down your XML string into metric fields using XPath expressions. The metrics from your XML data can be designated as tags and fields can be designated as subtables with [inputs.file.xml.tags] and [inputs.file.xml.fields]. Check out the parser documentation for full details on how to configure your plugin to read in your XML data.
Major shout-out to one of our Telegraf Community Developers, Sven Rebhan (@srebhan) of Honda Research Institute-Europe, on getting this parser into Telegraf.
Perform quantile and derivative calculations on your data with Telegraf
Telegraf 1.18 also introduced a couple of new aggregators: quantile & derivative. The Telegraf Quantile Plugin aggregates specified quantiles for each numeric field per metric it sees and emits the quantile for every period you designate. As background, percentiles divide a distribution into 100 equal parts, quartiles divide a distribution into four equal parts, and deciles divide a distribution into ten equal parts. Quantiles divide a distribution into any number of equal parts, and thus are more generalized than percentiles, quartiles, and deciles. Thanks again to Sven Rebhan for this plugin!
The new Telegraf Derivative Aggregator Plugin estimates the derivative for all fields of the aggregated metrics over a designated time interval. On default, the aggregator determines the first and last metrics of the designated time interval. From these designations the time difference in seconds is calculated and used to divide the difference of each field using the following formula:
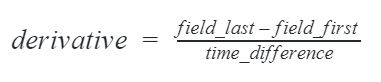
The derivative aggregator will emit a field with a naming pattern <fieldname>_rate. So in the plugin example, if you are reading in bytes_sent or packets_sent the derivative aggregator will result in a field for bytes_sent_rate and packets_sent_rate. You can read more on how custom derivatives can be calculated with the aggregator in the plugin documentation.
Thanks to Telegraf community member Karsten Schnitter (@KarstenSchnitter) of SAP for the awesome aggregator and terrific documentation for the plugin.
How to send data to Grafana Loki with Telegraf
Grafana has been one of InfluxData’s long time technology partners, as many users visualize their InfluxDB data in Grafana Dashboards. Grafana Loki specifically is a set of components that can be composed into a fully featured logging stack.
The Telegraf Loki Output Plugin can be used to send logs to Loki. The plugin can easily be configured to output to both Grafana Loki and any version of InfluxDB, allowing you to dual-write logs and providing one less point of vendor lock-in. Speaking of logs, keep an eye out for the upcoming release of InfluxDB IOx, which greatly enhances InfluxDB’s ability to work with log data.
Many thanks to Telegraf community member Labesse Kévin (@Eraac) of AB Tasty for contributing this plugin.
How to send data to Google BigQuery with Telegraf
This plugin writes to the Google Cloud BigQuery. Contributed by Telegraf community member @gkatzioura
How to send data to Splunk SignalFX with Telegraf
This plugin sends metrics to SignalFx. Contributed by Telegraf community member Ben Keith (@keitwb) of Splunk/SignalFX.
How to send data to Sensu with Telegraf
Sensu is another one of InfluxData’s technology partners. Sensu Go is designed to provide monitoring and observability into containers, applications, cloud infrastructure, and more. The team over at Sensu wrote the Telegraf Sensu output plugin to write metrics events to Sensu Go via Sensu’s Events API. If you, by chance, already have data in Sensu and are wondering how to send your metrics from Sensu to InfluxDB, Sensu provides an integration for converting Sensu metrics into InfluxDB Line Protocol.
Thanks to Telegraf community member Todd Campbell (@nixwiz) of Sensu for this plugin.
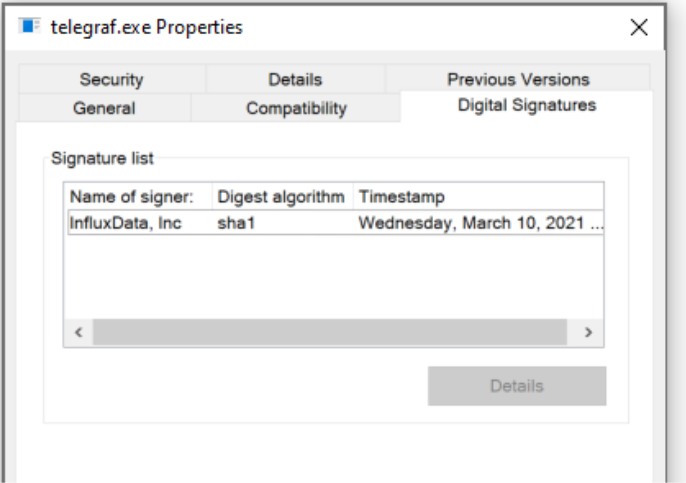
Code signing for Windows and Mac Telegraf binaries
In Telegraf 1.18, we implemented digital signatures into our Telegraf build process for Windows and macOS. These signed executables confirm that Telegraf code has not been altered and corrupted since it was signed.
Signed Telegraf executable for Windows
Previous to Telegraf 1.18, Telegraf builds did not contain digitally signed certificates on executables. This had become a problem for many enterprises with strict access controls that wanted to use Telegraf. In Telegraf 1.18, the Windows binaries include a signed executable and can be viewed in the telegraf.exe properties. There are no changes to the end user experience of downloading and running Telegraf with Windows.
Signed Telegraf executable for macOS
For macOS, a requirement arose in Big Sur that required binaries to be signed and notarized. Users can access this digitally signed macOS build by downloading the <a href="https://www.howtogeek.com/362166/what-is-a-dmg-file-and-how-do-i-use-one/">.dmg</a> version of Telegraf from the Telegraf GitHub releases page. When this file is downloaded, a Telegraf app will download and need to be moved to your machine. If you’re looking for the Telegraf 1.18.0 .dmg for macOS, you can download it here.
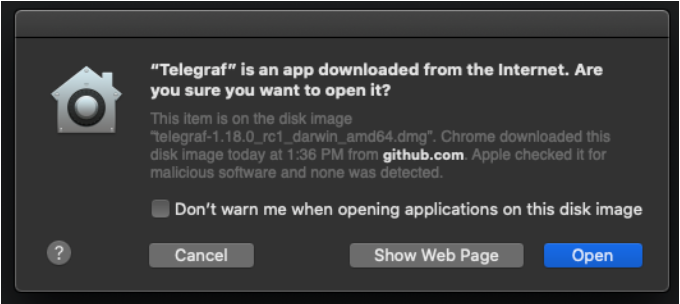
Once the Telegraf application is moved to your machine, you will be alerted that this application was downloaded from the internet and prompted to click “Open” in order to run Telegraf.
From there, a configuration file will be generated and Telegraf can be run through the terminal by accessing ~usr/bin/telegraf. Telegraf can even be run by opening the Telegraf application on your machine and the generated telegraf.conf will run.

...and many, many more exciting plugins and features
Additional input plugins that were included in the release are CS:GO Input Plugin and RavenDB Input Plugin. The CS:GO plugin gathers metrics from Counter-Strike: Global Offensive servers and was contributed by oofdog. We also have an InfluxDB template for CS:GO if you’re looking to start monitoring your data for a player on the CS:GO official servers with your API key and Steam User ID.
The RavenDB plugin reads metrics from your RavenDB server via monitoring endpoints APIs. Thank you to Telegraf community members Marcin Lewandowski (@ml054) and Casey Barton (@bartoncasey) for the plugin!
Telegraf 1.18 has also introduced another output data format for Telegraf. The MessagePack Serializer converts metrics into MessagePack format, an efficient binary serialization format. The serializer can be used when configuring your output plugin by setting the data_format option to msgpack and all your data will be sent out in MessagePack format. Thanks to Telegraf community member Jason Kim (@dialogbox) for writing the serializer!
We also added to our list of external plugins this release:
- A Plex Webhook Input Plugin was built by InfluxData's own Russ Savage (@russorat). The plugin listens for events from Plex Media Server Webhooks and allows you to gather stats on all your Plex movie and TV watching.
- A contribution from Telegraf community member @jhpope on our first Python external plugin SMCIPMITool Input Plugin. This plugin parses the output of SMCIPMITool into line protocol.
All these plugins can be used seamlessly with their respective execd plugin. Read more on how you can write your own external plugin. Thanks again to all these contributors!
Check out the full list of features and bug fixes for improvements on Telegraf across the board. Then go ahead and download or upgrade to Telegraf 1.18 to try them out. As always, feel free to reach out to us or engage with the community on our Telegraf GitHub page, InfluxData Slack channel or community site.
